Configure NetSuite user preferences to change default Excel export format

NetSuite doesn’t provide user preferences to change the default Excel export format. This is a system-wide limitation that cannot be configured at the user, role, or company level, leaving everyone stuck with the same problematic XML Spreadsheet 2003 format.

Here’s how to get the configuration control and personalization that NetSuite’s export system lacks.

Get personalized data configurations that NetSuite can’t provide

Coefficient provides the configuration control NetSuite lacks through user-specific connection settings, customizable import configurations, and personalized refresh preferences. Each user can configure their own workspace to match their workflow needs.

How to make it work

Step 1. Set up personalized import templates.

Create custom import configurations for your most-used NetSuite data sources. Save field selections, filter settings, and column ordering preferences that match your specific analysis needs, then reuse these templates whenever you need fresh data.

Step 2. Configure individual refresh schedules.

Set up refresh schedules based on your personal workflow – some users need hourly updates for sales data, others prefer daily financial report refreshes. Each import can have its own schedule without affecting other users’ configurations.

Step 3. Customize data format and presentation.

Control how your data appears in Excel through native formatting capabilities. Since data imports directly in XLSX format, you can use all modern Excel features and save formatting preferences that persist across refreshes.

Get the flexibility NetSuite’s export system denies

Each user deserves data configurations that match their workflow needs. Coefficient provides the personalization and control that NetSuite’s rigid export system can’t deliver. Configure your workspace the way you need it.
Connect Excel to NetSuite general ledger data automatically

Connecting Excel to NetSuite general ledger data automatically requires handling complex authentication and API limitations that traditional external data connections can’t manage.

Here’s how to establish automatic GL data connections with multiple import methods and scheduled refresh capabilities.

Access NetSuite GL data automatically using Coefficient

Coefficient solves this through multiple import methods specifically designed for GL data access from NetSuite . You get direct access to Account records, Transaction records, and related GL data with field selection capabilities.

How to make it work

Step 1. Choose your GL data import method.

Use Records & Lists for direct Chart of Accounts access, Reports method for standard General Ledger reports, or SuiteQL Query for custom SQL-like queries with joins and aggregations.

Step 2. Configure your data selection.

Select specific fields, apply filters using AND/OR logic, and set up configurable periods and accounting books. Preview your data to ensure accuracy before importing.

Step 3. Set up automatic refresh scheduling.

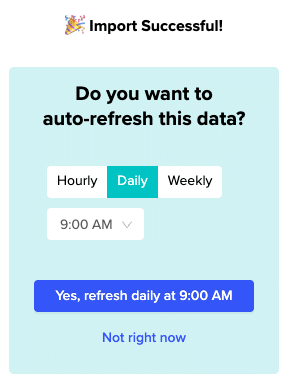
Configure hourly, daily, or weekly updates to maintain current GL data. The system handles NetSuite’s 7-day token refresh requirement transparently.

Step 4. Handle large datasets efficiently.

The system supports up to 100,000 rows per query with filtering capabilities, accommodating detailed GL analysis without performance issues.

Reliable GL connections without ODBC complexity

Unlike ODBC drivers or Power Query connections that struggle with NetSuite’s OAuth 2.0 requirements, this native integration handles all authentication automatically. Start connecting your NetSuite GL data to Excel automatically.

Connect month-end trial balance snapshot to Google Sheets for variance analysis

Month-end variance analysis requires consistent trial balance snapshots and period comparisons that are time-consuming to create manually. You can automate month-end trial balance snapshots with built-in variance analysis workflows that eliminate manual reporting tasks.

This automated approach provides rich variance analysis capabilities for comprehensive financial review processes.

Automate month-end snapshots and variance analysis using Coefficient

Coefficient provides excellent capabilities for connecting month-end trial balance snapshots from NetSuite to Google Sheets with automated variance analysis workflows. You can schedule snapshots and create comprehensive period comparisons automatically.

How to make it work

Step 1. Configure scheduled month-end imports.

Set up daily refresh schedules that activate on month-end dates using reporting period parameters for specific month-end snapshots. Create separate imports for current versus prior periods and maintain historical snapshots in dedicated sheets for audit trail purposes.

Step 2. Set up automated variance analysis imports.

Import current month trial balance alongside prior month and prior year comparisons for comprehensive analysis. Name your imports consistently like “Trial Balance – Oct 2024”, “Trial Balance – Sep 2024”, and “Trial Balance – Oct 2023” to maintain organization and enable automated calculations.

Step 3. Build period comparison analysis with SuiteQL.

Write SuiteQL queries for direct period comparisons. Example query: SELECT account.accountnumber, account.displayname, curr.balance as current_balance, prev.balance as prior_balance, (curr.balance – prev.balance) as variance FROM account LEFT JOIN (SELECT * FROM accountbalance WHERE period = ‘2024-10’) curr LEFT JOIN (SELECT * FROM accountbalance WHERE period = ‘2024-09’) prev.

Step 4. Create automated variance calculations and alerts.

Use Google Sheets formulas to calculate variance amounts and percentages automatically. Set up conditional formatting to highlight variances exceeding predetermined thresholds and create data validation rules for variance explanations. Build drill-down links to supporting detail for investigation purposes.

Step 5. Build advanced analytics and trending.

Create rolling 12-month trending analysis and budget versus actual variance comparisons. Build forecast accuracy measurements and department or class-level variance detail. Set up commentary tracking systems to document variance explanations and maintain historical context.

Transform your month-end close process

Automated variance analysis eliminates manual month-end reporting tasks while providing comprehensive financial review capabilities. This approach ensures consistent analysis across periods and enables faster identification of significant variances. Start automating your month-end variance analysis today.

Connect NetSuite subsidiary Chart of Accounts to master Excel workbook

Coefficient provides robust capabilities for connecting multiple NetSuite subsidiary Charts of Accounts into a master Excel workbook, supporting complex multi-entity consolidations with real-time synchronization.

This solution provides enterprise-grade subsidiary COA management directly in Excel, enabling centralized multi-entity financial management while maintaining subsidiary-level security.

Build comprehensive multi-subsidiary COA management

The system supports both consolidated and separate subsidiary approaches, with automatic consolidation updates and subsidiary-specific customizations maintained throughout the process.

How to make it work

Step 1. Set up subsidiary-specific imports.

Create separate sheets for each subsidiary using Records & Lists → Account with subsidiary filter. Apply filter “Subsidiary equals [Specific Subsidiary]” and import the same fields for consistency across entities including currency handling for multi-currency COAs.

Step 2. Choose your consolidation approach.

For single consolidated import, remove subsidiary filter for all-entity view and include Subsidiary field in import, then create pivot table for subsidiary analysis. For multiple linked imports, use separate import per subsidiary with master sheet using VLOOKUP or Power Query consolidation.

Step 3. Structure your master workbook.

Design with Tab 1 as Consolidated COA (all subsidiaries), Tabs 2-n as Individual subsidiary COAs, Summary Tab for rollup analysis, Mapping Tab for subsidiary-specific variations, and Dashboard for cross-subsidiary comparisons.

Step 4. Configure automated refresh strategy.

Schedule all subsidiary imports simultaneously with consistent timing for data integrity. Set up refresh notifications and monitor for subsidiary-specific changes including elimination entries and intercompany accounts.

Master multi-entity financial management in Excel

This approach enables automatic consolidation updates, centralized multi-entity financial management, and Excel-based consolidation without NetSuite OneWorld complexity. Start building your multi-subsidiary COA management system.

Convert NetSuite saved searches to SQL queries for SuiteAnalytics Connect

Converting NetSuite saved searches to SQL queries is complex due to internal field naming conventions and unique data model structures. The translation process often introduces errors and loses the original search logic you’ve carefully configured.

Here’s how to use your existing saved searches directly in Excel, plus a better approach for users who need SQL-like functionality without manual conversion work.

Import saved searches directly without SQL conversion using Coefficient

NetSuite saved searches can be imported directly into Excel without any SQL translation. This preserves all your search criteria, filters, and custom fields exactly as configured in NetSuite’s interface.

For users who need SQL capabilities, Coefficient offers SuiteQL with built-in syntax assistance that’s optimized for NetSuite’s data structure.

How to make it work

Step 1. Install Coefficient and connect to NetSuite.

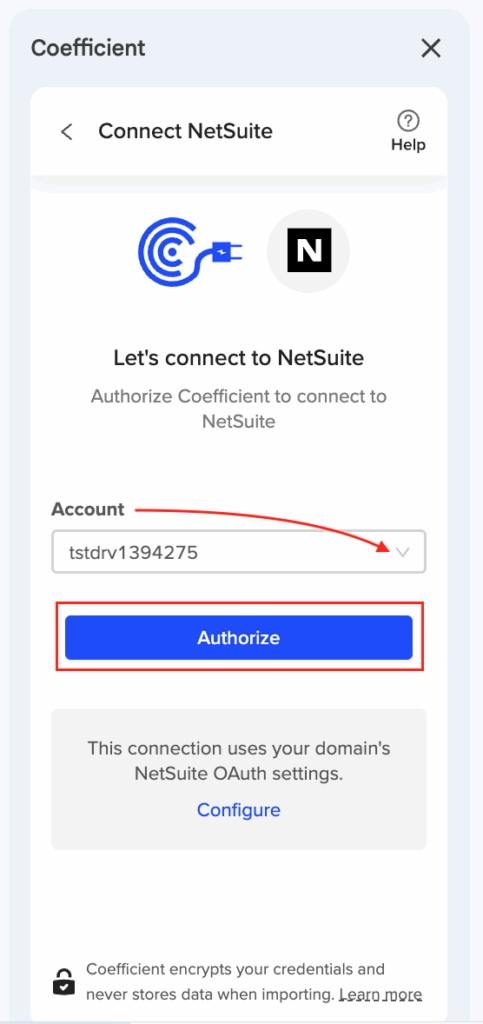
Add Coefficient from Excel’s add-in store and authenticate with your NetSuite credentials using OAuth.

Step 2. Import saved searches directly.

Select “Saved Searches” from Coefficient’s menu, choose your existing search from the dropdown, and click import. All search logic transfers without conversion.

Step 3. Use SuiteQL for custom queries (optional).

If you need SQL functionality, select “SuiteQL Query” instead. Write queries with NetSuite-specific syntax using autocomplete assistance for table and field names.

Step 4. Set up automated refresh.

Schedule your imports to refresh hourly, daily, or weekly. Both saved searches and SuiteQL queries update automatically without manual intervention.

Preserve your NetSuite configuration investment

This approach saves hours of SQL conversion work while maintaining the reliability of your existing saved searches. You get the same data in Excel without the risk of translation errors or lost business logic. Try Coefficient to import your NetSuite saved searches directly without SQL conversion complexity.

Cost comparison of NetSuite Excel integration tools with trials

NetSuite Excel integration costs vary dramatically between traditional ODBC approaches and modern API-based solutions, with potential annual savings of $5,000-$6,000 when choosing the right tool and trial strategy.

Understanding the total cost of ownership, including hidden infrastructure and maintenance expenses, helps you make informed decisions during trial periods and avoid costly long-term commitments.

Compare true integration costs during extended trials using Coefficient

Coefficient offers transparent, user-based pricing with no hidden infrastructure costs, making it significantly more affordable than traditional ODBC approaches. During the free trial, you can test all import methods, automated scheduling, and large dataset handling without restrictions.

The biggest cost advantage comes from eliminating NetSuite ODBC licensing ($3,000-$5,000 annually) and avoiding infrastructure requirements like database servers and ongoing IT support.

How to make it work

Step 1. Calculate your current integration costs.

Add up NetSuite ODBC licensing ($3,000-$5,000/year), ODBC driver costs ($500-$1,500/year), infrastructure expenses, and IT support time. Traditional approaches typically cost $5,000-$10,000+ annually.

Step 2. Test full functionality during trial periods.

Use the first week to test connection setup and basic imports from NetSuite Records & Lists. Week two should focus on automated refresh reliability and scheduling options. Week three involves testing complex SuiteQL queries and large datasets up to 100,000 rows. Week four assesses user adoption and training requirements.

Step 3. Evaluate enterprise platforms carefully.

Celigo typically costs $2,000-$5,000 monthly with $10,000-$50,000 implementation fees, making it suitable only for comprehensive enterprise integration needs. CData drivers require $500-$2,000 per driver plus 20% annual maintenance fees.

Step 4. Calculate your ROI with modern solutions.

Coefficient’s user-based subscriptions typically range $1,200-$2,400 annually, providing $5,100-$6,300 in annual savings compared to ODBC approaches. Factor in reduced IT support needs and faster implementation times for additional value.

Maximize your integration investment

Modern API-based integration eliminates the hidden costs and complexity of traditional ODBC solutions while providing better reliability and user experience. Extended trials let you validate actual cost savings and functionality before committing. Start your free trial to see the real cost difference for your NetSuite Excel integration needs.

Create Excel invoice summary with expanded line item information

You can create comprehensive Excel invoice summaries with expanded line item information that combines summary totals with detailed product breakdowns in a single organized format.

This approach provides both high-level invoice totals and detailed line item visibility, addressing NetSuite’s limitation of providing either summary or detailed views separately.

Build comprehensive invoice summaries using Coefficient

Coefficient enables creation of comprehensive Excel invoice summaries with expanded line item information, addressing NetSuite’s native limitation of providing either summary-level or detailed views, but not both effectively combined. You can create hybrid data models that combine invoice header summaries with detailed line item breakdowns in a single Excel file.

How to make it work

Step 1. Import Transaction Line records for expanded detail.

Use Records & Lists to import Transaction Line records. This pulls all invoice line items to show expanded detail for each product while maintaining invoice header context.

Step 2. Structure data for both summary and detail views.

Organize data to include invoice totals alongside itemized breakdowns. Include complete item names, descriptions, categories, attributes, pricing breakdown with unit prices, discounts, tax amounts, and extended totals.

Step 3. Include comprehensive line item information.

Select fields for product details, pricing breakdown, quantity information (ordered, shipped, unit of measure), and business context (sales rep, terms, customer purchase orders, delivery information).

Step 4. Create calculated summaries in Excel.

Use Excel formulas to create summary totals from detailed line item data. This gives you both comprehensive line item detail and calculated invoice summaries in the same file.

Step 5. Organize layout for integrated analysis.

Structure data to show invoice totals followed by itemized breakdowns. The Excel environment enables pivot tables, charts, and advanced analysis of the expanded line item data with live data connection for current information.

Start building comprehensive summaries

Comprehensive invoice summaries with expanded line item information provide both high-level totals and detailed visibility for complete business analysis. Create your integrated invoice summaries today.

Creating automated data extracts from item demand planning module to Excel

Automated data extracts from NetSuite’s item demand planning module to Excel eliminate manual export tasks while ensuring your planning processes always have current data. Set up once, then let automation handle the rest.

Here’s how to create automated extracts with direct Excel compatibility, scheduling options, and error notifications for reliable demand planning workflows.

Automate demand planning extracts with direct Excel integration using Coefficient

Coefficient specializes in creating automated data extracts from NetSuite’s item demand planning module with direct Excel compatibility. This eliminates manual export tasks while providing multiple integration options for Excel-based planning processes.

How to make it work

Step 1. Configure your initial demand planning import.

Create your demand planning import using Records & Lists or Saved Search methods. Choose all required fields like Item, Demand Quantity, Planning Date, and Location, then apply filters for planning horizon, item categories, or specific locations.

Step 2. Set up Excel integration options.

Use Coefficient’s Excel add-in for native Excel automation, or set up in Google Sheets then export to Excel. You can also schedule exports that create new Excel files for each planning period automatically.

Step 3. Configure automated scheduling.

Set refresh frequency based on your planning cycle needs: hourly for fast-moving environments, daily for standard planning, or weekly for strategic reviews. Schedule extracts during off-peak hours to minimize system impact.

Step 4. Enable monitoring and notifications.

Set up email notifications for completed extracts and error alerts if extraction fails. This ensures data reliability and lets you know when fresh planning data is available for analysis.

Step 5. Organize multiple automated extracts.

Create separate automated extracts for different planning horizons and use consistent naming conventions for easy file management. Set up multi-import orchestration to chain multiple extracts for comprehensive demand planning datasets.

Streamline your Excel-based planning workflow

Automated extracts eliminate manual export tasks while ensuring Excel-based planning processes always have current demand data. This automation saves time and reduces errors in critical planning workflows. Set up your automated demand planning extracts to Excel today.

Creating automated weekly invoice reports with item-level breakdown in Excel

You can create automated weekly invoice reports with complete item-level breakdowns that show individual product details for each invoice line, not just customer or date summaries.

This approach transforms scattered invoice data into comprehensive weekly reports with complete item-level visibility using automated scheduling.

Build automated item-level invoice reports using Coefficient

Coefficient addresses NetSuite’s limitation of primarily providing summary-level reporting in native reports. You can access Transaction Line records to capture all invoice line items, providing complete item-level detail with automated weekly scheduling.

How to make it work

Step 1. Set up Transaction Line records import.

Use the Records & Lists method to import Transaction Line records. This captures all invoice line items where each line becomes a separate row showing invoice number, date, customer, plus individual item details.

Step 2. Configure your data structure for item-level detail.

Select fields that include both invoice headers and line items: SKU, description, quantity, unit price, extended amount, invoice number, customer, and date. This creates a comprehensive view with complete item-level visibility.

Step 3. Apply date-based filtering for weekly reports.

Set up filters to focus on recent invoices using date ranges. You can filter by invoice date, customer, or specific product categories to customize your weekly report scope.

Step 4. Schedule weekly automatic refresh.

Configure the scheduling feature to refresh data weekly. Choose your preferred day and time, and the system will automatically pull current invoice data with item-level breakdowns.

Step 5. Format your organized Excel structure.

The output shows item codes, descriptions, quantities, and pricing details in an organized Excel structure. Each invoice line item appears as individual rows with complete product information.

Get your automated reports running

Automated weekly invoice reports with item-level breakdowns give you comprehensive visibility into product sales patterns and customer purchasing behavior. Start building your automated reports today.

Creating Google Sheets formulas that reference live NetSuite customer data

Coefficient enables powerful Google Sheets formulas that work with live NetSuite customer data through automated imports. This transforms static spreadsheets into dynamic business tools that always reflect current customer information for better decision-making.

Here’s how to set up live customer data imports and create formulas that provide real-time customer analysis, alerts, and segmentation.

Import live customer data for formula integration

Static customer data quickly becomes outdated and leads to poor business decisions. Coefficient’s automated customer data imports ensure your formulas always work with current NetSuite information, enabling dynamic customer analysis and real-time alerts.

How to make it work

Step 1. Set up automated NetSuite customer data import.

Use Records & Lists to import Customer records, selecting fields like Name, Email, Phone, Credit Limit, Balance, and relevant custom fields. Import to a dedicated “Customers_Data” sheet and schedule hourly or daily refresh for live updates that keep your formulas current.

Step 2. Create customer lookup formulas with live data.

Use VLOOKUP formulas like =VLOOKUP(A2,Customers_Data!A:E,3,FALSE) to return customer email based on customer name. This formula automatically updates when your NetSuite data refreshes, ensuring you always have current contact information.

Step 3. Build credit analysis and alert formulas.

Create formulas that monitor customer credit: =IF(INDEX(Customers_Data!E:E,MATCH(A2,Customers_Data!A:A,0)) > INDEX(Customers_Data!D:D,MATCH(A2,Customers_Data!A:A,0))*0.8,”Credit Warning”,”OK”). This alerts when customer balance exceeds 80% of credit limit using live data.

Step 4. Implement dynamic customer segmentation.

Use QUERY functions for live customer segmentation: =QUERY(Customers_Data!A:G,”SELECT A,E WHERE E > 100000 ORDER BY E DESC”). This creates automatically updating lists of high-value customers based on current NetSuite data.

Step 5. Add error handling and performance optimization.

Include error handling like =IFERROR(VLOOKUP(A2,Customers_Data!A:E,3,FALSE),”Customer Not Found”) to gracefully handle missing customers. Use INDEX/MATCH instead of VLOOKUP for large datasets and create named ranges for easier formula management.

Turn spreadsheets into dynamic customer intelligence tools

These formulas enable customer service dashboards with live contact info, credit management tools with real-time balance updates, and marketing segmentation based on current purchase behavior. Start using Coefficient to create powerful customer analysis tools that always reflect your latest NetSuite data.