HubSpot workflow if/then branches to handle different phone number lengths and formats

HubSpot workflows hit complexity limits fast when using multiple if/then branches for phone number length detection. Each additional phone format requires exponentially more branching logic, making workflows difficult to troubleshoot and maintain.

Here’s how to handle unlimited phone number format variations using spreadsheet conditional logic that’s easier to read and debug.

Simplify phone format complexity using Coefficient

CoefficientHubSpotHubSpoteliminates workflow complexity limits by moving phone number processing to spreadsheets. Importdata, use nested IF statements that are easier to troubleshoot, and export standardized numbers back towithout workflow restrictions.

How to make it work

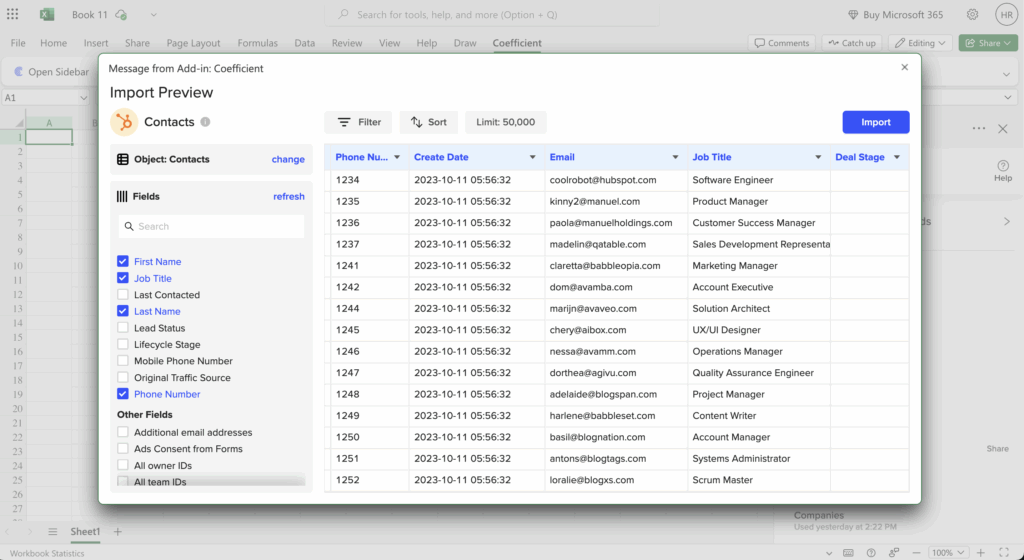
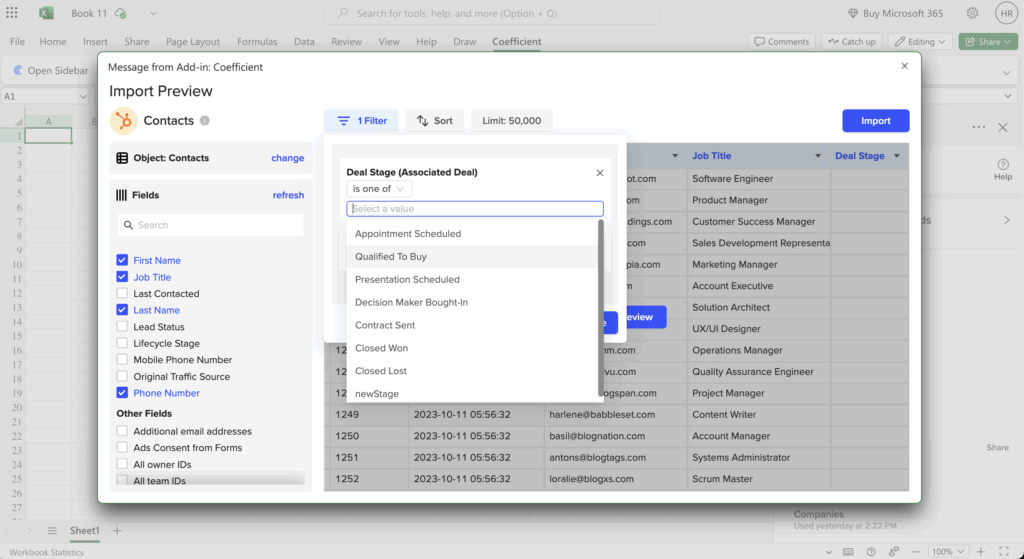
Step 1. Import HubSpot phone number data for processing.

Pull in contact data with phone numbers in various formats and lengths. This gives you the raw data to work with in a more flexible environment.

Step 2. Use nested IF statements for length detection.

Create conditional logic that’s easier to read: =IF(LEN(A2)=10,CONCATENATE(“(“,LEFT(A2,3),”) “,MID(A2,4,3),”-“,RIGHT(A2,4)),IF(LEN(A2)=11,CONCATENATE(LEFT(A2,1),”-“,MID(A2,2,3),”-“,MID(A2,5,3),”-“,RIGHT(A2,4)),”Invalid Length”)). This handles 10-digit and 11-digit numbers with clear logic flow.

Step 3. Handle unlimited format variations without limits.

Add additional IF statements for different phone number formats. You can handle as many variations as needed without hitting workflow complexity thresholds.

Step 4. Add validation and export to HubSpot.

Include error checking for malformed numbers and edge cases. Export standardized phone numbers back to HubSpot with bulk processing that handles thousands of contacts simultaneously.

Skip workflow complexity limits entirely

Start standardizingThis approach provides clearer logic flow for troubleshooting and handles edge cases more gracefully than HubSpot’s if/then branches. You get bulk phone number standardization across your entire contact database.phone numbers without limits today.

How to filter Salesforce dashboard components from multiple objects using single business line field

Salesforce’s native dashboard filtering can’t apply a single filter across components built from unrelated objects, even when they share a common “Business Line” field. This forces you to maintain separate dashboards for each business line value.

Here’s how to create unified cross-object filtering that eliminates dashboard duplication and gives you the dynamic filtering control Salesforce can’t provide natively.

Create unified cross-object filtering using Coefficient

CoefficientHubSpotHubSpotsolves this cross-object filtering challenge by importing data from multiple Salesforce objects into a single spreadsheet environment. You can then apply dynamic filtering across all objects simultaneously, regardless of their relationships inor.

How to make it work

Step 1. Import your Opportunities data with Business Line field.

Use Coefficient’s Salesforce connector to pull your Opportunities data, making sure to include the Business Line field and any other relevant fields like close date, amount, and stage. This becomes your primary dataset for pipeline analysis.

Step 2. Import Leads data in a separate section.

Pull your Leads data into the same spreadsheet, including the Business Line field and key metrics like lead source, status, and created date. Keep this data in adjacent columns or a separate tab for organization.

Step 3. Import custom objects with Business Line fields.

Add your custom Quota and Forecast objects to the same workbook, ensuring each import includes the Business Line field. This creates a comprehensive dataset spanning all your business line reporting needs.

Step 4. Create a dynamic filter cell.

Set up a dropdown cell where users can select the desired business line. Include options for individual business lines plus an “All Business Lines” selection for comprehensive views.

Step 5. Configure dynamic filtering across all imports.

Use Coefficient’s dynamic filtering capability to point all your imports to the same filter cell. Set up AND/OR logic to handle complex filtering scenarios and ensure all datasets respond to the same business line selection.

Step 6. Set up automated refresh scheduling.

Configure hourly, daily, or weekly refresh schedules to keep your unified dashboard current with Salesforce data. This maintains data integrity while providing the consolidated view Salesforce dashboards cannot achieve.

Transform fragmented reporting into unified analysis

Get startedThis approach eliminates the need for multiple identical dashboards while enabling real-time filtering across all objects simultaneously. Users can switch between business lines instantly without navigating between different dashboards.with Coefficient to build your unified cross-object filtering solution today.

How to export HubSpot pipeline stages with deal values to Excel without losing custom properties

HubSpot’s native export strips custom properties or forces you to manually select fields every time you export pipeline data. This creates inconsistent reports and wastes time on repetitive tasks.

Here’s how to export your pipeline stages with deal values while keeping all custom properties intact, plus automate the whole process.

Export pipeline data with custom properties preserved using Coefficient

CoefficientHubSpotcreates a live connection betweenand Excel that preserves custom properties during every data refresh. Unlike HubSpot’s export function, you configure your custom fields once and they stay included automatically.

The key advantage: your custom deal properties maintain proper data types and field mapping consistency across all refreshes. No more lost data or manual field selection.

How to make it work

Step 1. Connect HubSpot to Excel through Coefficient’s sidebar.

Install Coefficient and open the sidebar in Excel. Select “Import from” and choose HubSpot from your connected sources. If it’s your first time, you’ll authenticate your HubSpot account.

Step 2. Select deals object and filter by pipeline stages.

Choose “Deals” as your object type. Use filters to select specific pipeline stages you want to analyze. You can filter by deal stage, close date, or any other criteria relevant to your reporting needs.

Step 3. Include all required custom properties in field selection.

In the field selection screen, check all custom deal properties you need for analysis. These might include custom scoring fields, territory assignments, or deal source tracking. Coefficient will remember these selections for future refreshes.

Step 4. Set up scheduled refreshes to keep data current.

Configure daily or weekly automatic refreshes so your Excel sheet updates with current pipeline data. This eliminates the need to manually re-export from HubSpot every time you need updated information.

Step 5. Use Formula Auto Fill Down for automatic calculations.

Add Excel formulas in columns next to your imported data. When new deals are added during refreshes, Coefficient automatically applies your formulas to the new rows, maintaining consistent calculations across your dataset.

Stop losing custom properties in your pipeline exports

Try CoefficientThis approach eliminates repetitive manual exports while ensuring your custom HubSpot properties are always available for Excel analysis.to maintain consistent pipeline reporting with all your custom fields intact.

How to export multi-currency pipeline data from HubSpot to Excel with accurate conversions

HubSpot’s multi-currency exports lack proper conversion tracking and historical exchange rate handling. You can’t track deals using exchange rates from original deal dates or handle complex multi-currency calculations effectively.

Here’s how to export multi-currency pipeline data with all currency-related fields and enable sophisticated Excel-based currency conversion analysis that HubSpot cannot provide.

Handle complex multi-currency analysis using Coefficient

CoefficientHubSpothandles multi-currencypipeline data by importing all currency-related fields and enabling sophisticated Excel-based currency conversion analysis. You get both original currency amounts and converted values with conversion rate information preserved.

This enables historical exchange rate accuracy and regional performance analysis that HubSpot’s native multi-currency exports cannot deliver.

How to make it work

Step 1. Import deal data including currency amounts and conversion rates.

Pull deal data with both original currency amounts and converted values. Include currency type fields, conversion rate information, and deal close dates to maintain historical accuracy for currency analysis.

Step 2. Create Excel lookup tables for historical exchange rates.

Build reference tables with historical exchange rates by date to ensure accurate conversions. Use VLOOKUP or INDEX/MATCH formulas to apply period-appropriate exchange rates to historical deals based on their close dates.

Step 3. Build formulas for currency normalization.

Create Excel formulas to convert all pipeline values to a single reporting currency. Use formulas like =Original_Amount*VLOOKUP(Close_Date,Exchange_Rate_Table,Currency_Column,TRUE) to apply accurate historical conversion rates.

Step 4. Set up regional performance analysis.

Use conditional formatting and pivot tables to analyze pipeline performance by currency and region. Calculate regional quota attainment and conversion rates while maintaining currency context for accurate performance measurement.

Step 5. Calculate exchange rate impact on pipeline values.

Build formulas to show how currency fluctuations affect pipeline values over time. Create variance calculations between original currency amounts and current conversion rates to understand exchange rate impact on revenue.

Master multi-currency pipeline analysis

Handle complex currenciesThis approach provides comprehensive multi-currency pipeline analysis with accurate historical conversions, capabilities that HubSpot’s standard reporting cannot effectively deliver.with the precision your global sales team needs.

How to export historical pipeline snapshots from HubSpot to Excel for trend analysis

HubSpot lacks native functionality to export pipeline data as it existed at specific past dates. You can’t easily track how your pipeline looked last month or compare pipeline states over time for trend analysis.

Here’s how to automatically capture historical pipeline snapshots and export them to Excel for comprehensive trend analysis that HubSpot’s standard reporting cannot provide.

Capture automated historical pipeline data using Coefficient

Coefficient’sHubSpot’sSnapshots feature specifically addresses this challenge by automatically capturing historical pipeline data copies for Excel trend analysis. Unlikelimited historical reporting, you get complete pipeline state preservation at any frequency you need.

Each snapshot maintains complete deal data with all custom properties as they existed at capture time, creating a comprehensive historical dataset impossible to build with HubSpot’s native tools.

How to make it work

Step 1. Set up live pipeline data import with required properties.

Create a live import of your pipeline deals including all relevant properties like deal amount, stage, probability, close date, and custom fields. This becomes your current pipeline view that updates automatically with fresh data.

Step 2. Configure monthly snapshots for historical capture.

Enable scheduled snapshots to automatically preserve pipeline state data on specific dates like month-end. Choose monthly frequency for quarterly trend analysis, or weekly snapshots if you need more granular historical tracking.

Step 3. Create Excel analysis comparing pipeline periods.

Build formulas to compare pipeline values, stage distribution, and deal velocity across different snapshot periods. Use SUMIFS to calculate pipeline totals by month and create percentage change calculations between periods.

Step 4. Build trend charts for pipeline growth visualization.

Create Excel charts showing pipeline growth, conversion rates, and forecasting accuracy over time using your historical snapshot data. Include trend lines to identify seasonal patterns and performance trajectories.

Step 5. Use Excel’s data analysis tools for pattern identification.

Apply Excel’s statistical functions to identify seasonal patterns, calculate moving averages, and spot performance trends that would be impossible to detect without historical pipeline data preservation.

Finally track how your pipeline actually changes over time

Start capturingThis automated approach creates a comprehensive historical pipeline dataset in Excel that enables sophisticated trend analysis impossible with HubSpot’s standard reporting capabilities.your pipeline history automatically today.

How to automatically export HubSpot contact records to Excel when deal stage changes

HubSpot workflows can’t create Excel files when deal stages change, but there’s a better approach that gives you live, automatically updating spreadsheets with your contact data.

Instead of trying to trigger one-time exports, you can set up a system that maintains real-time contact records and updates automatically in Excel whenever deal stages change.

Get live contact data that updates with deal stage changes using Coefficient

Rather than wrestling with workflow limitations, Coefficient’s 2-way sync between HubSpot and Excel connects your data directly to Excel with live sync capabilities. This means your contact records update automatically when deal stages change, without needing complex workflow triggers.

The key advantage is that you get a continuously updated spreadsheet instead of static exports. Your data stays current, and you can apply Excel’s full analytical power to your contact records and deal associations.

How to make it work

Feel free to read through the steps below or watch this quick tutorial on how to pull and sync HubSpot contact data to Excel. The video shows a walkthrough in Google Sheets, but you’ll experience the same setup process in Excel.

Now for our readers.

Step 1. Connect HubSpot to Excel and import contact records with deal associations.

Open Excel and install Coefficient from the add-ins menu. Connect to HubSpot and create an import for contacts. Select “Row Expanded” display to show multiple deals per contact, giving you complete visibility into deal stage relationships.

automatically export hubspot contacts excel deal stage

Step 2. Apply dynamic filters for specific deal stages.

Use Coefficient’s filtering system to focus on contacts associated with deals in specific stages. You can set up to 25 filters with AND/OR logic, and even reference spreadsheet cells for flexible criteria that you can change without rebuilding the import.

apply dynamic filters to hubspot deal stages

Step 3. Schedule automatic refreshes to capture deal stage changes.

Set up hourly, daily, or weekly refreshes so your spreadsheet updates automatically when deal stages change in HubSpot. This eliminates the need for workflow triggers while ensuring your data stays current.

Schedule automatic excel refreshes to capture hubspot deal stage changes

Step 4. Set up alerts for stakeholders when new records appear.

Configure Slack or email notifications to alert your team when new contact records meet your deal stage criteria. This gives you the notification benefits of workflows without the complexity.

trigger alerts on mysql data to slack or email

Start syncing your contact data automatically

This approach gives you more reliable contact data exports than workflow-based solutions, with the added benefit of live updates and Excel’s analytical capabilities.to set up your automated contact exports today. Try Coefficient’s HubSpot connector for Excel today.

How to automatically export deals to multiple Excel files by team or territory

You can automatically export deals to multiple Excel files by team or territory using dynamic filtering that references team lookup tables, eliminating the need to manually create separate reports for each group.

This approach lets you manage multiple filtered exports from a single interface while automatically creating new team datasets when you add new territories or sales reps.

Create team-specific automated exports using Coefficient

CoefficientHubSpot’senables multi-file automation that addresseslimitation of single-output scheduled reports, which cannot automatically generate separate files for different teams or territories.

Unlike HubSpot’s native reporting that requires manual creation of separate reports for each team, Coefficient allows you to manage multiple filtered imports from a single interface. The dynamic filtering capability means adding new teams only requires updating your reference table, automatically creating new filtered datasets without rebuilding import configurations.

How to make it work

Step 1. Set up multiple deal imports filtered by team owner or territory.

Create separate deal imports in Coefficient, each filtered by team owner or territory custom properties. You can set up one import per team or use dynamic filtering to reference a master team list that automatically creates the right filters.

Step 2. Use dynamic filtering with team/territory lookup tables.

Create a reference table in your spreadsheet that lists all teams and territories. Point your import filters to reference this table, so adding new teams automatically creates new filtered datasets without reconfiguring each import manually.

Step 3. Create separate sheets or workbooks for each team.

Organize your team exports into separate sheets within the same workbook or create entirely separate workbooks for each team. This gives each team access to their specific data while maintaining centralized management of all imports.

Step 4. Schedule synchronized weekly refreshes across all team imports.

Set up coordinated refresh schedules so all team imports update at the same time. This ensures consistency across team reports and prevents confusion about data timing differences between territories.

Step 5. Set up team-specific email alerts for each import completion.

Configure separate email alerts for each team import, so team leaders get notified when their specific data refreshes. You can customize alert recipients and messaging for each territory or sales group.

Streamline your team reporting process

Start automatingAutomated multi-team deal exports eliminate the administrative overhead of maintaining dozens of individual team reports while ensuring each group gets their relevant data on schedule.your team-specific deal exports with dynamic filtering that scales as your organization grows.

Filtering dashboard by common field across Opportunities, Leads, and custom objects simultaneously

Salesforce’s architecture prevents native dashboard filtering across Opportunities, Leads, and custom objects simultaneously because these objects lack direct relational connections. Even when they share a common “Business Line” field, dashboard filters cannot span across unrelated objects in a single view.

Here’s how to create global dashboard filters that work across all object types, giving you the unified reporting view that Salesforce cannot provide natively.

Enable simultaneous filtering across all objects using Coefficient

CoefficientHubSpotHubSpoteliminates this multiple object reports filtering limitation through its comprehensive Salesforce integration. You can import data from Opportunities, Leads, and custom objects into a unified filtering interface that operates above Salesforce’s relational constraints inor.

How to make it work

Step 1. Import Opportunities data with all relevant fields.

Use Coefficient’s “From Objects & Fields” import method to pull specific fields from your Opportunities, including Business Line, close date, amount, and stage. This gives you complete control over which data points to include.

Step 2. Import Leads data with parallel field structure.

Pull your Leads data with consistent field naming, including Business Line, lead source, status, and created date. Structure this import in adjacent columns or tabs to maintain organization while enabling unified filtering.

Step 3. Import custom objects maintaining consistent Business Line field.

Add your custom Quota, Forecast, and other objects to the same workbook, ensuring the Business Line field is consistently named and formatted across all imports for seamless filtering.

Step 4. Create a unified filtering interface.

Set up a master filter cell that controls all datasets simultaneously. Use spreadsheet functionality to create dropdown menus or input fields that drive filtering across all object types.

Step 5. Implement dynamic filtering with cell references.

Configure each import to reference the same filter cell using Coefficient’s dynamic filtering capability. This ensures that changing your filter selection updates all datasets instantly, regardless of their Salesforce object origin.

Step 6. Apply advanced filtering logic.

Set up AND/OR logic combinations for complex business line filtering scenarios. Add date range filtering across objects with different date fields, numeric filtering for quota and forecast thresholds, and text-based filtering for specific business line subcategories.

Step 7. Configure conditional formatting for visual feedback.

Apply conditional formatting to highlight filtered results across all object types. This creates immediate visual confirmation of your filter selections and makes it easy to spot trends across different data sources.

Create the global filtering Salesforce cannot provide

Build your solutionThis approach creates global dashboard filters functionality that maintains data accuracy through automated refresh cycles while enabling cross-object analysis impossible in native Salesforce dashboards. You get complete control over your multi-object reporting needs in a single, dynamically filtered view.and start filtering across all your Salesforce objects today.

Fix HubSpot contact import frozen at column mapping screen

A frozen column mapping screen in HubSpot typically indicates browser resource issues, session timeouts, or data validation conflicts that cause the interface to become unresponsive and prevent your contact import from completing.

Here’s how to get around these browser-dependent limitations and import your contacts through a more stable process.

Use a stable import environment with Coefficient

CoefficientHubSpotoperates through secure API connections rather than browser-dependent interfaces, eliminating the freezing issues common with’s native import wizard. The import process runs in the background and doesn’t depend on maintaining an active browser session.

HubSpotYou get superior field mapping options that prevent the conflicts causing frozen screens, including automatic property detection, custom field support, and data type validation that ensures compatibility before attempting the import to.

How to make it work

Step 1. Set up Coefficient with your contact data.

Install Coefficient and connect to your Excel or Google Sheets file containing the contact information. The system efficiently processes large contact datasets without the memory limitations that cause browser freezing.

Step 2. Configure contact property mappings.

Use Coefficient’s automatic property detection to recognize HubSpot contact properties and get mapping suggestions. The system handles custom contact properties and validates data types to match HubSpot requirements before import.

Step 3. Validate your data before import.

Run validation checks to ensure data types match HubSpot property requirements and identify any potential issues with contact associations that could cause problems during import.

Step 4. Schedule automated imports.

Set up the import to run automatically without user intervention. The process includes automatic retry logic for failed imports and detailed error reporting, so you don’t need to monitor the browser or worry about session timeouts.

Import contacts without frozen mapping screens

Set upStop losing import progress to browser freezes and session timeouts. Coefficient’s server-side processing ensures your contact imports complete reliably without depending on browser performance or active sessions.your stable import process today.

Export HubSpot pipeline velocity metrics and conversion rates to Excel

HubSpot lacks sophisticated velocity metrics and can’t calculate conversion rates across custom time periods or deal segments. You can’t track velocity changes over time or analyze conversion by specific pipeline stages effectively.

Here’s how to export the underlying deal data needed for advanced pipeline velocity and conversion rate analysis that HubSpot’s native reporting simply cannot provide.

Calculate advanced velocity metrics and conversion rates using Coefficient

CoefficientHubSpotenables advanced pipeline velocity and conversion rate analysis by importing the underlyingdeal data needed for these calculations. You get stage change timestamps, progression history, and all deal properties required for sophisticated Excel-based velocity analysis.

This approach provides custom velocity calculations and historical conversion tracking that HubSpot’s basic reports cannot match.

How to make it work

Step 1. Import deal data with stage progression timestamps.

Pull deal data including create date, stage progression dates, close date, and deal value. Include custom properties that affect velocity like deal source, sales rep, and company size for segmented analysis.

Step 2. Import historical data using Snapshots for trend analysis.

Set up monthly snapshots to capture deal progression over time. This historical data enables velocity trending analysis and conversion rate tracking across different time periods that HubSpot cannot provide natively.

Step 3. Create Excel formulas for velocity calculations.

Build formulas to calculate days in each pipeline stage using date differences. Create average time calculations from lead to close and stage-to-stage progression times. Use formulas like =AVERAGE(Close_Date-Create_Date) for overall sales cycle length.

Step 4. Calculate stage-to-stage conversion rates.

Use COUNTIFS formulas to calculate conversion percentages between each pipeline stage. Create formulas like =COUNTIFS(Stage,”Qualified”)/COUNTIFS(Stage,”Lead”) to track conversion rates across your sales funnel stages.

Step 5. Build advanced pipeline velocity metrics.

Calculate comprehensive pipeline velocity using the formula: (Number of qualified leads × Average deal size × Win rate) ÷ Sales cycle length. Segment this calculation by deal source, rep performance, or company characteristics for detailed insights.

Get the velocity insights HubSpot can’t calculate

Start calculatingThis approach provides comprehensive pipeline velocity metrics and conversion rate analysis capabilities that exceed HubSpot’s native reporting limitations through live data access combined with Excel’s analytical power.the velocity metrics that actually drive revenue growth.