

Open source BI is no longer a compromise. 41% of organizations now use at least one open source BI tool in production, up from 28% in 2022, according to a Dresner Advisory Services survey of 4,200 analytics practitioners. Metabase powers dashboards at over 60,000 organizations. Apache Superset handles production workloads at Airbnb, Dropbox and Lyft. Lightdash has become the default BI layer for dbt-native data teams. The open source ecosystem in 2026 is mature, capable and in many cases the right call.
But choosing open source still requires honest accounting. A 2025 CNCF survey found that 63% of organizations running self-hosted analytics tools spend 5 to 15 hours per month on maintenance. Zero licensing cost does not mean zero cost. Someone has to manage the deployment, handle database migrations, apply security patches and troubleshoot when something breaks. That staffing cost is real and it often exceeds the licensing cost of a managed alternative for smaller teams.
This guide covers the open source BI tools worth knowing in 2026, what each is actually built for, where each breaks down, and where a managed data connector layer fits alongside them when the bottleneck is not visualization but live data access from business systems.
What You Give Up Going Open Source
The capabilities are real. So are the trade-offs. Understanding both before choosing saves teams from discovering the constraints six months into a deployment.
Maintenance burden is the most underestimated cost. Every open source deployment requires someone to own it: updates, security patches, connector compatibility, infrastructure scaling. For data teams with DevOps experience, this is manageable. For business teams without a dedicated technical owner, it becomes a liability that grows over time.
Managed connectors to business systems require extra work. Most open source BI tools connect well to databases and warehouses. Connecting to CRMs like Salesforce or HubSpot, ERPs like NetSuite or QuickBooks, or marketing platforms typically requires custom connectors, third-party ETL tools or manual data pipelines. If your data lives in business applications rather than a warehouse, the open source BI layer is only part of the solution.
Enterprise features sit behind paid tiers. Row-level security, SSO, audit logs and advanced permissions are often restricted to paid cloud plans even in tools that advertise themselves as open source. Metabase, in particular, is open core rather than pure open source: the community edition is AGPL-licensed and free, but enterprise features require a paid plan starting at $500 per month.
Metabase
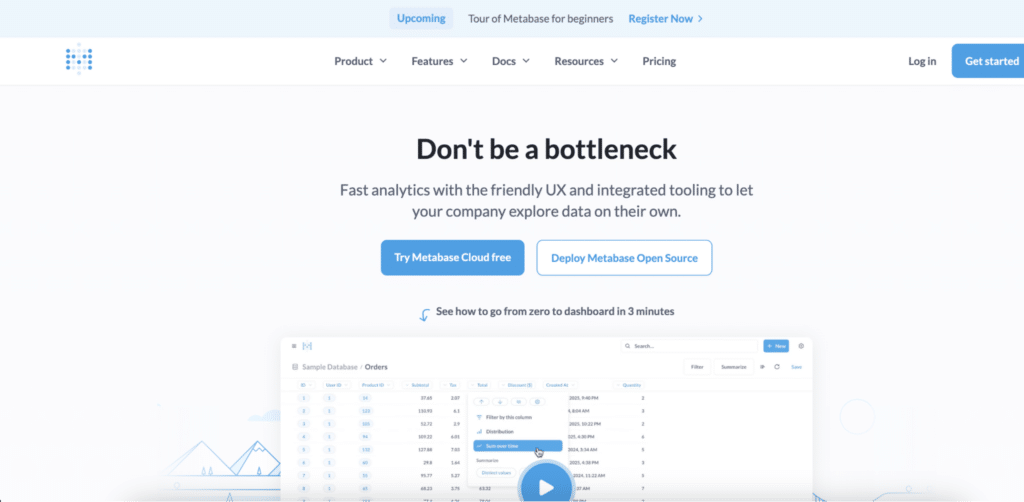
Metabase is the most broadly accessible open source BI tool in 2026. The visual question builder lets non-technical users explore data without writing SQL, which is why it is the most common starting point for teams that need self-serve analytics without requiring business users to learn a new query language. Self-hosted deployment via Docker is free under the AGPL license. The cloud-hosted Starter plan begins at $85 per month. Metabase has a 40,000-star GitHub repository and releases 2 to 3 updates per month, which means the project is actively maintained and the community is large enough to find answers quickly when something breaks.
The open core distinction is worth understanding clearly. The community edition handles dashboards, question builder, basic permissions and scheduled reports. Row-level security, SSO, audit logs and serialization all require the paid Pro or Enterprise plan. For teams that need any of those features, the licensing cost becomes part of the calculation, and at that point the gap between Metabase and commercial alternatives like Zoho Analytics narrows considerably. Best for: non-technical business teams that need self-serve analytics on database or warehouse data, with at least one person available to manage the deployment.
Apache Superset
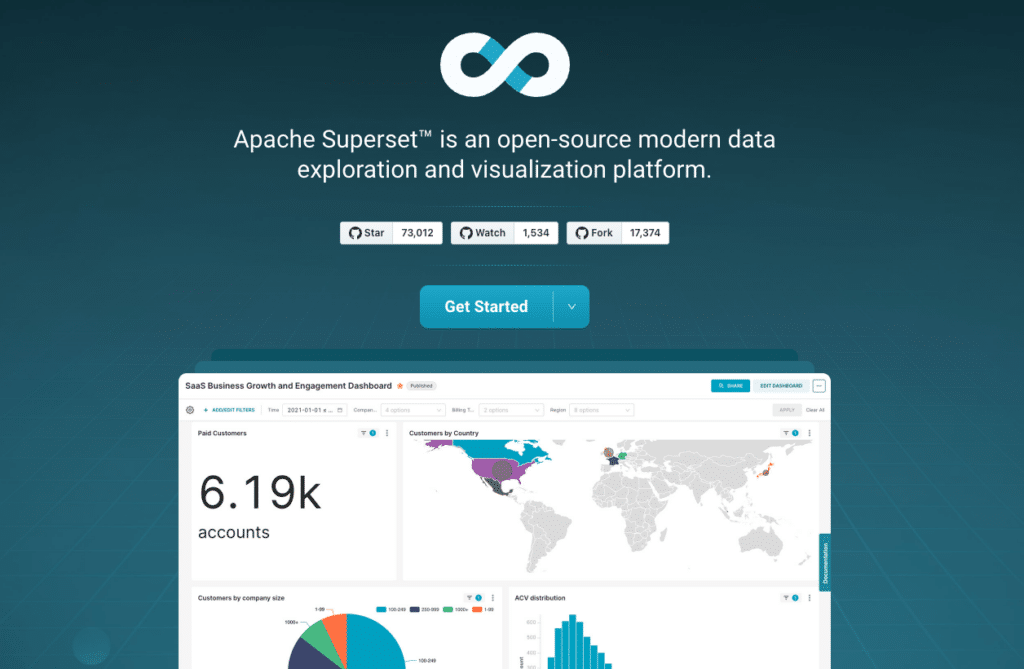
Apache Superset is the most powerful open source BI platform available in 2026. It handles large-scale deployments, offers 40+ chart types, includes a SQL Lab for direct database exploration and is governed by the Apache Software Foundation, which means no open core licensing restrictions: every feature including SAML, LDAP and row-level security is available without a paid tier. Apache Software Foundation governance also provides stronger long-term sustainability guarantees than single-vendor projects. Superset has 63,000+ GitHub stars and powers analytics at Airbnb, Dropbox, Twitter and Lyft.
The trade-off is setup complexity. Superset requires DevOps experience to deploy correctly: Python environment configuration, metadata database management, Celery workers for asynchronous queries and cache layer setup. For teams without someone who is comfortable with Docker and Python, the initial deployment can take days or weeks rather than hours. Preset, the managed Superset offering, removes the infrastructure burden while preserving the underlying product. Preset’s cloud plans start at $20 per user per month for teams that want Superset’s capabilities without the maintenance overhead. Best for: data engineering teams with DevOps experience that need scalable, fully governed BI at zero licensing cost.
Lightdash
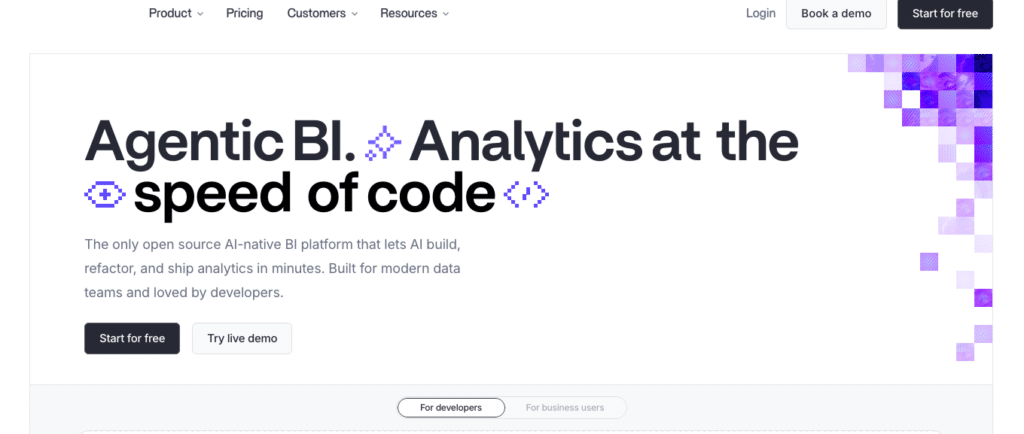
Lightdash takes a fundamentally different approach from Metabase and Superset. Rather than connecting directly to databases and letting users define metrics in the BI layer, Lightdash connects to your dbt project and reads metric definitions from your existing YAML files. Every metric a business user queries in Lightdash traces back to a dbt model, which means the definition is version-controlled, peer-reviewed and consistent across every dashboard and user. This eliminates the “multiple versions of truth” problem that plagues teams where different analysts calculate revenue, churn or conversion differently in their own dashboards.
The tight dbt dependency is also the main limitation. Lightdash is not designed for teams without an existing dbt project and the expertise to maintain it. Visualization options are currently less extensive than Superset’s, and the platform assumes that data transformation is handled upstream in dbt rather than in the BI layer. For dbt-native data teams, Lightdash is the most compelling open source option in 2026. For teams without dbt, it is not the right fit. Cloud hosting starts at $400 per month. Self-hosted deployment is available on the open source tier.
Grafana
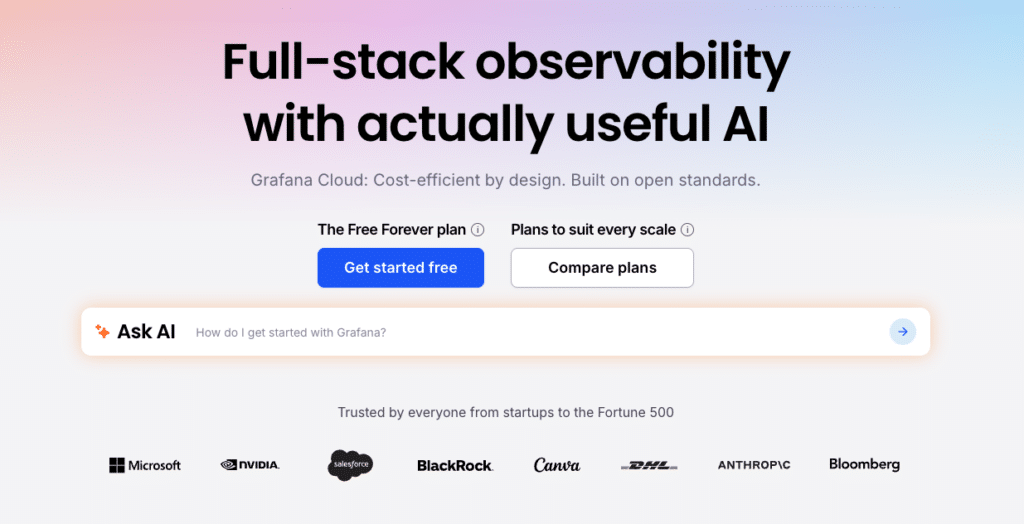
Grafana belongs in this list with a clear scope definition. Grafana is the standard tool for time-series data, infrastructure monitoring and observability dashboards. It connects to Prometheus, InfluxDB, Loki and other time-series sources with deep native support, and it is genuinely the best tool available for its specific use case. It is not a general-purpose BI tool and should not be evaluated as one.
Teams that operate infrastructure or run SaaS products often have Grafana for operational monitoring and a separate BI tool for business reporting. The two are complementary rather than competitive. If your dashboards are built around time-series metrics, infrastructure performance or application observability, Grafana is the right choice. If they are built around revenue, pipeline, headcount or financial data, a general-purpose BI tool is the correct starting point. Grafana OSS is free and self-hosted. Grafana Cloud has a free tier and paid plans from $8 per user per month.
Looker Studio

Looker Studio is not technically open source, but it earns a place in this comparison because it is the most common free alternative teams evaluate alongside open source tools. Fully free with no user limit, 800+ data source connectors and no self-hosting requirement. For teams in the Google ecosystem, Google Analytics, Ads, Sheets and BigQuery, Looker Studio is the obvious starting point. The native connectors are free and a working dashboard can be live within hours.
The limitations that drive teams toward open source alternatives are specific: no row-level security, unreliable data blending across more than three or four sources, no native alerting, and community connectors for non-Google sources like Salesforce or HubSpot typically add $20 to $500 per month. When those limitations become blockers, Metabase is the most common migration target. When they do not, Looker Studio covers around 90% of small business reporting needs at zero cost.
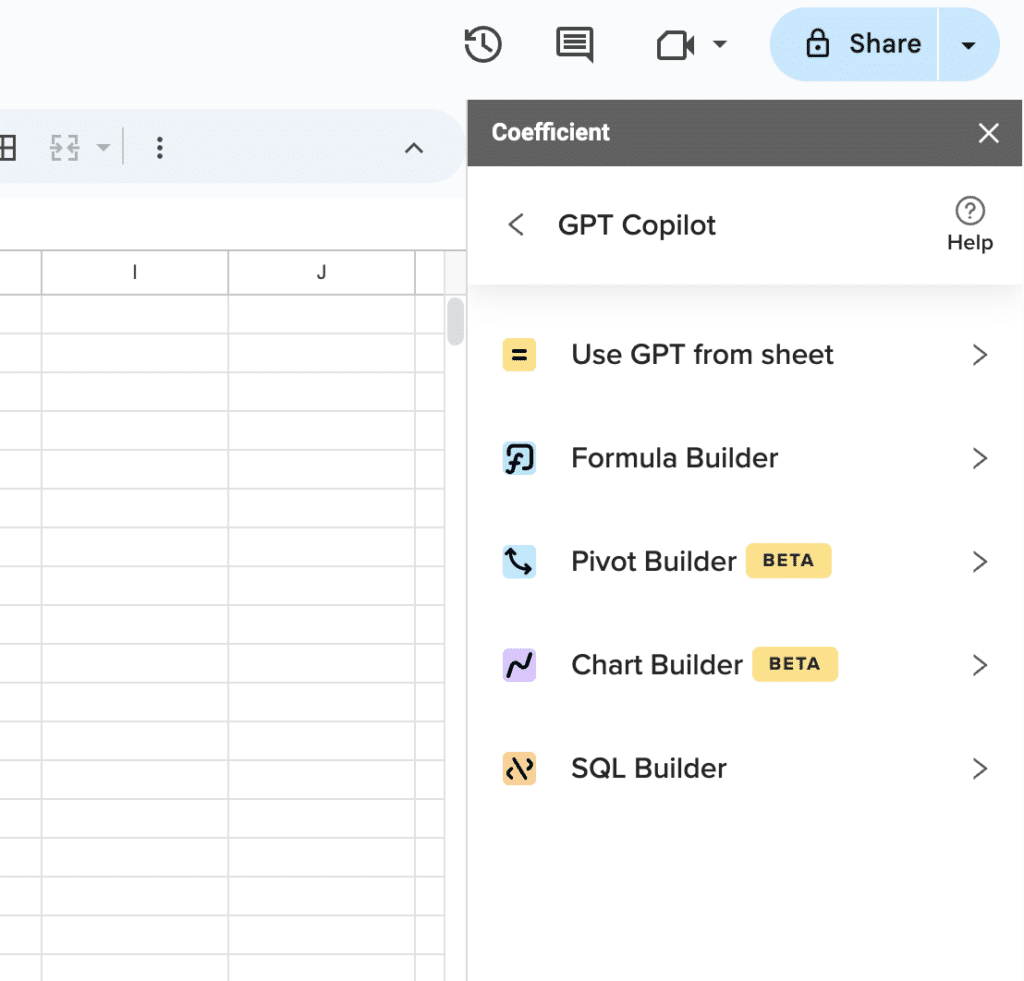
Supercharge your spreadsheets with GPT-powered AI tools for building formulas, charts, pivots, SQL and more. Simple prompts for automatic generation.

When Open Source BI Is Not the Full Answer
Open source BI tools handle the visualization and exploration layer well. The gap they share is the data connectivity layer: most open source tools connect cleanly to databases and warehouses but require custom pipelines, ETL tools or manual exports to pull data from business systems like Salesforce, HubSpot, NetSuite or QuickBooks. For data teams with engineering resources to build and maintain those pipelines, that is a manageable trade-off. For finance, RevOps and operations teams that need live data from those systems without building pipelines, it is where the open source approach breaks down.
This is where Coefficient fits alongside, not instead of, an open source BI stack. Coefficient connects 150+ data sources directly to Google Sheets or Excel, including Salesforce, HubSpot, NetSuite, QuickBooks and Snowflake, with server-side scheduled refresh that keeps data current without manual exports. The AI dashboard builder turns plain-English descriptions into shareable web dashboards with SQL-backed numbers behind every metric. Viewers get a live URL and an Ask-AI sidebar. Every figure traces to source via the Explain button.
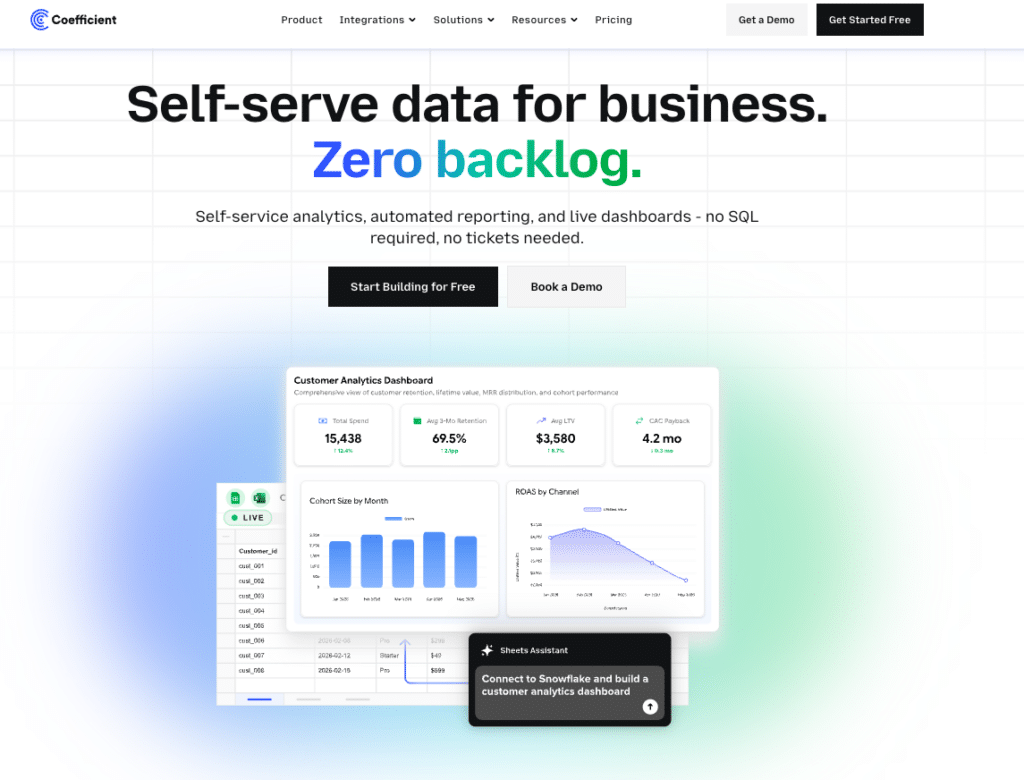
For teams running Superset or Metabase for their data team’s internal analytics, Coefficient serves a parallel use case: giving finance and RevOps teams live, governed access to their CRM and ERP data without routing requests through the data team or waiting for pipeline work to be scheduled. The two layers are not competing. They solve different parts of the same problem.
Limitation: Coefficient requires Google Sheets or Excel as the data layer. Not a standalone BI platform. Free plan available. Paid from $49 per month with no per-user fees.
Comparison Table
| Tool | Best For | License | Hosted Option | Key Limitation | Cost |
|---|---|---|---|---|---|
| Metabase | Non-technical business users needing self-serve analytics | AGPL (open core) | Cloud from $85/month | Enterprise features require paid plan | Free (self-hosted). $85/month (cloud). |
| Apache Superset | Data teams needing scalable, fully governed BI | Apache 2.0 (fully open) | Preset from $20/user/month | Complex setup, requires DevOps experience | Free (self-hosted). Preset from $20/user/month. |
| Lightdash | dbt-native data teams needing metric consistency | MIT | Cloud from $400/month | Requires existing dbt project | Free (self-hosted). Cloud from $400/month. |
| Redash | SQL-first teams already running it in production | BSD-2 | Hosted by third parties | Maintenance mode since 2020, no new deployments recommended | Free (self-hosted). |
| Grafana | Time-series, infrastructure and observability dashboards | AGPL | Cloud from $8/user/month | Not a general-purpose BI tool | Free (OSS). Cloud from $8/user/month. |
| Looker Studio | Google ecosystem teams needing free dashboards | Proprietary (free) | Fully managed by Google | No row-level security, limited non-Google connectors | Free. Pro at $9/user/month. |
| Coefficient | Finance and RevOps teams needing live CRM or ERP data alongside existing BI | Proprietary (SaaS) | Fully managed | Requires Google Sheets or Excel | Free plan. Paid from $49/month. No per-user fees. |
How to Pick the Right Open Source BI Tool
Start with your stack and your team, not the feature list. The open source BI tool that fits is determined more by what your data team can maintain and what your business users can operate than by which platform has the most GitHub stars.
Your business users need self-serve analytics and your team can manage a deployment
Metabase is the lowest-friction starting point. The visual question builder works for non-technical users, the community is large and the self-hosted deployment is well-documented. Move to Superset if you need more chart types, SAML, or scale beyond what Metabase handles.
You have a data engineering team and need scalable, fully governed analytics
Apache Superset is the right choice. Every enterprise feature is available without a paid tier, the Apache governance provides long-term sustainability and the platform scales to hundreds of dashboards and thousands of users. Budget for setup time and ongoing DevOps ownership.
Your data transformation layer is dbt and metric consistency is the primary concern
Lightdash is built for this use case. It reads metric definitions directly from your dbt YAML files, which means every dashboard query is governed by the same logic your data team has already defined and reviewed.
Your dashboards are built around infrastructure, time-series or application performance data
Grafana is the correct tool. It is not the right choice for business reporting, but for operational observability it has no open source peer.
Your finance or RevOps team needs live data from Salesforce, HubSpot or NetSuite alongside your open source BI stack
Open source BI tools do not have managed connectors to these systems. Coefficient fills that gap: live data from 150+ business sources into Google Sheets or Excel, with AI-built dashboards and a live shareable URL. It runs alongside your existing BI stack rather than replacing it. Free to start.
Open source BI in 2026 is a legitimate choice, not a compromise. Metabase wins on time-to-value for non-technical users. Superset wins on scale and governance for data engineering teams. Lightdash wins for dbt-native stacks that prioritize metric consistency. The maintenance cost is real but manageable for teams with the right technical ownership. Where open source BI consistently falls short is live connectivity to the business systems where most operational data actually lives. That gap is worth solving separately rather than assuming the BI layer will cover it.