

Ever felt overwhelmed by the complexity of analyzing disparate customer support channels? You’re not alone.
Many businesses grapple with the daunting task of sifting through vast amounts of data and systems to understand ticket distribution and prioritization.
But what if there was a more efficient way to analyze omnichannel customer support that would simplify the process, save time, and provide valuable insights faster?
In this blog, we’ll demonstrate how to use Coefficient to analyze customer support channels from Zendesk by blending CRM data from HubSpot, amplifying your ability to respond promptly and effectively to customer needs.
You’ll see how you can easily calculate the percentage distribution of ticket volume across different channels, prioritize tickets based on severity and monthly recurring revenue, and more–right within your spreadsheet.
Guide: Analyze Omni Channel Customer Support in Google Sheets
Coefficient is a free Google Sheets add-on that allows you to connect your business systems to Google Sheets and sync real-time data into your spreadsheet.
To install Coefficient, first, open Google Sheets.
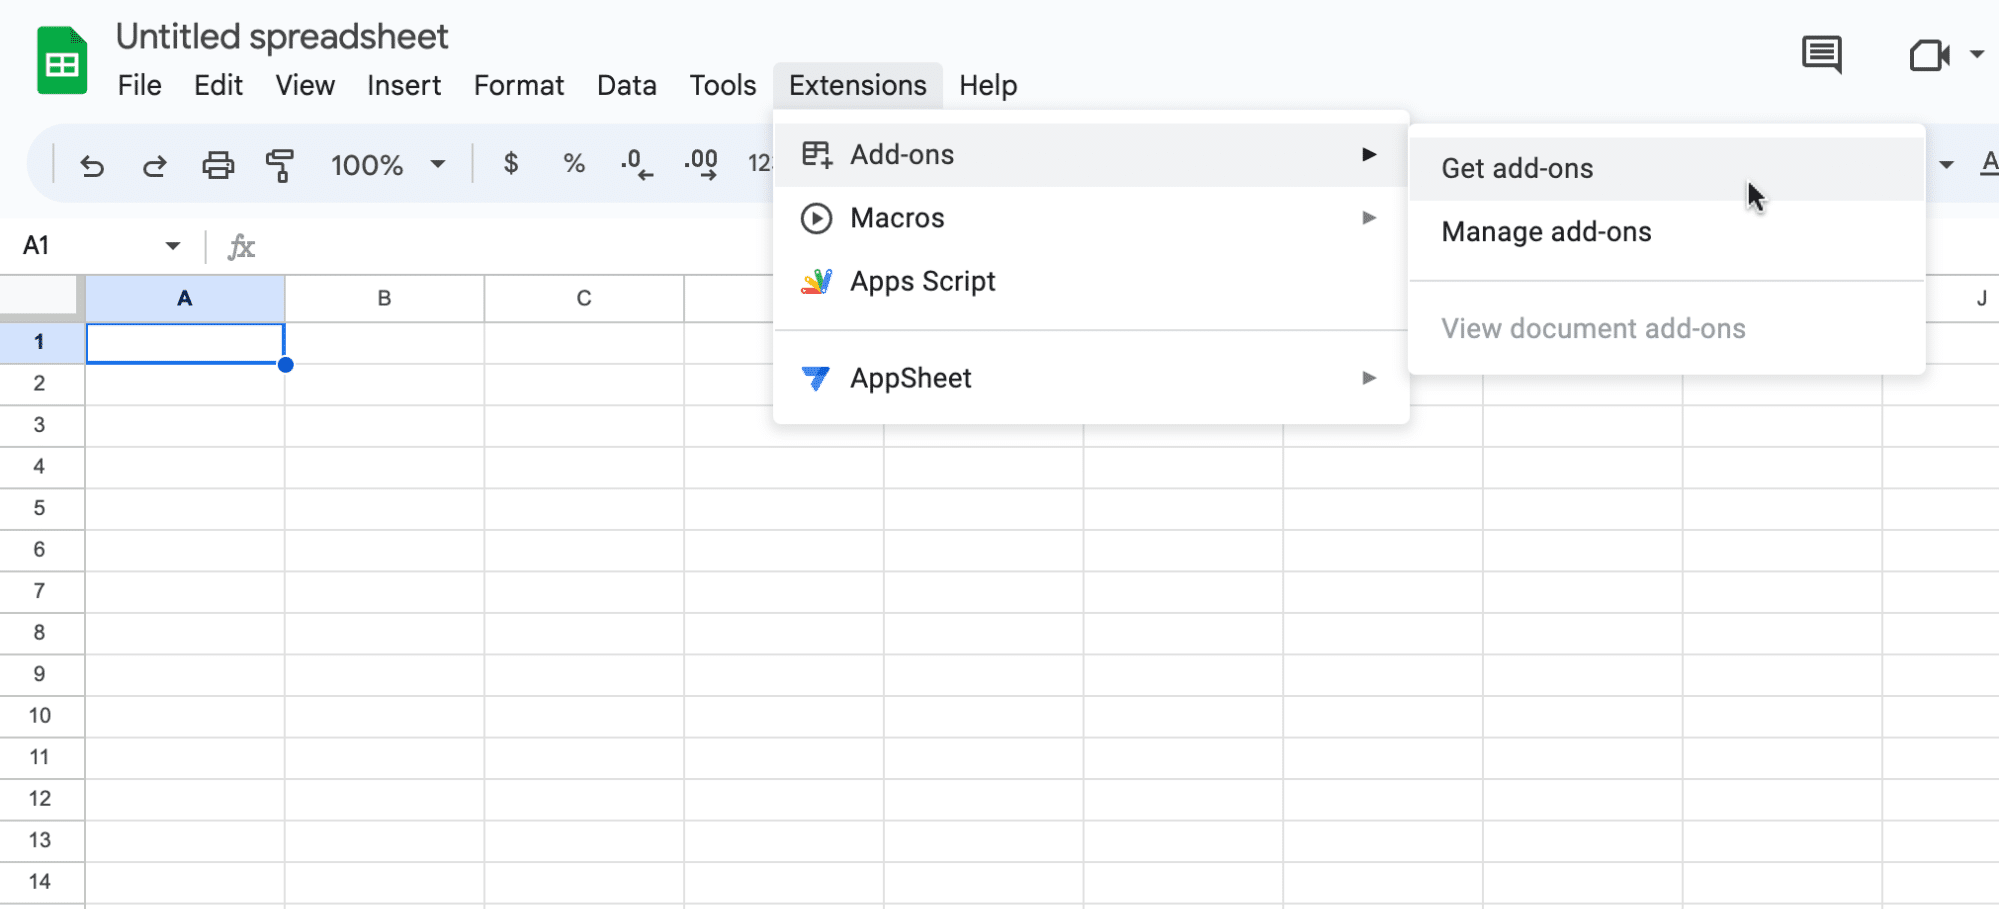
Click Extensions in the top ribbon and select ‘Add-ons’ -> ‘Get add-ons.’
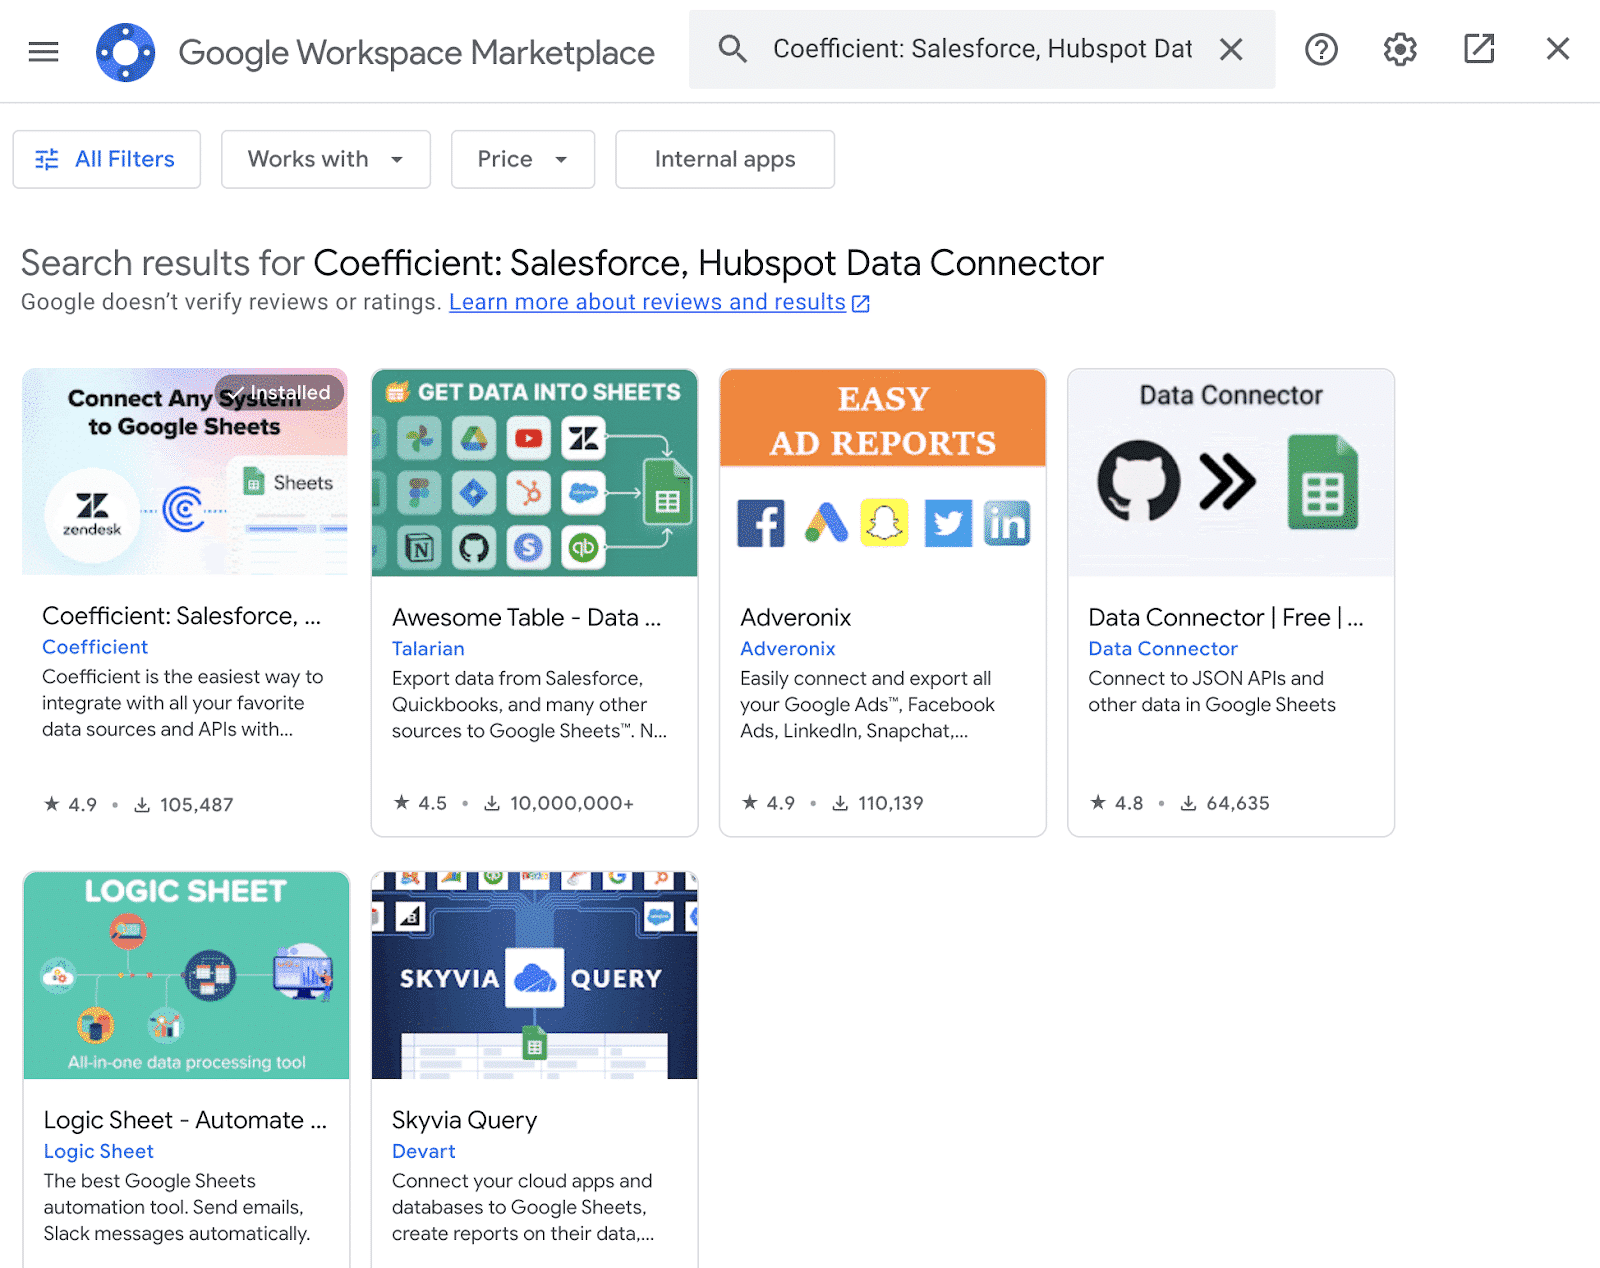
Input “Coefficient” in the Google Workspace Marketplace search menu and select the Coefficient app.
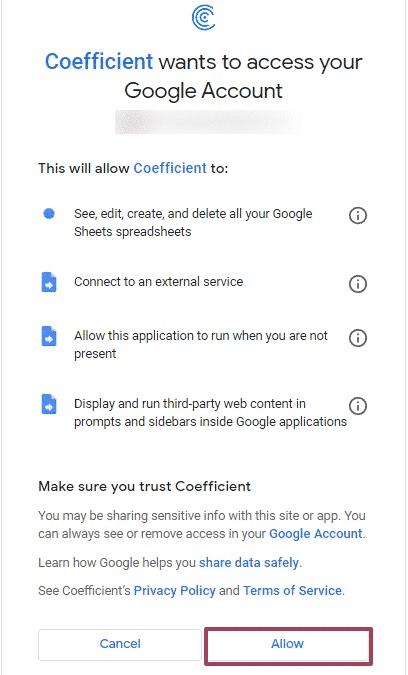
Click ‘Allow’ to grant Coefficient access to your Google account.
Wait a few moments for the install to complete, then return to your spreadsheet menu.
Click on Extensions -> Coefficient -> Launch.

Coefficient will open on the right side of your spreadsheet.
Start by importing your live Zendesk data into Google Sheets.
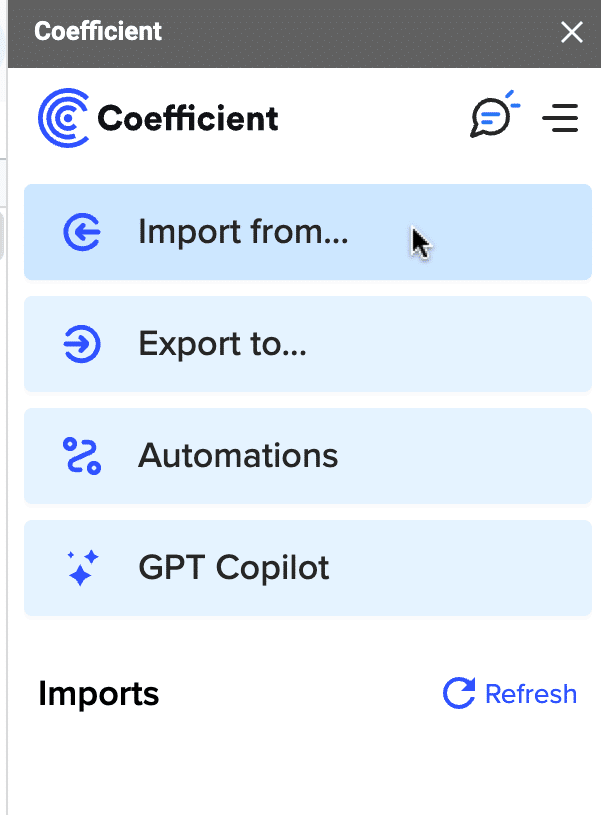
Click ‘Import from…’
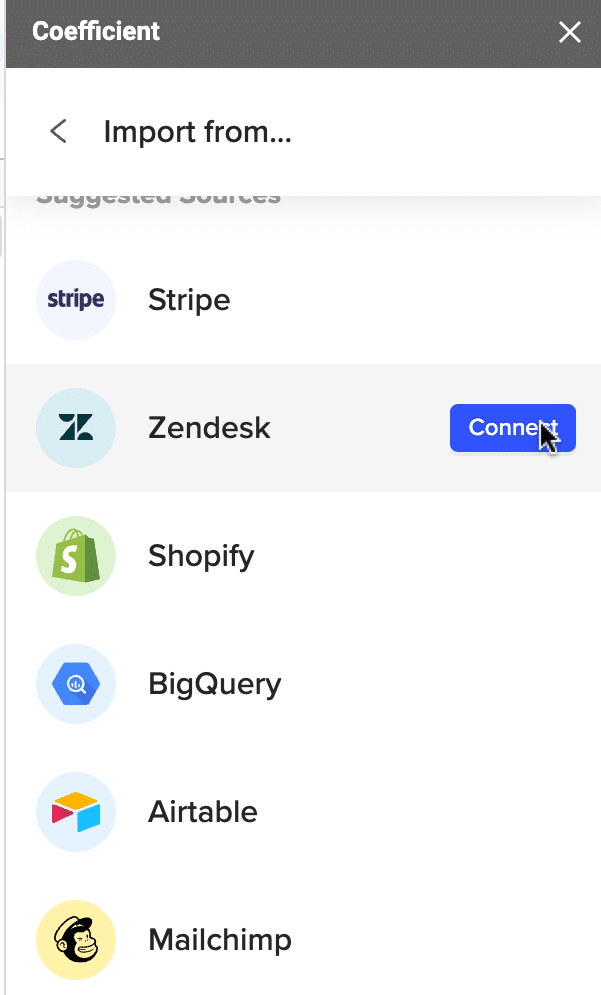
Scroll down and select Zendesk as your data source.
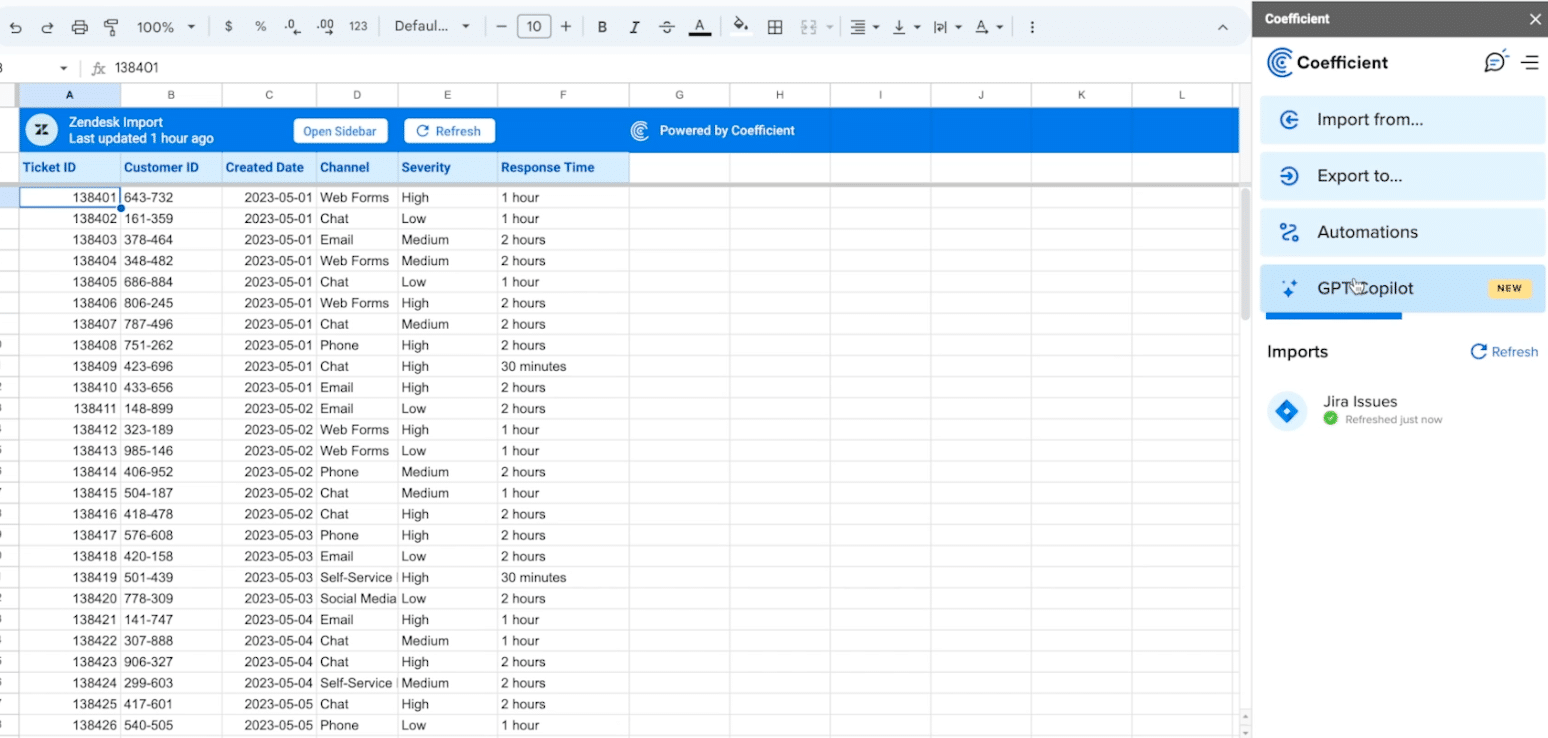
Import your data from Zendesk (click here for a full tutorial).
Now that your data is in your spreadsheet, we’ll build a pivot table to calculate the percentage distribution of ticket volume across different channels using Coefficient’s GPT Copilot.
Return to the Coefficient menu, and select ‘GPT Copilot.’
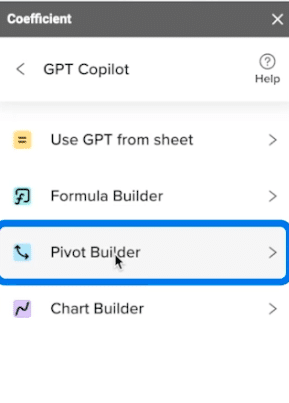
Click ‘Pivot Builder.’
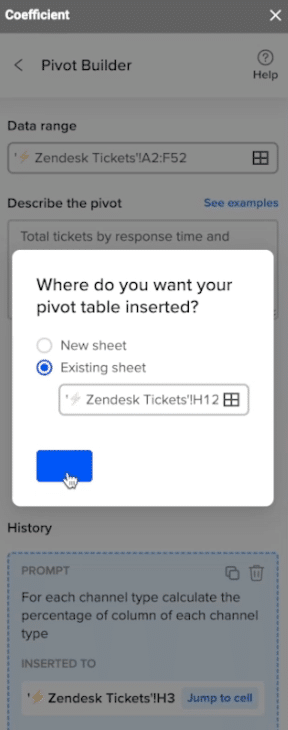
Select the data range for analysis and describe the pivot you want to build: “for each channel type calculate the percentage of column of each channel type.”
Click ‘Build.’
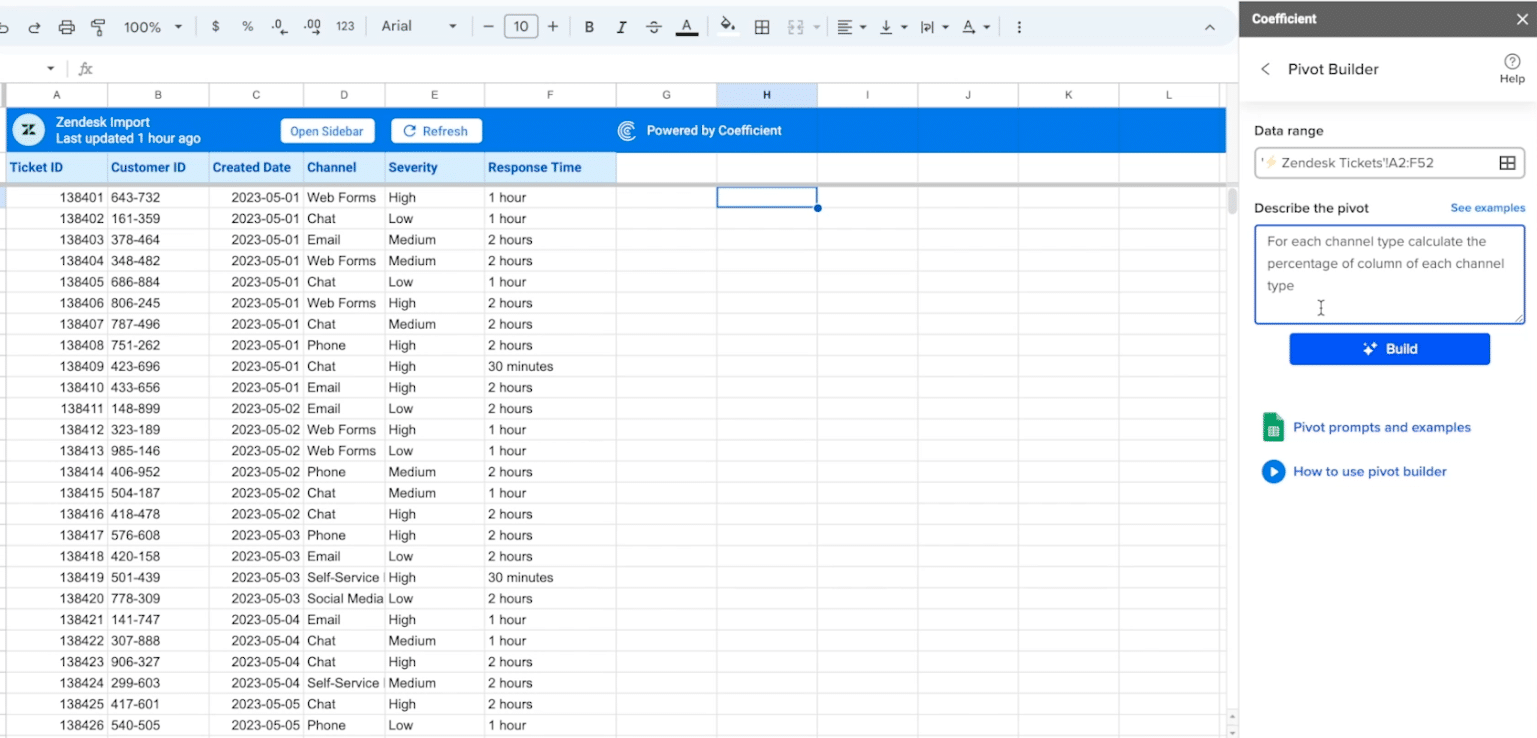
Click ‘Existing sheet’ to insert your pivot table in an empty cell in your current tab.
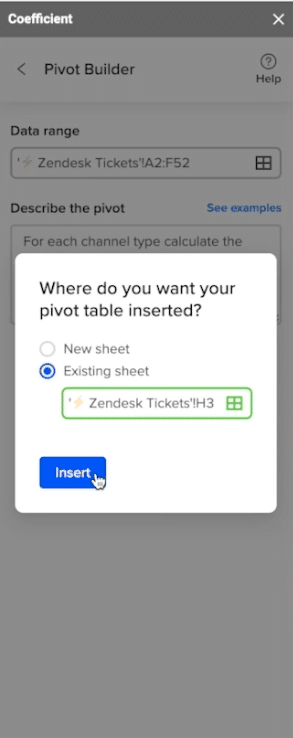
Click ‘Insert’ and your new pivot table will automatically populate your spreadsheet.
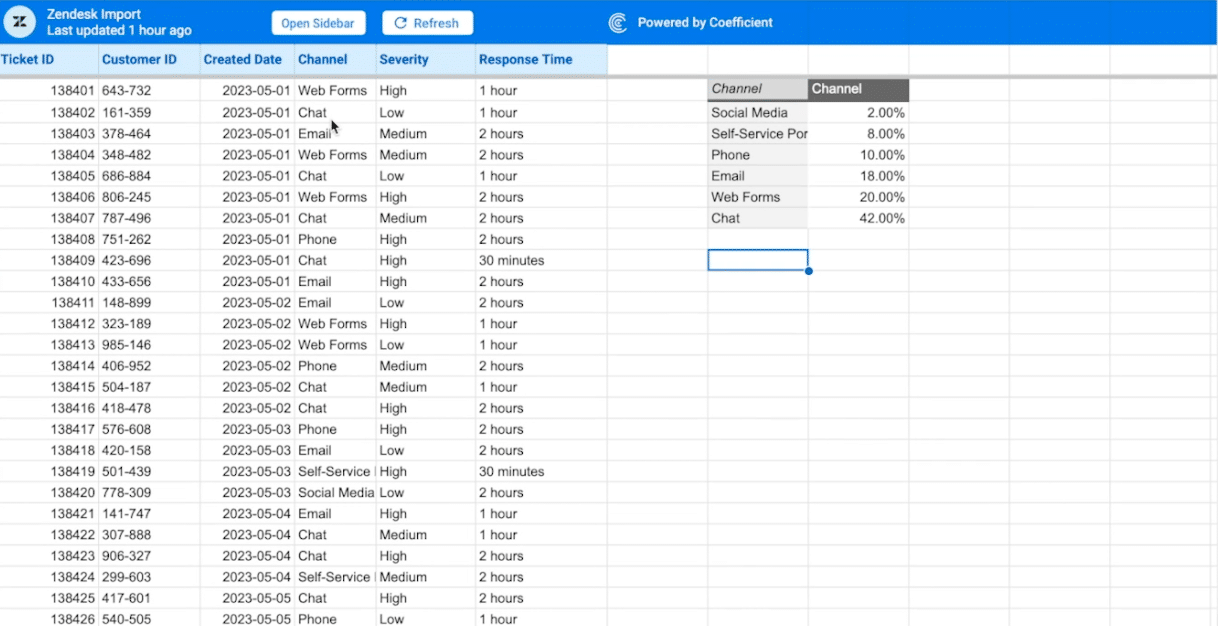
After creating the pivot table, we enhance the data by importing the monthly recurring revenue from HubSpot.
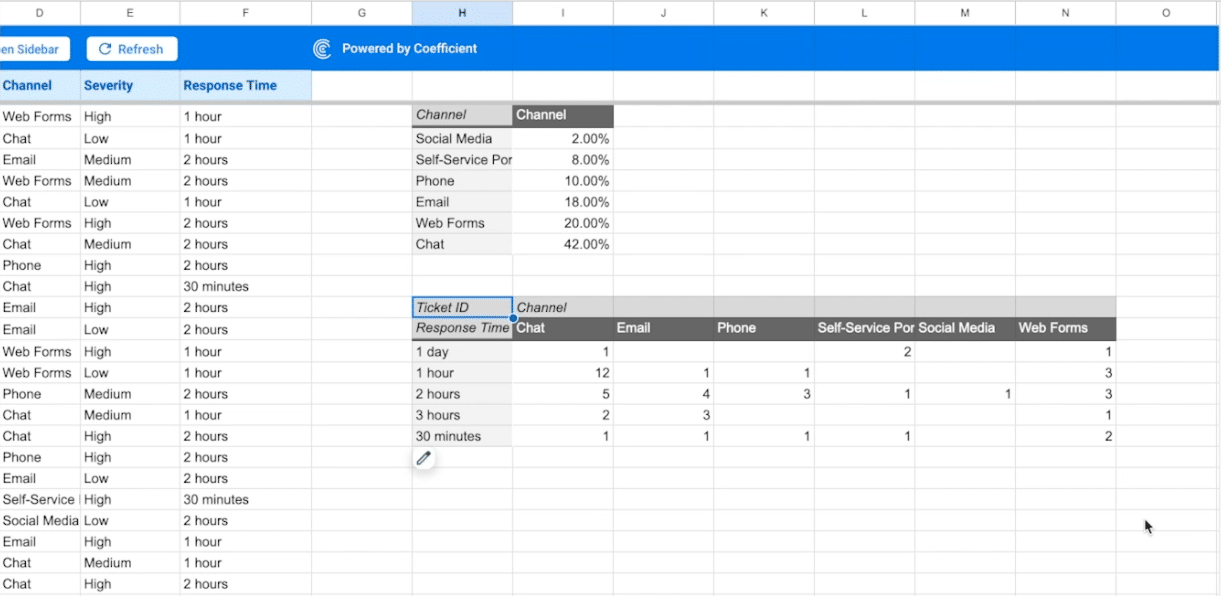
Next, we’ll create another pivot table to calculate ticket volume by response time and channel, repeating the same process above.
Select the entire table as your data range and describe the new pivot table: “Total tickets by response time and channel.”
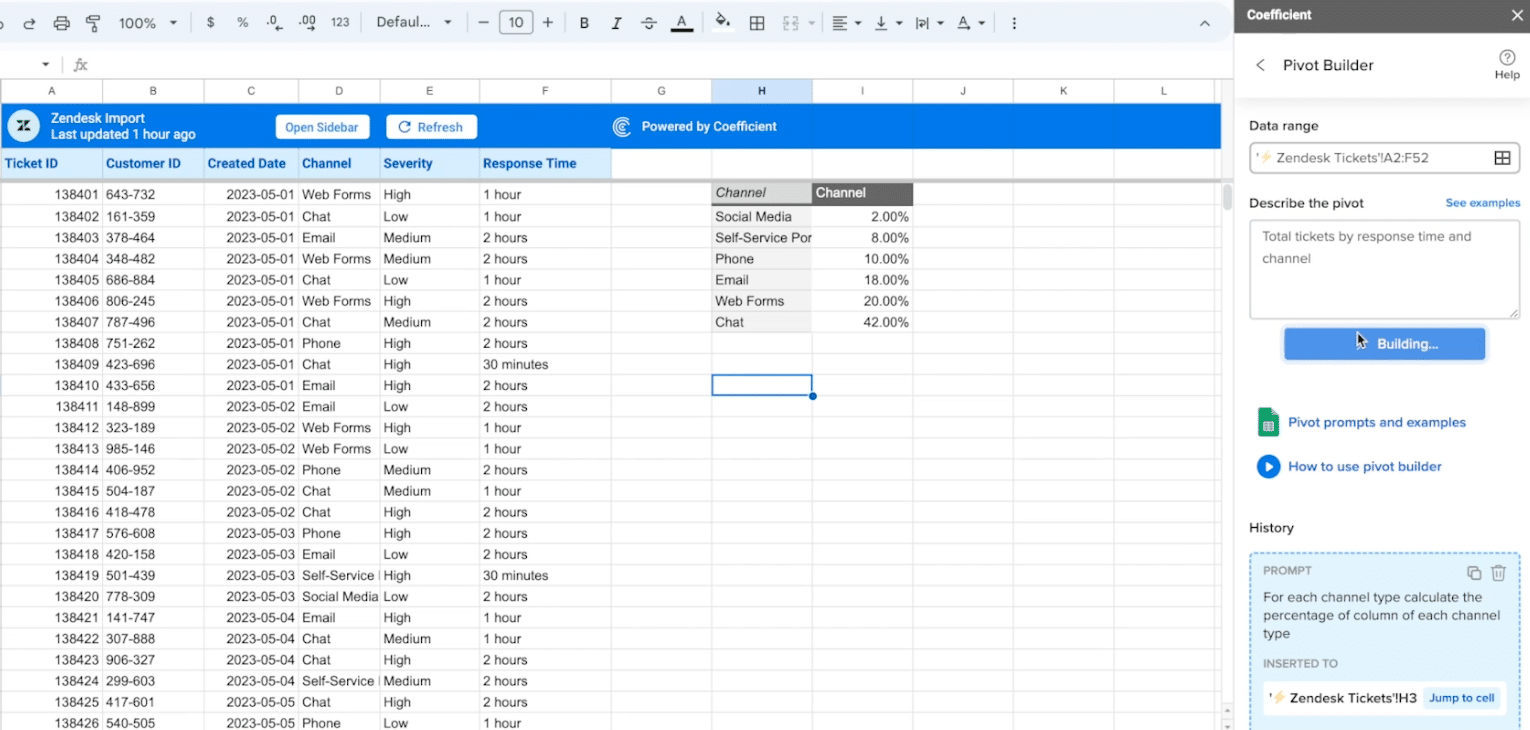
Insert the new pivot table into the existing sheet in a blank cell beneath your first pivot table.
Your new table will populate your tab just like before.
Next, we’ll enrich our analysis by integrating data from HubSpot. This will allow us to understand monthly recurring revenue, which we can then use to prioritize tickets more effectively.
Return to the Coefficient menu -> ‘Import from…’ -> Hubspot.
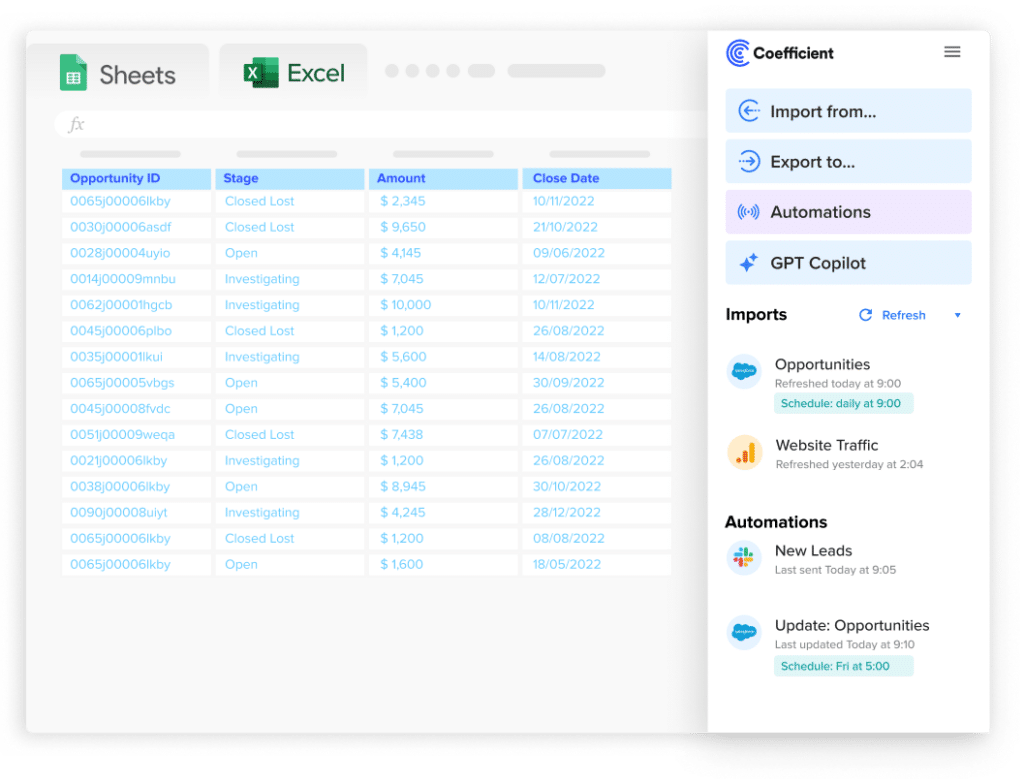
Stop exporting data manually. Sync data from your business systems into Google Sheets or Excel with Coefficient and set it on a refresh schedule.

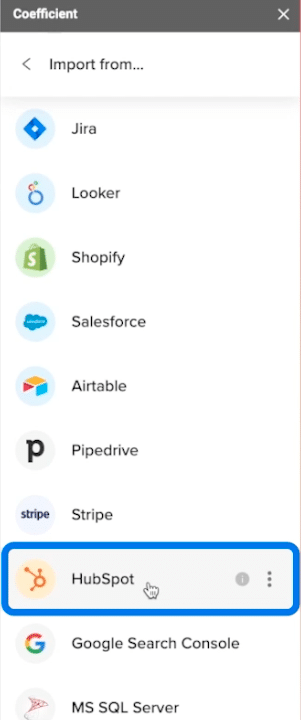
Select ‘From Objects & Fields.’
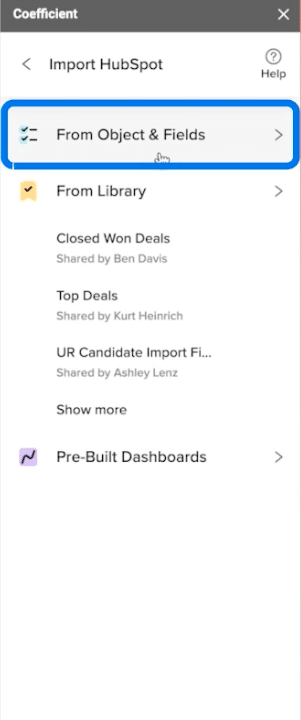
Choose ‘Contact List…’ as your object.
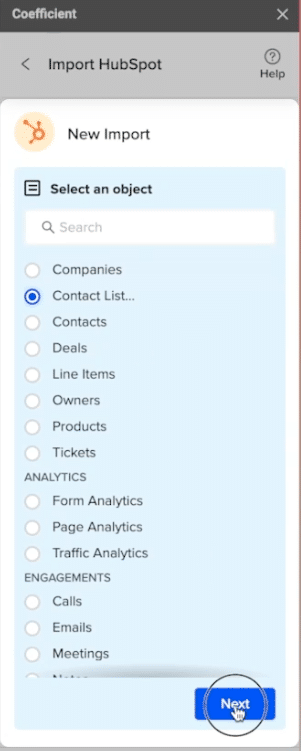
Select ‘Static list’ from the dropdown and click ‘Next.’

Choose ‘Contact ID’ and ‘Event Revenue’ as your fields and name your import.
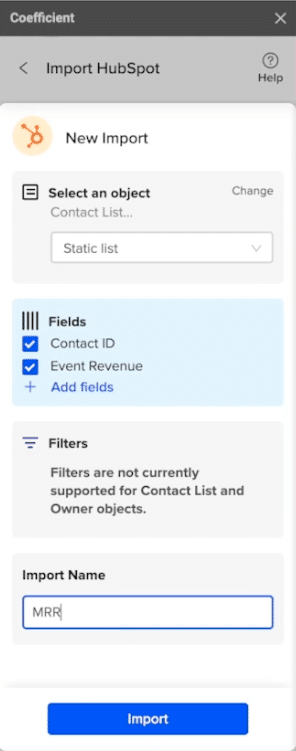
Click ‘Import.’
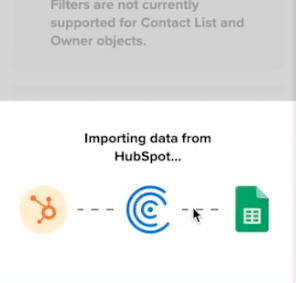
Your data will now appear in a separate tab.
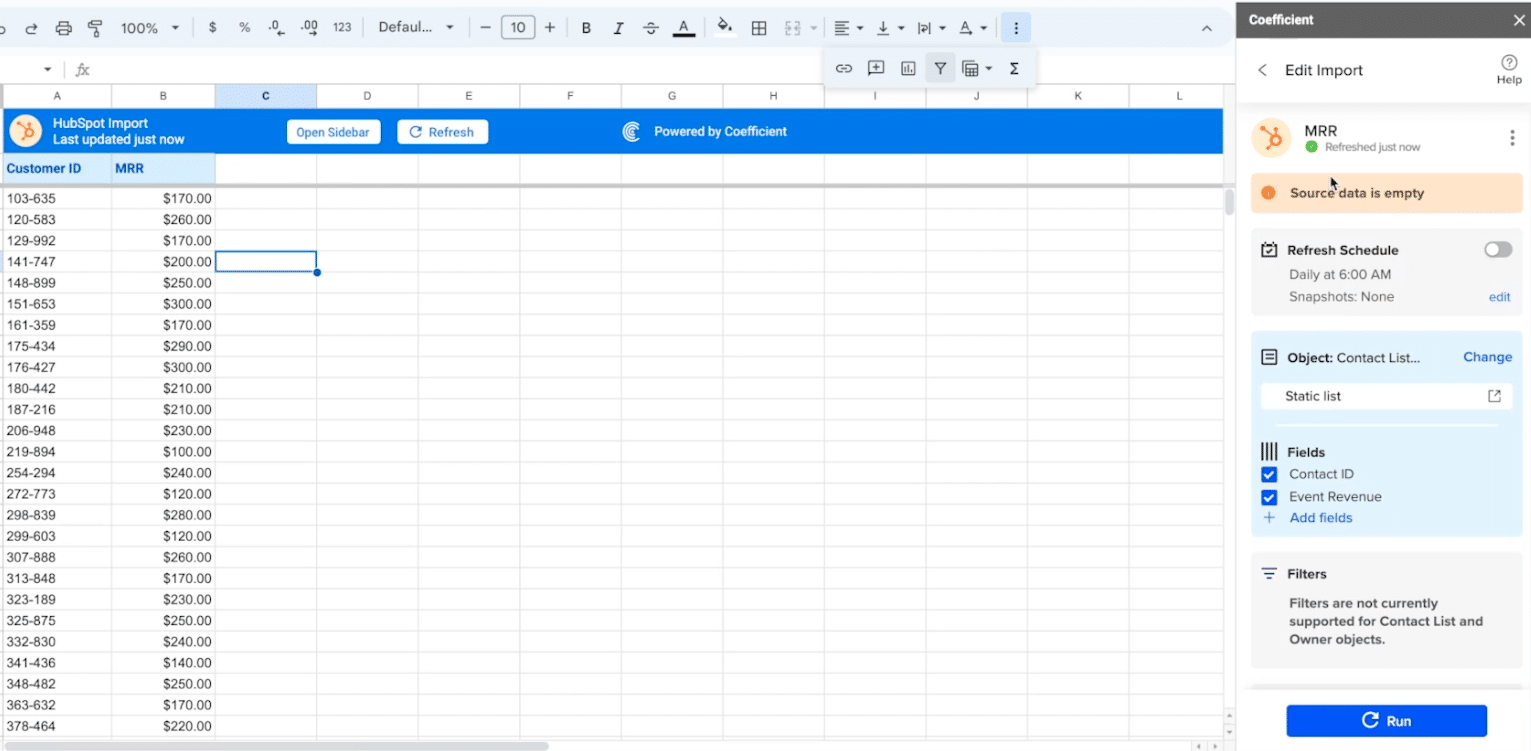
Finally, we’ll use the Coefficient GPT Copilot Formula Builder to add the monthly recurring revenue data inline with our Zendesk data.
Return to the Coefficient menu and select ‘GPT Copilot.’
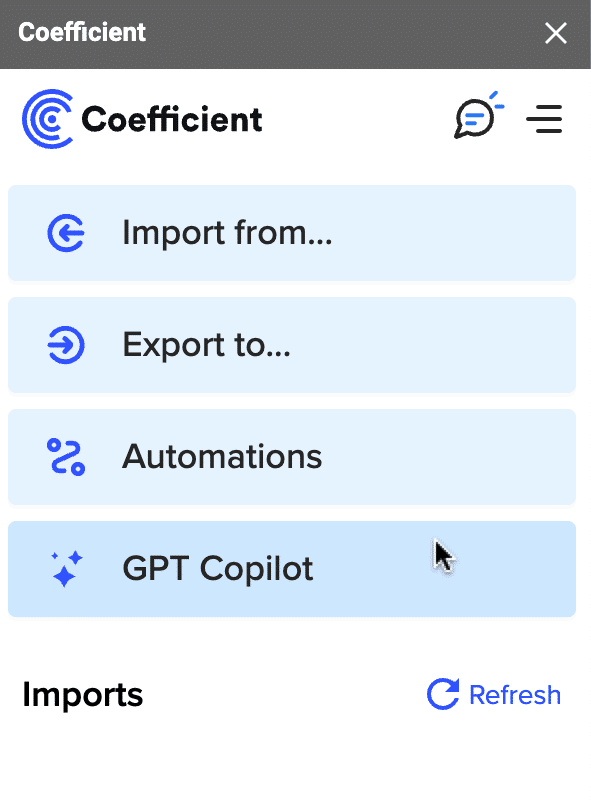
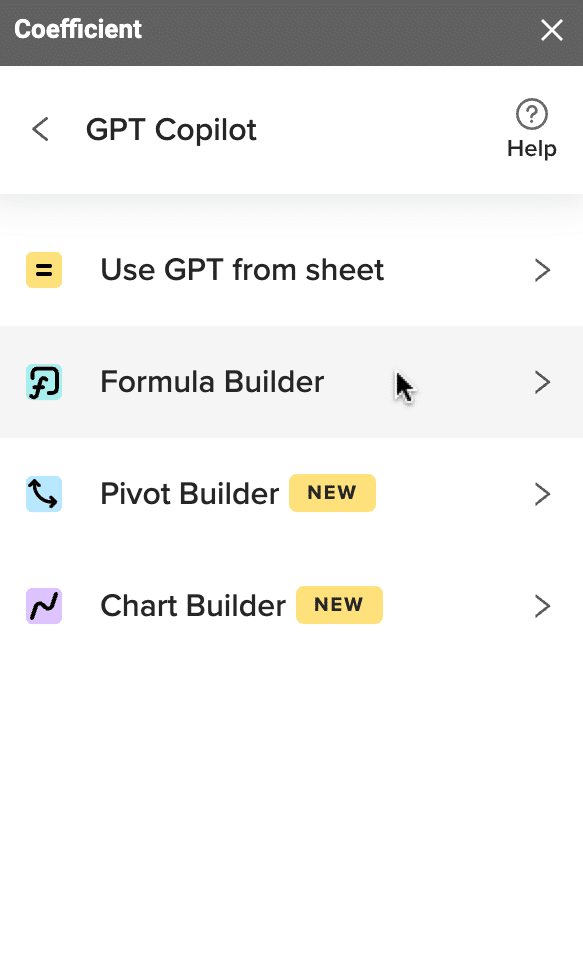
Select ‘Formula Builder.’
Describe the formula you want to build in the text box and click ‘Build.’
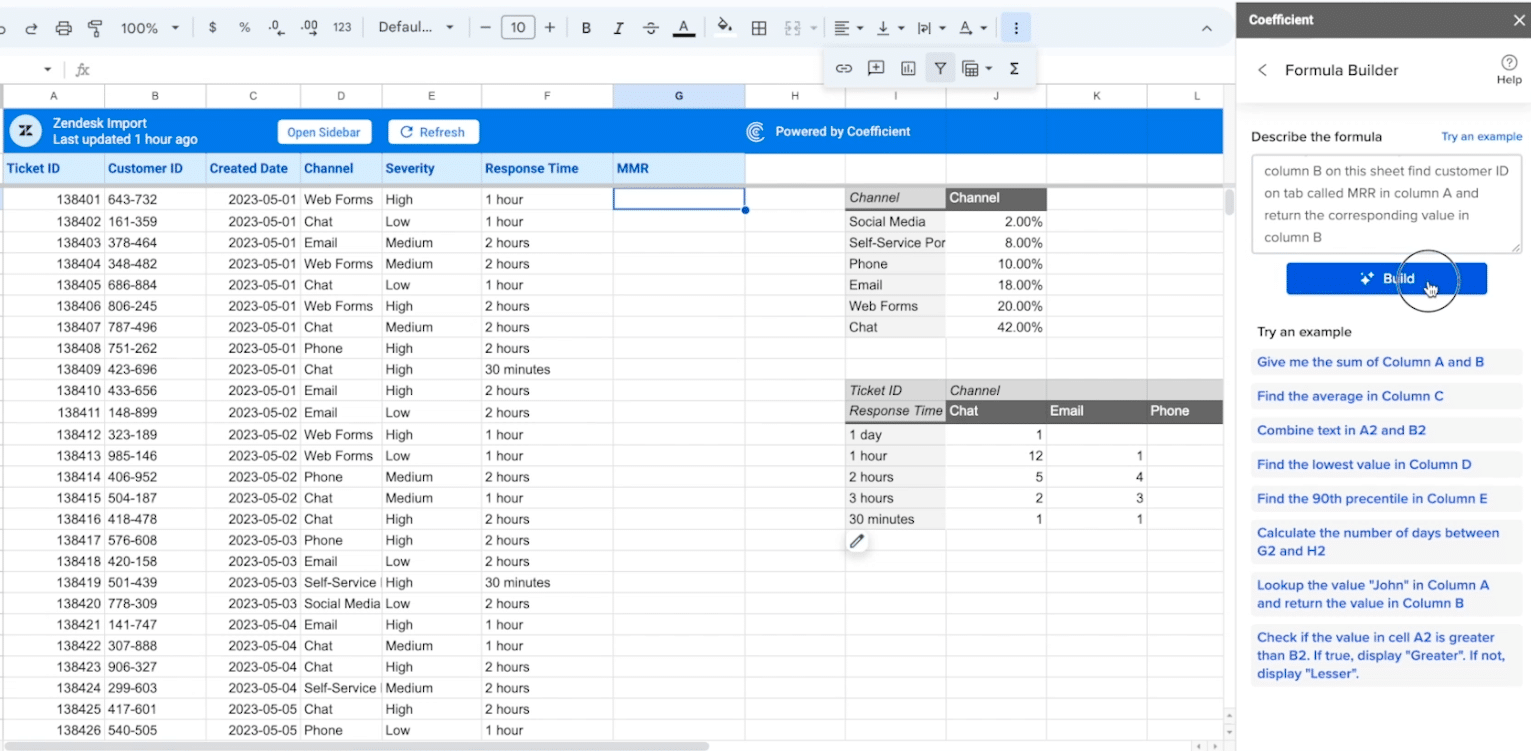
Copy the formula and paste it in the empty cell below MRR.
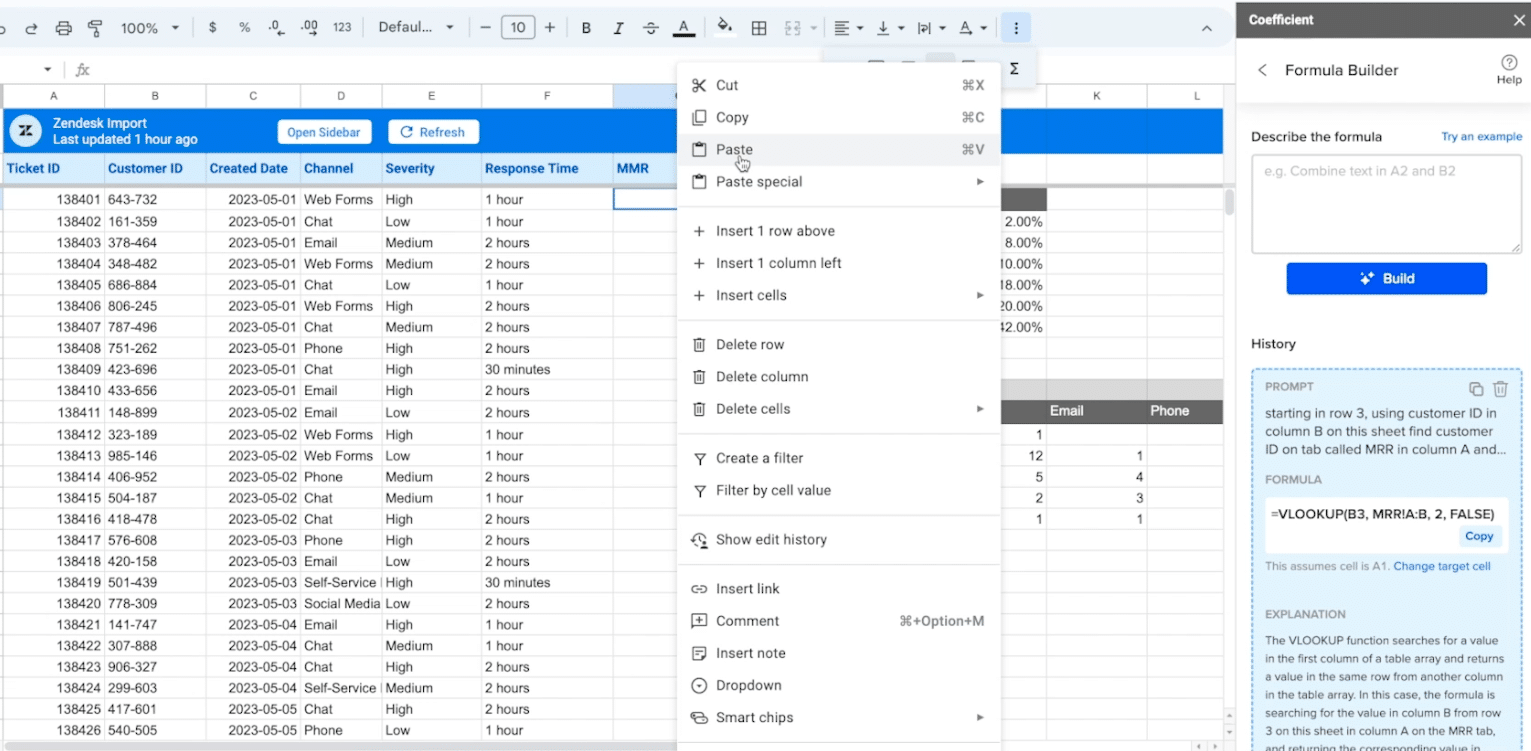
Create a new column titled ‘Priority.’
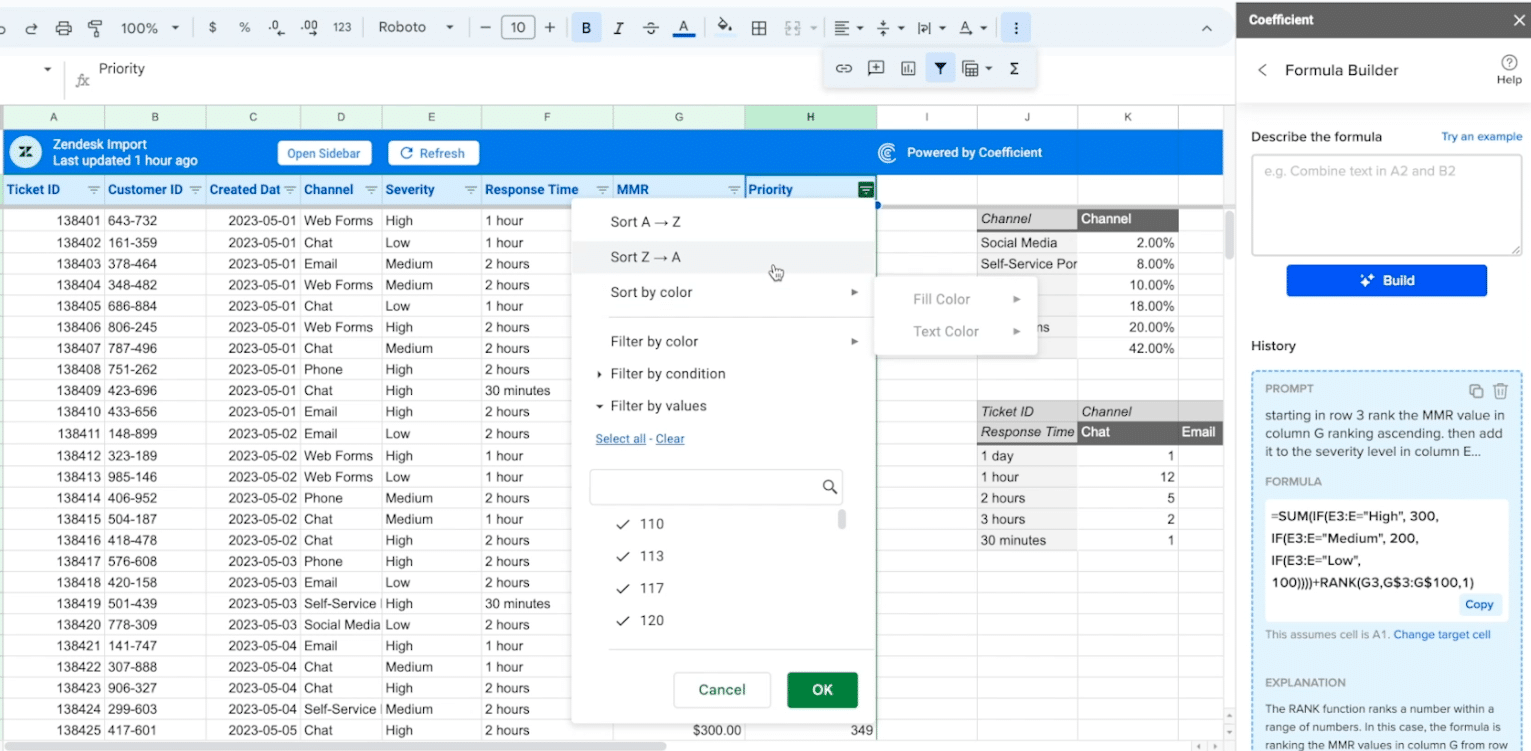
Next, use the formula builder to prioritize tickets based on severity and monthly recurring menu.
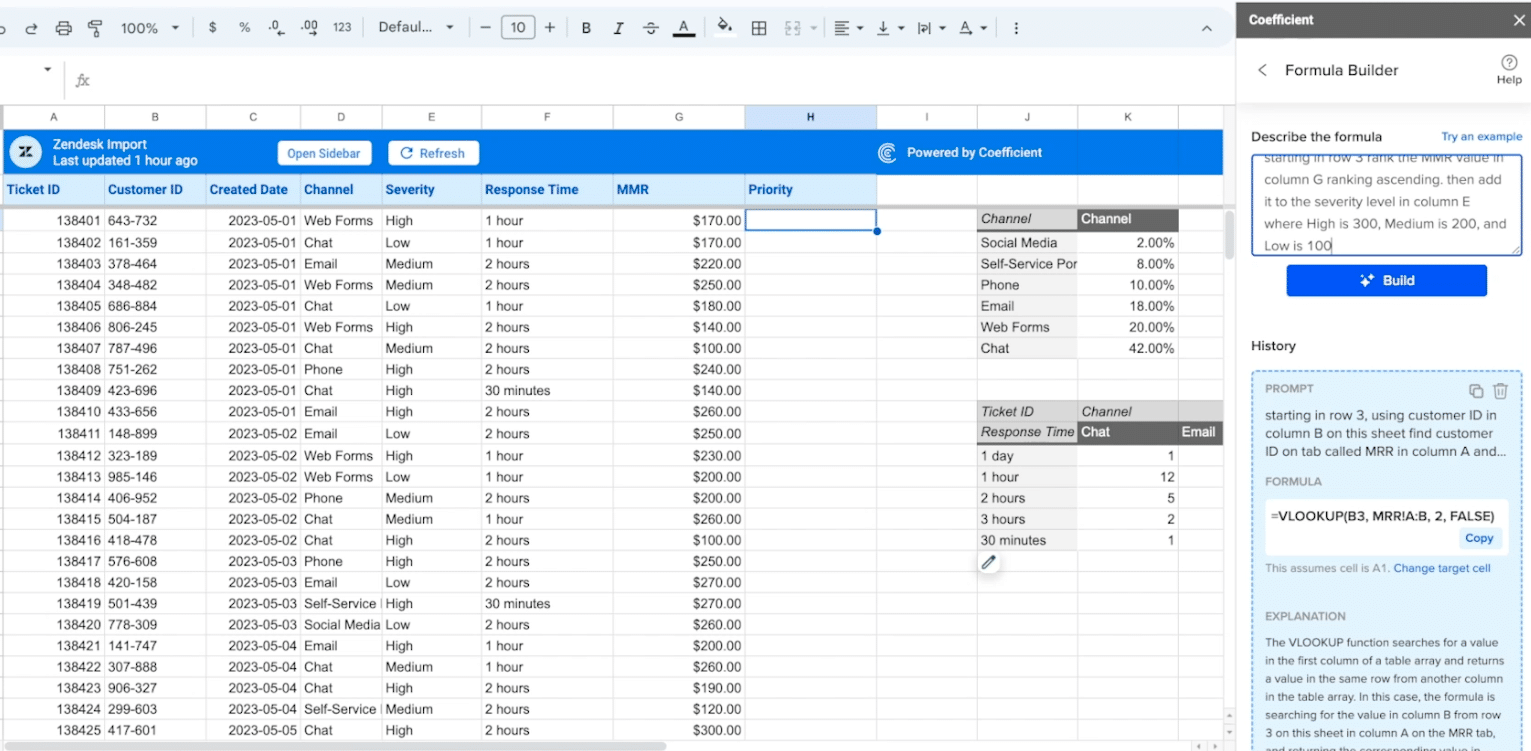
Just as before, copy the output and paste it into the empty cell below ‘Priority.’
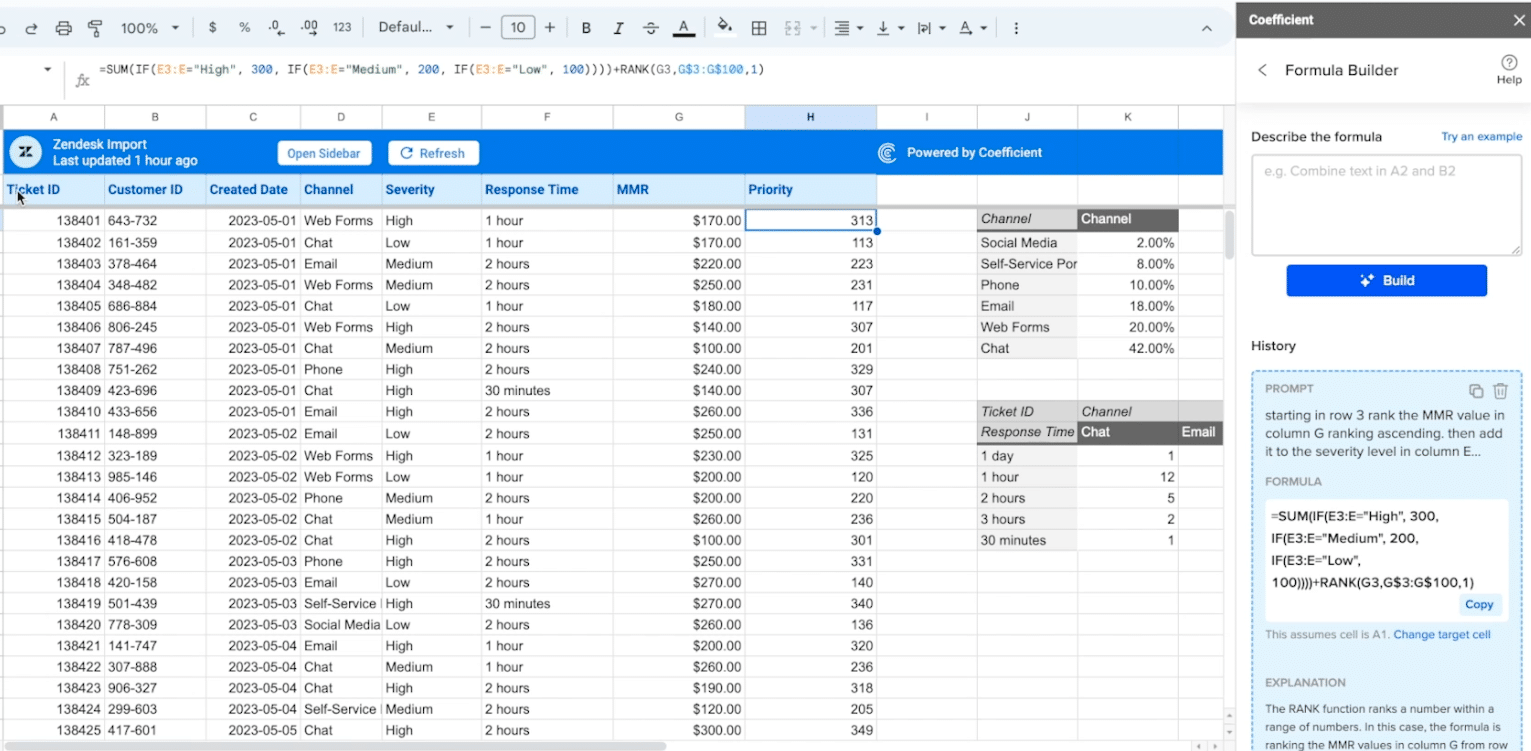
Finally, we will create a filter.
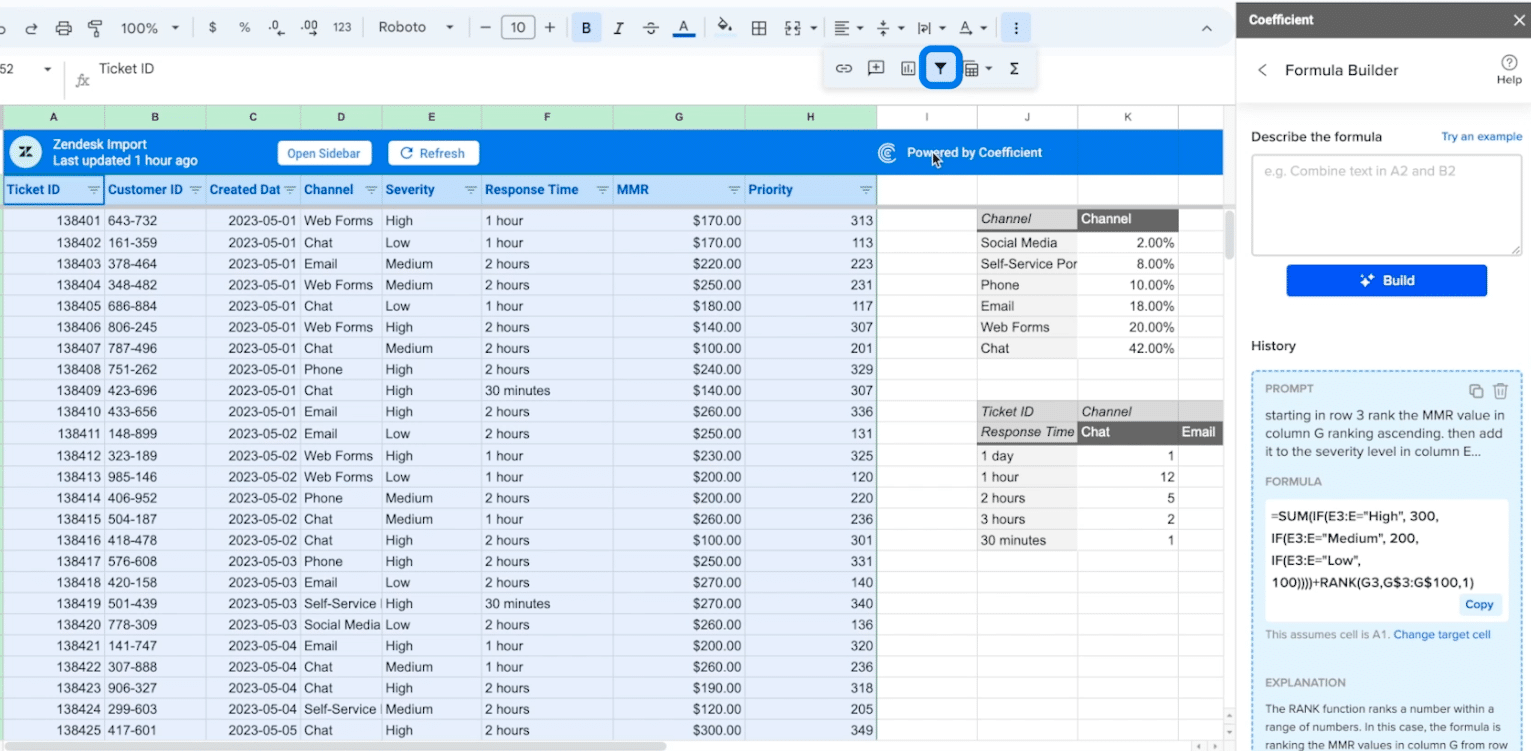
This will allow us to sort our omnichannel customer service data in descending order.
Prefer a visual guide? Check out the full video below!
Streamline Zendesk Customer Support Analysis with Coefficient + Google Sheets
Coefficient makes analyzing omnichannel customer support easier than ever before, leveraging Sheets and GPT to help you gain valuable insights into your customer support channels to improve your customer service.
Ready to get started? Install Coefficient for free today.