
As we step into 2024, having instant access to marketing metrics is not just a plus—it’s crucial. The need for quick, data-driven decisions is more pressing than ever, fueling effective marketing strategies and enhancing ROI.
This guide delves into the pivotal role of marketing metrics in today’s competitive landscape. With Coefficient’s sleek dashboard templates, marketing leaders and operators are equipped to gather and analyze key metrics effortlessly, setting the stage for impactful strategies that captivate your audience.
Top 5 Marketing Metrics for 2024
To stay ahead in 2024, understanding and acting on key marketing metrics will be essential. Here, we focus on five metrics that are particularly crucial for refining and evaluating the success of marketing initiatives.
Pro tip: combine live marketing data in your spreadsheet for powerful automation and customization capabilities.
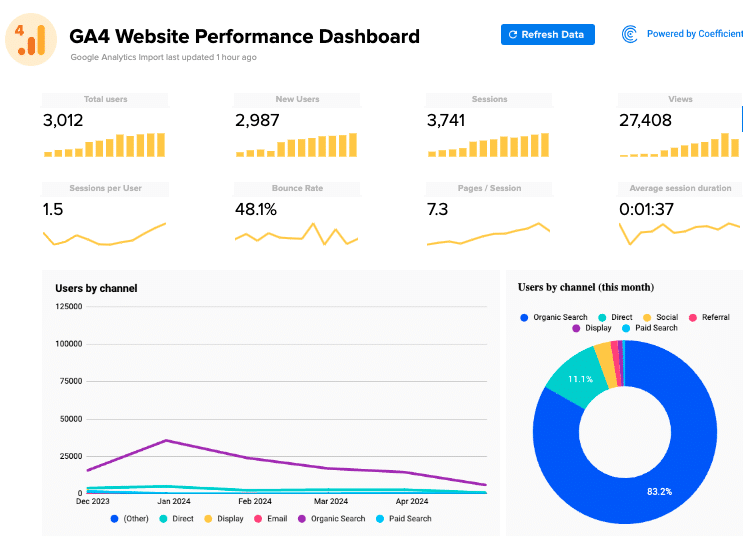
Website Channel Traffic & Breakdowns
Understanding your website traffic and channel performance is vital. It reveals where potential customers discover you, allowing for smarter marketing and budgeting decisions.
Key Benefits:
- Allocate Your Budget Wisely: Direct your marketing spend to the most effective channels.
- Refine Your Content Strategy: Tune your content approach based on real traffic data.
- Know Your Audience Better: Craft your marketing to meet audience needs and preferences more closely.
How it’s Calculated: Divide total traffic by source (like organic, referral, paid), giving you each channel’s impact.
Formula: Visitors per Channel / Total Visitors.
How Coefficient Templates Help:
Our template seamlessly integrates with analytics platforms like Google Analytics, enabling automatic data refresh and easy-to-understand visualizations, so you can pinpoint key traffic trends without manual data compilation.
- Real-time Performance Visualization: Visualize your website’s traffic growth and performance live. Directly connected to Google Analytics, Coefficient’s template equips you with the insights to optimally allocate your marketing budget.
- In-depth Traffic Insights: Unlock a comprehensive understanding of how audiences interact with your site. Simplify the extraction of crucial Google Analytics metrics for a contoured and effective content strategy.
- Streamlined Reporting: Eliminate the hassle of manual data compilation. Our dashboard brings all essential metrics into a single view, empowering you with accurate, up-to-date data for precise targeting and strategy refinement.
Download the Website Channel Traffic & Analysis template and start optimizing your channel strategies today.
Sales Opportunities from Paid Media
Evaluating sales opportunities springing from paid media clarifies your ad spend’s ROI. This metric is instrumental in fine tuning your ad strategies towards more profitable paths.
Key Benefits:
- Boost ROI: Identify which paid channels are most lucrative.
- Optimize Campaigns: Spotlight and scale winning campaigns.
- Informed Strategies: Lean on solid metrics to shape your advertising moves, minimizing
How It’s Calculated: Divide sales opportunities by total campaign expenditure.
Formula: Sales Opportunities / Campaign Spend.
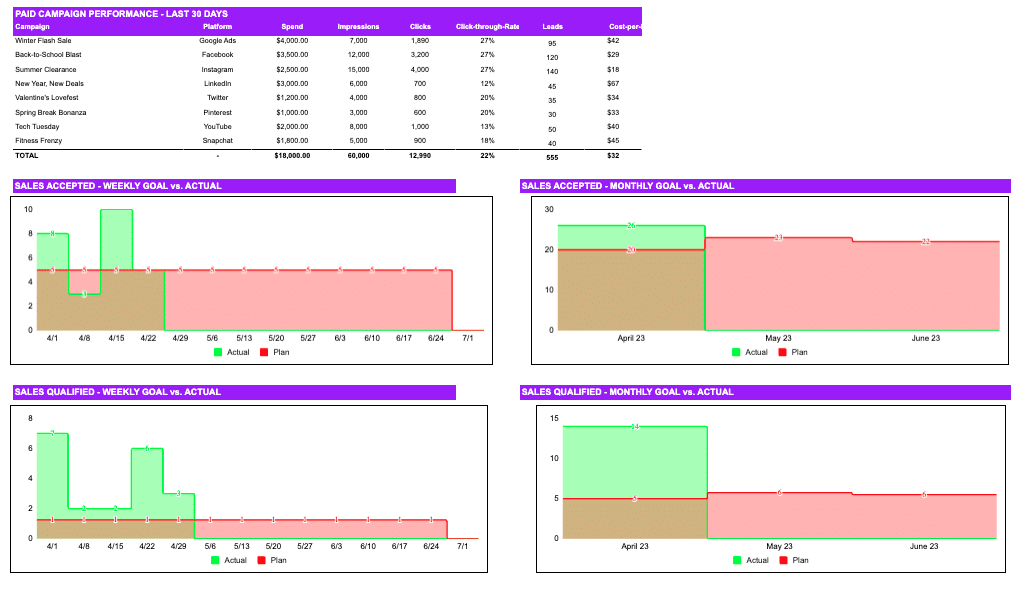
Coefficient’s Paid Ads Report template automates the connection between your sales data and paid campaign metrics, visualizing effectiveness and opportunities for optimization in real-time.
- Comprehensive Campaign Analysis: Evaluate every nuance of your paid campaign’s performance. From spend to CTR and cost per lead, Coefficient delivers a complete panorama for real-time adjustments and optimizations.
- Goal Tracking: Seamlessly compare actual results against your campaign goals. Visual insights enable nimble budget reallocations and strategic modifications, ensuring objectives are consistently met or exceeded.
- Opportunity Deep-Dive: Detailed analytics on every opportunity—from initiation to closure—offer a collaboration gateway between marketing and sales, effectively shortening the sales cycle.
Download for free. Capitalize on your ad spend with our Paid Ads Report template.
Organic Click-Through Rates (CTR)
Organic Click-Through Rate (CTR) serves as a barometer for content relevance and effectiveness, indicating how well your audience resonates with your organic content.
Key Benefits:
- Boost Visibility: Higher CTRs can elevate your organic search ranking.
- Drive Engagement: Adjust your content to better satisfy search intent.
- SEO Health Check: Evaluate your SEO strategy and pinpoint improvement areas.
How It’s Calculated: CTR is derived by dividing the total number of clicks a link receives by the number of times it’s shown. Formula: (Clicks / Impressions) * 100.
How Coefficient Templates Help: Coefficient’s Organic CTR template provides a straightforward way to track, compare, and analyze your CTRs, enabling you to swiftly adjust your content strategy for maximum impact.
- Data-Driven Strategy Refinement: Immediate insights from weekly clicks assist in fine-tuning content that resonates. With Coefficient, pivot your content strategy dynamically, ensuring every publication maximizes its impact.
- Visibility and Reach: Understand your digital presence through weekly impressions tracking. Make informed decisions to extend your reach and enhance audience engagement.
- Engagement Optimization: Continuous CTR analysis directs SEO and content development decisions, driven by solid audience feedback, to elevate your overall online visibility and interaction.
Boost your search rankings with the Organic CTR template.
Branded Traffic
Branded traffic measurement is key for gauging brand awareness and loyalty, reflecting the frequency of searches for your brand.

Stop exporting data manually. Sync data from your business systems into Google Sheets or Excel with Coefficient and set it on a refresh schedule.
Get Started
Key Benefits:
- Gauge Brand Visibility: Understand how visible your brand is.
- Measure Customer Loyalty: Monitor return customer engagement.
- Analyze Marketing Impact: Assess the impact of brand-centric marketing efforts.
How It’s Calculated:Branded traffic volume comes from searches including your brand name or variations.
Formula: Branded Searches / Total Searches.
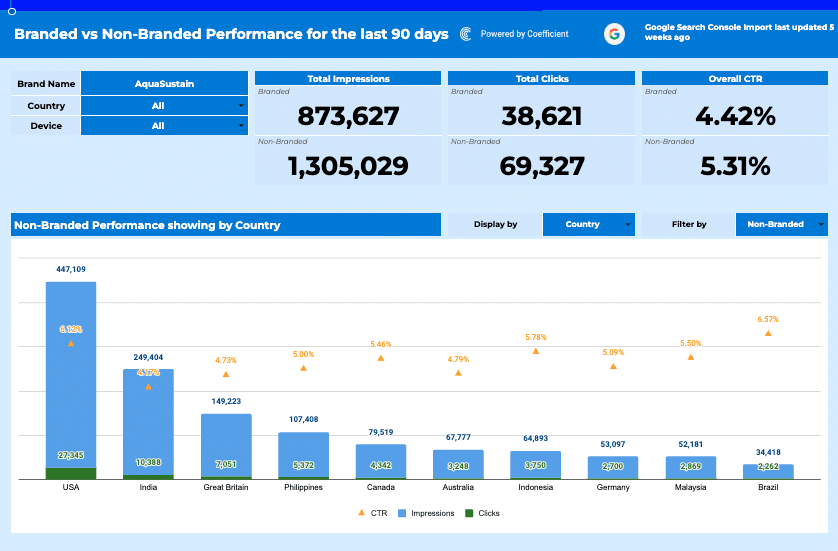
How Coefficient Templates Help: Simplify the process of tracking branded versus non-branded traffic with Coefficient’s Branded vs. Non-Branded Performance template, allowing for clear visibility into your brand’s search performance.
- Tailored SEO Mastery: Gain precise metrics on branded vs. non-branded search performance. Coefficient ensures you have the insights needed for content optimization that captivates and converts.
- Intent-Focused Content: Sharpen your focus on user intent for branded searches to improve conversion rates, while strategically targeting non-branded terms to capture early-stage prospects.
- Keyword Segmentation Efficiency: Organize and scrutinize your SEO data effortlessly. Our tools pave the way for clear content optimization strategies and streamlined planning.
Measure your brand’s strength with the Branded vs. Non-Branded Performance template.
Social Media Growth
Social media growth metrics unveil the effectiveness of your social media content and your social presence’s overall health.
Key Benefits:
- Community Engagement: Track how well you’re building and engaging your online community.
- Content Strategy Feedback: Determine which content boosts follower growth and engagement.
- Competitor Analysis: Compare your growth strategies against your competitors’.
How It’s Calculated: Monitor follower count changes, engagement, and content reach over time.
Formula: (Current Followers – Previous Followers) / Previous Followers * 100.
How Coefficient Templates Help: The Social Media Growth Tracker from Coefficient aggregates cross-platform social media metrics into one dashboard, simplifying analysis and strategy iteration.
- Comprehensive Social Health Check: View the vitality of your social strategy through a panoramic lens. With our tool, actionable insights on follower dynamics and content engagement are at your fingertips for agile strategy adjustments.
- Engagement Detailing: Delve into what truly engages your audience. With all key metrics centralized, strategize confidently knowing every decision is backed by data.
- Enhanced Team Collaboration: Leverage Google Sheets for a collaborative tracking environment, ensuring your team can synchronize, strategize, and succeed together in real-time.
Elevate your social media presence with the Social Media Growth Tracker.
Advantages of Integrating Live Data into a Unified Dashboard
Integrating live data into a unified dashboard transforms marketing analytics with solid, tangible benefits:
- Real-Time Data for Swift Campaign Adjustments: Enables immediate access to the freshest data, critical for swiftly tweaking campaigns in response to the latest trends and customer behaviors.
- Centralized Insights & Time Savings: Consolidates data from various sources for a holistic view, significantly reducing time spent on analysis and strategy adjustments, and thereby increasing overall productivity.
- Enhanced Collaboration with Custom Reporting: Improves team collaboration through shared, live data access and allows for the creation of detailed, custom reports tailored to specific strategy needs and stakeholder communication.
Success Stories: How Mutiny’s Marketing Operations Team Uses Coefficient
Mutiny leverages Coefficient to aggregate data from multiple marketing platforms into Google Sheets, dramatically enhancing their marketing strategy’s effectiveness and efficiency. This approach provides a comprehensive view of campaign performances and spending effectiveness, supporting swift, strategic adjustments.
The result? Live, accurate data Mutiny can trust to power reporting and hours saved with automated imports. “Coefficient gives me peace of mind. It allows us to confidently report across the org from BizOps to Finance, Revenue, and our C-Suite, said Brian Chalif, Head of BizOps at Mutiny.
Let Coefficient redefine your marketing data analysis process. Explore our (free) suite of templates and sign up to embark on a journey towards streamlined, data-driven marketing insights.


