Looker and Tableau are both serious enterprise BI tools. They are also built for fundamentally different audiences, operated by different parent companies, and priced on completely different models. Most comparison articles blur these differences. This one does not.
Before anything else: Looker is owned by Google Cloud. Tableau is owned by Salesforce. This single fact shapes everything downstream: the ecosystems they fit, the teams they suit, and the platform roadmaps they are betting on. If your organisation runs on Google Cloud and BigQuery, Looker is the natural choice. If your team lives in Salesforce CRM, Tableau is.
| Quick verdict: Looker is built for data engineering teams that need centralised metric governance and embedded analytics. Tableau is built for analysts and business users who need powerful, flexible visualisation with a shorter setup time. If your team is not sure which it needs, it almost certainly needs Tableau. Looker requires LookML expertise and a minimum $5,000/month platform commitment. |
Looker vs Tableau: What It Actually Costs
Looker does not publish standard pricing. Tableau does. This difference alone matters for procurement.
| Tier | Looker | Tableau |
|---|---|---|
| Platform / entry cost | $5,000+/month (Standard edition, billed annually | $75/user/month (Creator (minimum 1 licence)) |
| Developer / Author | ~$125/user/month | $75/user/month (Creator) |
| Standard / Explorer | ~$60/user/month | $42/user/month (Explorer) |
| Viewer / Consumer | ~$30/user/month | $15/user/month (Viewer) |
| Embedded edition | Custom (typically six figures annually) | Tableau Embedded via Tableau Cloud |
| Free tier | None | None (Tableau Public is free but public-only) |
| Pricing transparency | Contact sales required | Published on tableau.com |
Real-world cost context: a Looker deployment for a mid-market team of 50 users (5 developers, 15 standard, 30 viewers) runs approximately $5,000/month platform plus $625 + $900 + $900 in user fees, roughly $7,400/month or $88,800/year before implementation. Tableau for the same team (5 Creators, 15 Explorers, 30 Viewers) runs $375 + $630 + $450 = $1,455/month or $17,460/year.
Looker is approximately 5x more expensive than Tableau for a comparable mid-market deployment. That premium buys genuine governance, embedded analytics capability and LookML. Whether those features are worth it depends entirely on what your team actually needs.
Latest Feature Updates to Looker & Tableau
Looker: Semantic Views Now Generally Available
Google Cloud announced Looker Semantic Views at Summit 2025. Semantic Views extend Looker’s LookML governance model, allowing metric definitions (Revenue, ARR, Churn Rate) to be defined once in the semantic layer and surfaced consistently across every downstream tool that queries them. For organisations where metric inconsistency across departments is the core data problem, this is the highest-value 2025 development in the Looker product.
Looker’s Google AI integration has also deepened. Gemini-powered natural language querying is now available in Looker, allowing business users to ask questions without writing LookML or SQL.
Tableau: Tableau Pulse and AI Metric Monitoring
Tableau Pulse, available in Tableau+, is the most significant Tableau product development in 2025. Rather than requiring users to check dashboards, Tableau Pulse monitors key metrics continuously and pushes relevant changes to users via Slack, email or Salesforce workflows. It detects trends, anomalies and threshold breaches automatically, with personalised digests by role.
The practical effect is that Tableau moves from a pull model (go look at your dashboard) to a push model (we will tell you when something changes). For organisations where the bottleneck is business users missing important metric changes, Tableau Pulse changes the workflow meaningfully.
Feature Comparison: Looker vs Tableau
| Feature | Looker | Tableau |
|---|---|---|
| Core philosophy | Centralised governance via LookML semantic layer | Self-service exploration and visualisation |
| Primary user | Data engineers, analytics engineers | Business analysts, data analysts, business users |
| Data visualisation | Functional: adequate for governance-first teams | Industry benchmark: widest chart library |
| Ease of use | Steep: LookML requires SQL and modelling expertise | Moderate: drag-and-drop, but still a learning curve |
| Data modelling | LookML: code-first, version-controlled, Git-native | Tableau Prep + calculated fields: less governed |
| Metric governance | Strong: single definition, consistent across all tools | Limited: metrics can be defined differently per workbook |
| Embedded analytics | Excellent: API-first, white-labelled customer dashboards | Good: Tableau Embedded via Tableau Cloud |
| Google Cloud fit | Native: BigQuery, Vertex AI, Google Workspace | Connector-based: available but not native |
| Salesforce / CRM fit | Connector-based: available but not native | Native: direct CRM data flow, Tableau Pulse in Salesforce |
| AI features | Gemini NLQ, Looker Semantic Views (GA 2025) | Tableau Pulse (proactive metric monitoring), Tableau AI |
| Deployment | Cloud-only (Google Cloud) | Cloud, on-premises (Tableau Server), desktop |
| Pricing transparency | No published pricing | Published at tableau.com |
| Entry cost | ~$5,000/month platform plus per-user | $15/user/month (Viewer) |
Visualisation: Tableau Wins Clearly
This is not close. Capterra reviews consistently note that Looker’s chart types are functional but limited compared to Tableau. Looker’s strength is governance, not aesthetics. Tableau’s drag-and-drop interface and chart library depth (treemaps, waterfall charts, geographic maps, custom mark types) are still the benchmark for interactive data exploration.
If your team’s primary output is dashboards that business stakeholders read and explore, Tableau’s visualisation quality justifies its position. If your team’s primary output is governed metrics that other systems and tools consume, Looker’s governance model is more relevant than its chart library.
Governance: Looker Wins Clearly
Looker’s LookML semantic layer is the strongest metric governance model in enterprise BI. When a data team defines Revenue in LookML, every report, dashboard and embedded analytics surface that queries Looker reads that definition. There is no way for an analyst to accidentally create a different Revenue calculation in their workbook.
Tableau’s governance model is built on certified data sources, Tableau Catalog and row-level security. These are meaningful tools. But Tableau’s .twb workbook format is proprietary, lacks native Git branching and pull requests, and makes it easier for metric drift to occur across workbooks. When two analysts independently define a metric in their own workbooks, Tableau has no automatic mechanism to flag the inconsistency.
For large organisations where consistent, auditable metric definitions across departments are a compliance or governance requirement, Looker’s model is materially superior.
Which Should You Choose?
| Your situation | Recommendation |
|---|---|
| Your organisation runs on Google Cloud and BigQuery | Looker. The native integration is a meaningful advantage and the platform is already part of your infrastructure. |
| Your team primarily uses Salesforce CRM and needs BI in that workflow | Tableau. Native Salesforce integration and Tableau Pulse for proactive metric monitoring in Salesforce. |
| You need the best data visualisation quality on the market | Tableau. Looker’s chart library is functional, not exceptional. |
| You need centralised metric governance, meaning a single consistent definition of Revenue, ARR and Churn across all tools | Looker. LookML is the strongest governance model in enterprise BI. |
| You need embedded analytics in a customer-facing product | Looker for API-first, white-labelled embedding. Tableau Embedded is available but Looker is designed for this use case. |
| You have a tight budget or are mid-market | Tableau. Looker’s $5,000/month platform minimum is difficult to justify for teams under 50 users. |
| Your analysts are not SQL-fluent and need quick self-service | Tableau. LookML requires SQL and data modelling expertise. Tableau’s drag-and-drop is genuinely more accessible. |
| Your team works in spreadsheets, not BI dashboards | Coefficient alongside either tool. See below. |
When Your Team Works in Spreadsheets
Both Looker and Tableau are built for analysts who create dashboards that business users then consume via a BI platform URL. The workflow assumes a data team builds something and a business user reads it.

Stop exporting data manually. Sync data from your business systems into Google Sheets or Excel with Coefficient and set it on a refresh schedule.

Finance managers, RevOps leads and ops teams often work differently. They build their own analyses in Google Sheets or Excel, share results via links rather than BI platform access, and need data to stay live without filing a request with the data team.
Coefficient connects Google Sheets and Excel directly to 100+ source systems, including Salesforce, HubSpot, NetSuite, Snowflake, BigQuery and more, with scheduled auto-refresh and two-way sync. Vibe Reporting lets teams describe a dashboard in plain English and publish a live, shareable web dashboard from their spreadsheet data, without a BI platform licence.
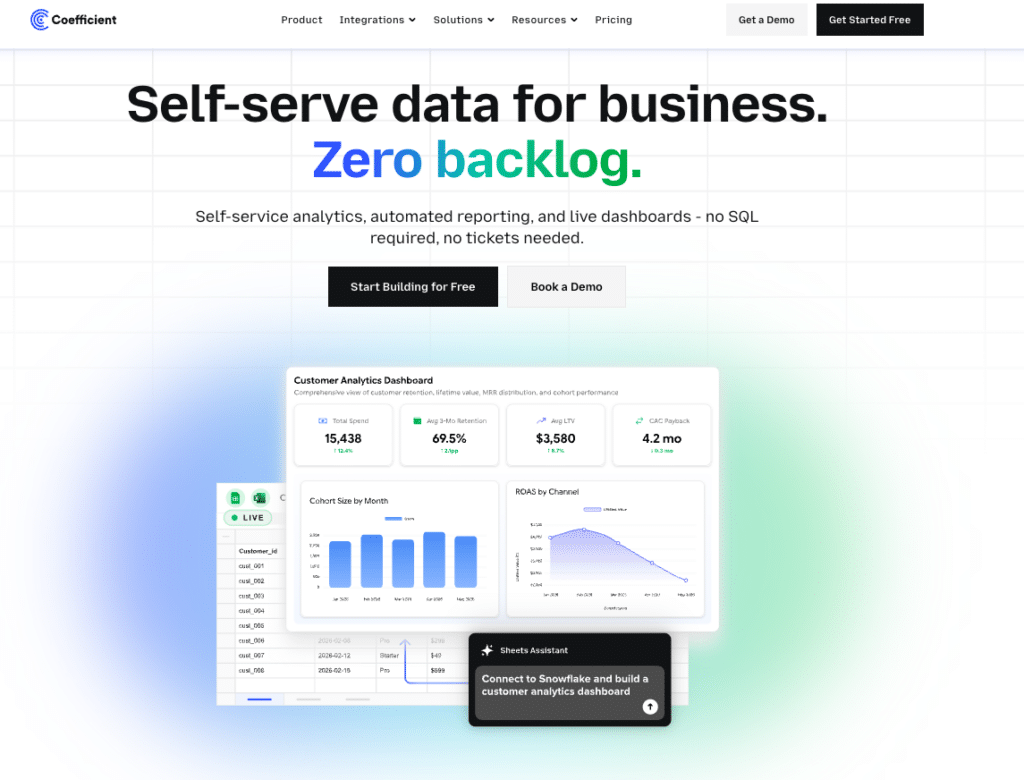
For teams choosing between Looker and Tableau, Coefficient fills the last mile where both platforms typically leave business users dependent on a data team.
| “Now teams across the company access real-time financial insights from their spreadsheets and make instant decisions with the most accurate data.” Christian Budnik, FP&A Analyst, Solv |
Frequently Asked Questions
Is Looker more expensive than Tableau?
Yes, considerably. Looker requires a minimum platform fee starting around $5,000/month plus per-user fees (Viewer $30, Standard $60, Developer $125 per user per month). Tableau’s published pricing starts at $15/user/month for Viewer licences. For a comparable mid-market deployment, Looker typically costs 4x to 5x more than Tableau.
What is the difference between Looker and Looker Studio?
They are completely different products. Looker is an enterprise BI platform with a LookML semantic layer, embedded analytics and data governance. It starts at $5,000/month. Looker Studio (formerly Google Data Studio) is a free self-service dashboard tool suited for Google ecosystem reporting. Pro adds enterprise features at $9/user/month. Most comparison articles that mention Looker mean the enterprise platform, not Looker Studio.
Which is easier to learn: Looker or Tableau?
Tableau is considerably easier to learn for business users and analysts. Its drag-and-drop interface allows non-technical users to build dashboards quickly. Looker requires LookML knowledge, which builds on SQL and data modelling concepts. Data engineers and analytics engineers find Looker’s model natural. Most analysts and business users find Tableau faster to get productive in.
Can you use Looker and Tableau together?
Yes, some large organisations use Looker for governed metric definitions and Tableau for business user exploration on top of those metrics. This combination is expensive and complex to maintain. Most teams consolidate on one platform based on their primary use case.
What is Tableau Pulse?
Tableau Pulse is Tableau’s AI-powered metric monitoring product, available in Tableau+. Rather than requiring users to check dashboards, Tableau Pulse monitors key metrics and pushes alerts and summaries to users via Slack, email or Salesforce when something changes. It detects trends, anomalies and threshold breaches automatically.
What replaced Google Data Studio?
Google Data Studio was renamed Looker Studio in 2022. It remains free for the standard product. Looker Studio Pro at $9/user/month adds enterprise governance, scheduled reporting and workspace management. Looker Studio is not the same as the enterprise Looker platform. They are separate products.


