Looker Studio is genuinely useful and genuinely free — for most Google-ecosystem reporting it does the job well. But it has real limitations that only show up after you’ve built a few dashboards and run into them. This guide covers the seven that catch teams most often, with a practical workaround for each one.
1. Slow Load Times on Large Datasets
What the problem is
This is the most commonly cited Looker Studio complaint. In 2025 G2 reviews, 38% of users flagged performance issues — slow dashboards, timeouts and visualisations that take several seconds to render. The more data sources and blends in a report, the worse it gets.
Why it happens
Looker Studio runs queries against the data source every time a report loads or a filter changes. It does not cache aggressively. Community connectors add extra latency on top. The result: a 10-widget dashboard pulling from three sources can take 10 to 20 seconds to load — which is long enough for a stakeholder to assume something is broken.
Pricing note
Looker Studio Pro ($9/user/month) does not fix slow load times. The performance issue is architectural. Pro adds governance features, not query speed. More on what Pro actually includes here.
Workaround
Push the heavy lifting upstream. Pre-aggregate and pre-join your data in Google Sheets or BigQuery before connecting to Looker Studio. Instead of asking Looker Studio to calculate on the fly, feed it a clean, pre-calculated table. One clean Sheets tab connected to Looker Studio loads in a fraction of the time of a multi-source blend queried at render.
| Coefficient pulls live data from 100+ sources into Google Sheets on a refresh schedule. Your Looker Studio report reads from a clean, pre-calculated Sheets tab — no multi-source query at load time. Get started free. |
2. Data Blending Is Capped at 5 Sources
What the problem is
Looker Studio limits data blending to five sources per blend. For marketing teams combining CRM, paid ads, SEO, email and financial data that ceiling is reached fast. Hit it and your only options are cutting a data source or splitting analysis across multiple reports — neither of which gives stakeholders the unified view they need.
Why it matters
The cap itself is bad enough. The silent failure mode is worse. When a schema changes upstream — a renamed column in Google Sheets, an updated field in your CRM — blends break without a useful error message. Your dashboard just shows empty charts. You may not find out for days if no one is actively monitoring it.
Pricing note
The 5-source blending limit applies on both the free tier and Looker Studio Pro. Upgrading does not raise the cap.
Workaround
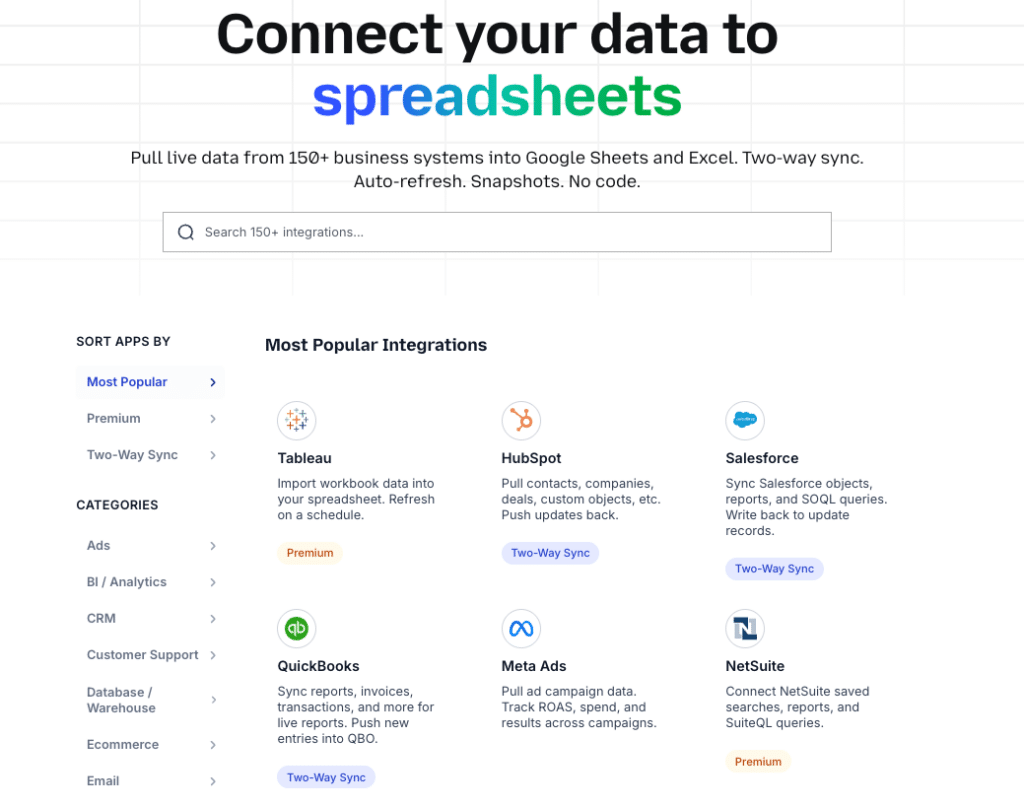
Do the joining and blending before it reaches Looker Studio. Use Coefficient to pull your data sources into a single Google Sheet — Salesforce pipeline, Google Ads spend, HubSpot contacts — and use Sheets formulas or the AI Sheets Assistant to join them into one clean table. Connect Looker Studio to that single output tab. One source, no blending cap, no silent failures.
3. No Free Native Connectors for Most CRMs and ERPs
What the problem is
Looker Studio’s free native connectors cover Google’s own ecosystem well — GA4, Google Ads, Search Console, BigQuery, Google Sheets. Outside that ecosystem, you are paying for partner connectors. Salesforce, HubSpot, NetSuite, Snowflake and most CRMs have no free native connector in Looker Studio.
Connector costs in practice
Partner connectors typically start at $49 to $119/month per source. If you need Salesforce and HubSpot in the same Looker Studio report, you are looking at $100 to $240/month in connector fees alone — on a tool that is otherwise free. That cost scales further if you want multiple sources or faster refresh rates.
Pricing note
Looker Studio Pro does not include CRM or ERP connectors. You pay for Pro ($9/user/month) and still pay separately for each partner connector on top of that.
Workaround
Use Coefficient as the data layer instead of a partner connector. Coefficient pulls live data from HubSpot, Salesforce, NetSuite, Snowflake and 100+ other systems into Google Sheets on a refresh schedule. Google Sheets then connects to Looker Studio via the free native Sheets connector. You get live CRM data in Looker Studio dashboards at zero connector cost.
4. Email Scheduling Limits
What changed
In March 2025, Google introduced quotas on scheduled email delivery in Looker Studio. Free accounts are now capped on both daily and monthly email sends. Each scheduled email is limited to a maximum of 50 recipients, including Google Groups or aliases. This was a silent change that caught agencies and larger teams off guard mid-cycle.
Who it affects most
Agencies sending weekly performance reports to multiple clients. Internal teams distributing dashboards to large distribution lists. Any team relying on scheduled email delivery as the primary way stakeholders access reports. If your sends hit the daily cap, reports simply don’t go out — with no automatic notification to recipients.
Pricing note
Looker Studio Pro removes the email quota — but only for reports stored as organisational assets. Reports in personal ‘Owned by me’ folders are still subject to quotas even on Pro. Getting the benefit requires both upgrading ($9/user/month) and migrating reports to an organisational folder.
Workaround
Switch from scheduled email delivery to link sharing. Looker Studio’s shareable report links bypass the email quota entirely — anyone with the link can view the report without needing a Google account. For teams that need email delivery at scale without the quota, upgrading to Pro and storing reports as organisational assets is the path — but verify the folder structure before assuming the quota is lifted.
5. No Version History or Meaningful Undo
What the problem is
Looker Studio saves changes automatically — which sounds helpful until you realise there is no version history, no named versions and no rollback. The undo function works within a session but does not persist. Close the tab or refresh and you lose your undo history. If you restructure a report and break something, you are rebuilding from memory.
Why it catches people out
In a collaborative environment this is particularly risky. Multiple editors can work on the same report simultaneously. One person’s well-intentioned edit can break a dashboard that 20 people check every morning — with no way to restore the previous state. There is no audit log on the free tier, so you may not even know who made the change.
Pricing note
Looker Studio Pro does not add version history or rollback. This limitation exists at both tiers.

Stop exporting data manually. Sync data from your business systems into Google Sheets or Excel with Coefficient and set it on a refresh schedule.
Get Started
Workaround
Duplicate the report before making any structural changes. Keep a named backup copy — ‘Dashboard v2 — DO NOT EDIT’ — as your rollback point. For shared team reports, establish a clear ownership rule: only the report owner makes structural changes. It is a manual discipline rather than a platform feature, but it works.
6. Calculated Fields Are Too Limited for Real Analysis
What the problem is
Looker Studio’s formula language covers the basics — SUM, AVG, CASE WHEN, date functions, string manipulation. It does not cover nested logic that stays readable, array functions, statistical functions beyond basic aggregations or any form of predictive calculation. For RevOps and finance teams trying to build calculated metrics like cohort retention, deal velocity by segment or budget variance, you hit the ceiling quickly.
Why it matters
Teams work around it by pushing formula logic back into Google Sheets — which undermines the point of having a connected dashboard. You end up with calculated fields in Sheets, manual refresh steps and a Looker Studio report that is just a visualisation layer on top of a spreadsheet that someone has to maintain separately.
Pricing note
Calculated field capabilities are the same on free and Pro tiers. Upgrading to Pro does not expand the formula language.
Workaround
Embrace the Sheets layer rather than fighting the Looker Studio formula limit. Use Coefficient’s AI Sheets Assistant to generate complex formulas in Google Sheets from plain English — cohort analysis, multi-condition SUMIFS, deal velocity calculations — and feed the clean output into Looker Studio. You get the full power of Sheets formulas in your data layer and Looker Studio handles visualisation only. Cleaner separation, more maintainable.
7. Community Connectors Break Without Warning
What the problem is
Looker Studio’s partner and community connectors are maintained by the connector provider, not by Google. When the source API updates, the connector can break. Your dashboard shows no data or stale data — sometimes with no error message at all. You may not know for days unless someone actively checks.
Why it is worse than it sounds
The breakage is often invisible. Looker Studio caches data, so reports can appear to load normally while showing data that is days old. An API version change at the source, an authentication token expiry or a schema update upstream can all silently break a connector. For dashboards that leadership checks weekly, the first sign of a problem is often a question about why the numbers look wrong.
Pricing note
Community connector reliability is the same on free and Pro. You are dependent on the connector provider’s maintenance cadence regardless of which tier you are on.
Workaround
Own the data layer yourself. When Coefficient pulls data into Google Sheets and Sheets connects to Looker Studio via the native connector, you control each layer independently. If something breaks you can see exactly where — in the Coefficient import, in the Sheets formula or in the Looker Studio connection — and fix it in isolation. There is no black-box third-party connector in the middle going stale without telling you.
Already Have the Data in Sheets? Publish It as a Live Dashboard
If the limitations above are adding up, the cleaner fix is to skip the Looker Studio layer entirely. Coefficient’s Vibe Reporting lets you describe the dashboard you want in plain English and publishes a live, shareable web dashboard directly from your spreadsheet data.
No connector fees. No 5-source blending cap. No email quotas. No community connector breaking at 2am. The dashboard updates automatically on your Coefficient refresh schedule and shares via link — no Google account required for viewers.
For teams already pulling CRM, ad platform and financial data into Sheets with Coefficient, this turns that spreadsheet into a standalone reporting layer without adding another platform, another subscription or another thing to maintain.
| Pull live data into Sheets with Coefficient, describe your dashboard in plain English and publish it as a live web report. See Coefficient in action. |
The Bottom Line
Looker Studio is a solid free tool for Google-ecosystem reporting. These limitations are real, but every one of them has a workaround — most of which involve moving the data work upstream into Google Sheets rather than asking Looker Studio to do it at render time. If you are hitting several of these regularly, Coefficient solves the data layer problems and Vibe Reporting replaces the output layer entirely. Get started free.


