In this guide, we’ll show you how to create Looker dashboards to fulfill the BI demands of your team.
Looker is a business intelligence platform that empowers you to explore big data and share real-time business insights. The Looker platform allows you to build customizable, user-friendly, and interactive data visualizations for diverse teams.
Looker dashboards track mission-critical metrics and KPIs for sales, marketing, operations, and other business teams. With Looker dashboards, teams can enhance efficiency and profitability by making data-driven decisions.
This guide will demonstrate how to create a Looker dashboard, from start to finish, through several step-by-step tutorials.
How to Create Looker Dashboards: The 3 Methods
1. Building User-Defined Dashboards
You can create user-defined dashboards in the Looker UI, but before you can build one, you’ll need:
- A Manage Access, Edit access-level for the folder that will store the dashboard
- These Looker permissions: save_content and see_user_dashboards
- Access to the LookML models for the data in the dashboard
Create a Looker Dashboard from a Folder
Open your Looker account. Select the folder you want to store your dashboard in. Then follow these steps:
- Click New at the top right of your folder.
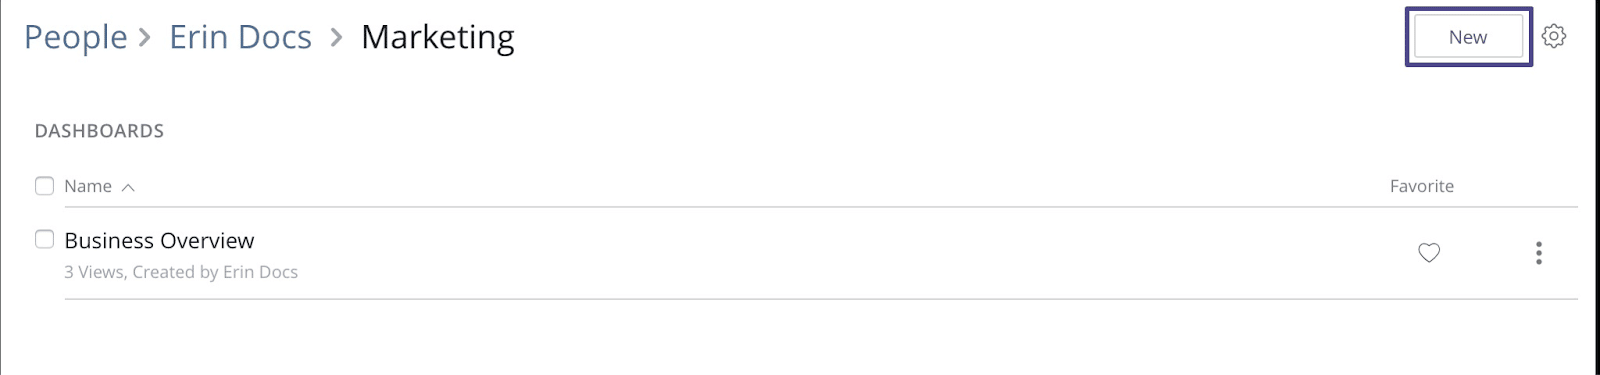
- Select Dashboard from the dropdown. The Create Dashboard window will pop up.
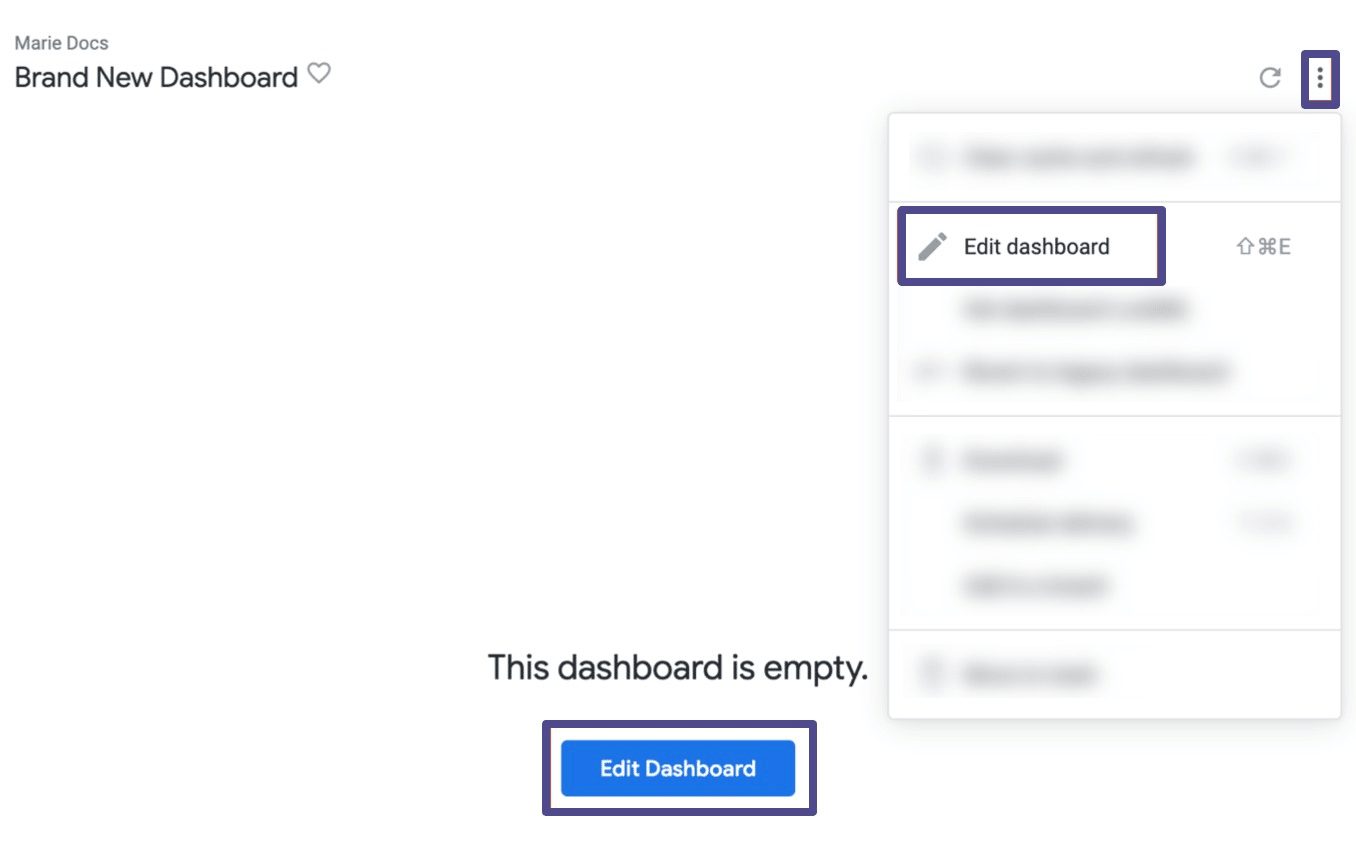
- Enter your dashboard’s name. Press the Create Dashboard button. Looker will create a blank dashboard.
- Add Tiles to your dashboard by selecting Edit Mode. You can enter Edit Mode by clicking the Edit Dashboard in the middle of the dashboard pane or from the dashboard menu.
Now you can start building and designing your dashboard.
Create a Looker Dashboard from a Look or an Explore
You can also create a Looker dashboard from a Look or an Explore:
- A Look is a saved visualization that business users can create.
- An Explore is the starting point for a query in Looker. Explores reference views and can contain joins to other views.
Follow these steps to create a dashboard from a Look or an Explore:
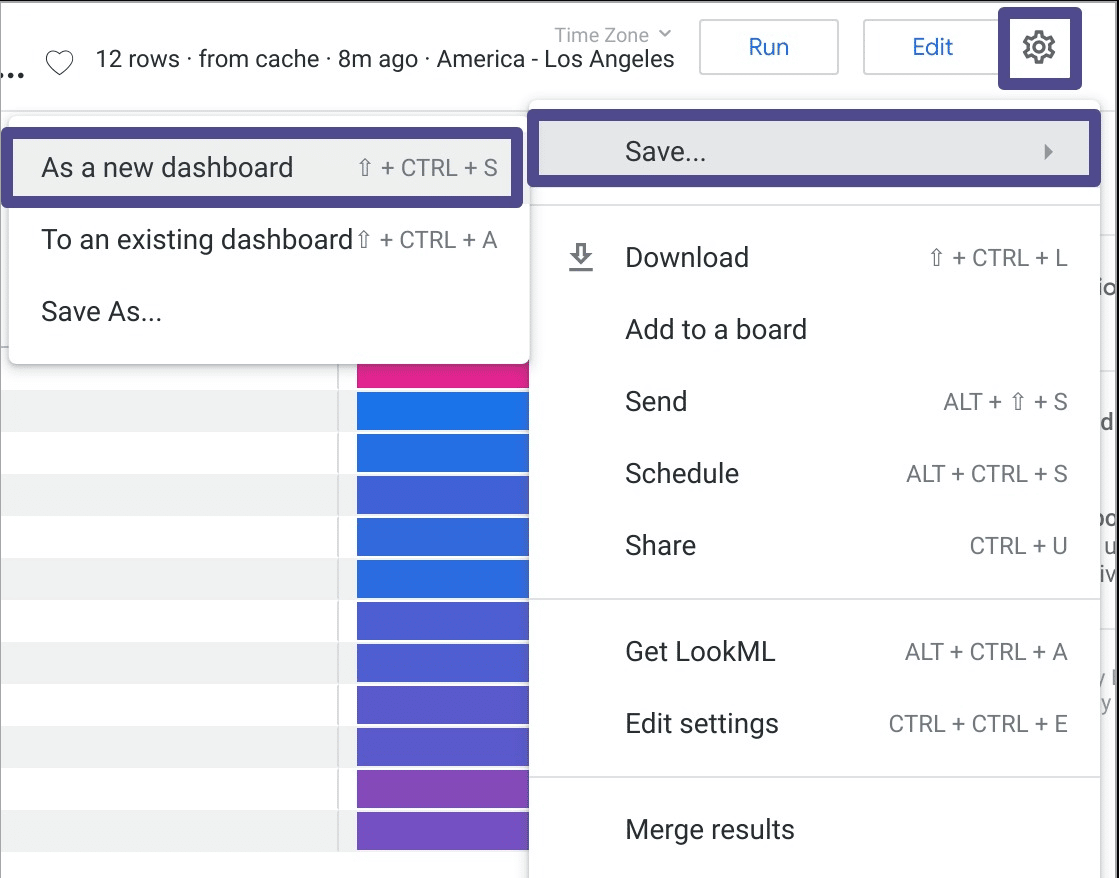
- Navigate to a Look or an Explore where you want to create your dashboard. Click Save in the settings (gear icon) menu.
- Select As a new dashboard from the sub-menu. You’ll see the Save as a new Dashboard window appear.
- Type your new dashboard’s name into the Settings tab’s Title field. The name will apply to the tile and the dashboard, which you can change at any time.
- You can edit the dashboard’s name by entering Edit Mode on the dashboard.
- Choose the folder where you want your dashboard to be saved.
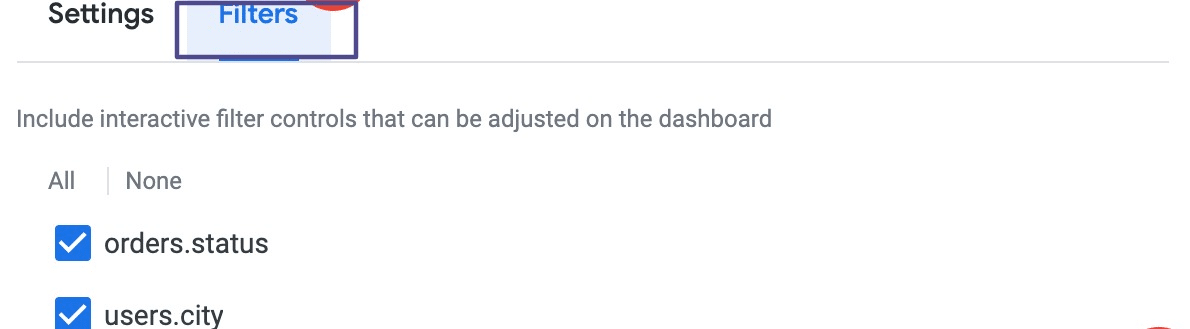
- Select the Look or Explorer filters you want to apply as dashboard filters under the Filters tab. Custom filters cannot operate as dashboard filters, but they can still function as Tile filters.
- Click Save when you’re done.
- You’ll see the dashboard in your Add to a Dashboard window. From there, select your new dashboard and add it as a Query tile.
That’s how you create your Looker dashboard from an Explore or Look.
Adding tiles and text to your Looker dashboard
Now that you know the initial steps for creating your Looker dashboards, let’s move on to adding tiles and other dashboard elements.
The first tile you add will take up the whole dashboard’s width. Additional tiles get sized to up to one-third of the dashboard’s width and placed horizontally under your first tile.
Looker will add more rows of tiles as required. You can resize and move tiles accordingly. You can also modify tiles after creating them to edit the names, Looks, underlying queries, and visualizations.
The types of dashboard tiles you can add include:
- Query tiles: Add query tiles to a dashboard using an Explore or a Look. Query tiles contain independent queries. Queries in a query tile are linked to the dashboard, and will not be impacted if they are deleted elsewhere in Looker.
- Look-linked tiles: You can insert look-linked tiles onto your dashboard using a Look. Look-linked tiles contain a query linked to a Look. The tile always references the query contained in a Look, both when the tile is created, and whenever the dashboard is refreshed. Look-linked tiles allow you to create, change, and test queries in a single Look, but use it in multiple dashboards. Changes to the Look also result in modifications to the linked tiles.
- Text tiles. Text tiles allow you to add descriptions and visual markers to your dashboards. Looker also has a pre-existing text tile option that uses markdown syntax to style the output.
Now that you have an overview of the different tiles, here’s how you add them to your dashboard.
Creating query tiles within your dashboard
- Navigate to Edit Mode to build a query tile within the dashboard
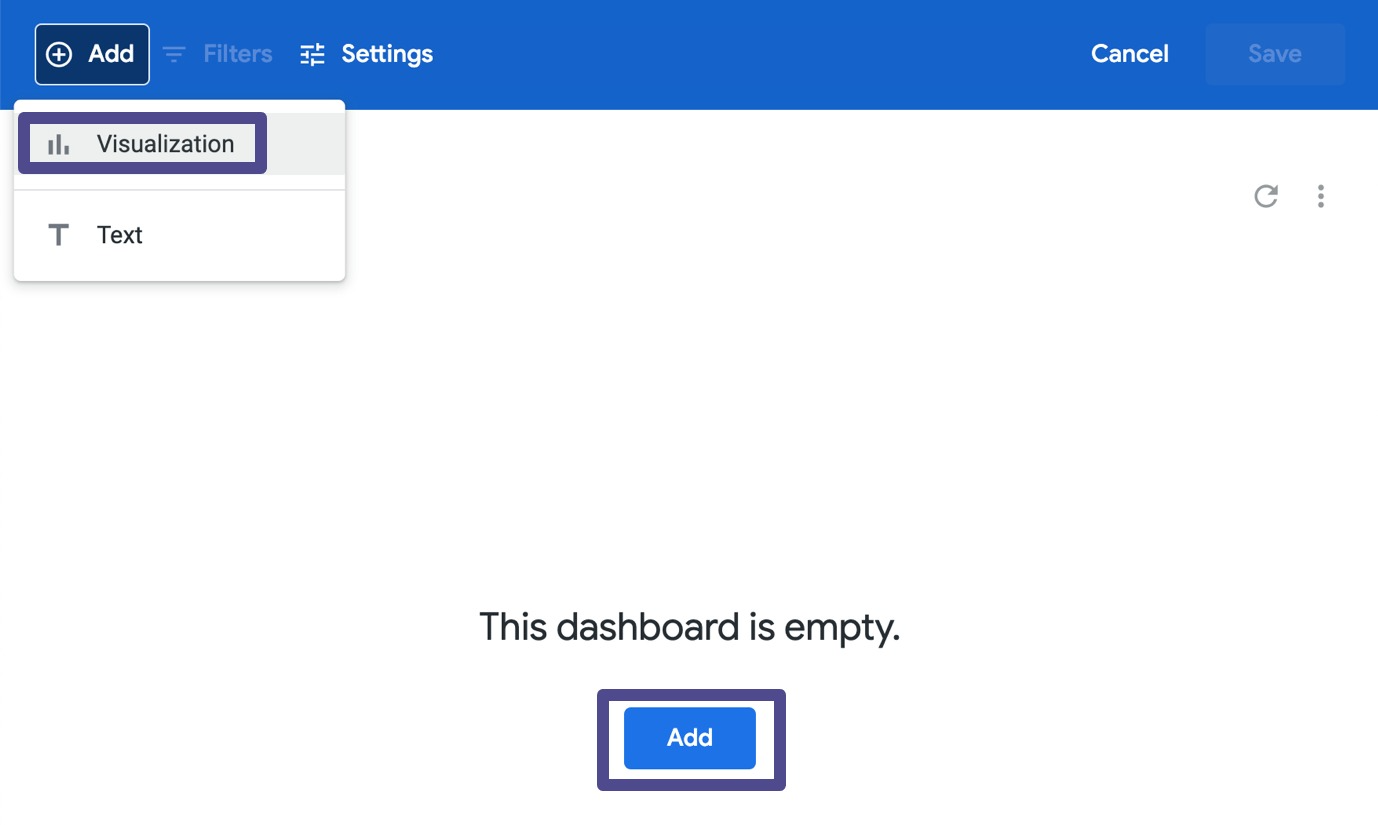
- Click Add on the top left button and select Visualization. Or click the Add button in the middle of the dashboard pane.
- You should see an Explore menu. Click on the menu and choose how you want to configure your query. Here’s an overview of some of the corresponding options:
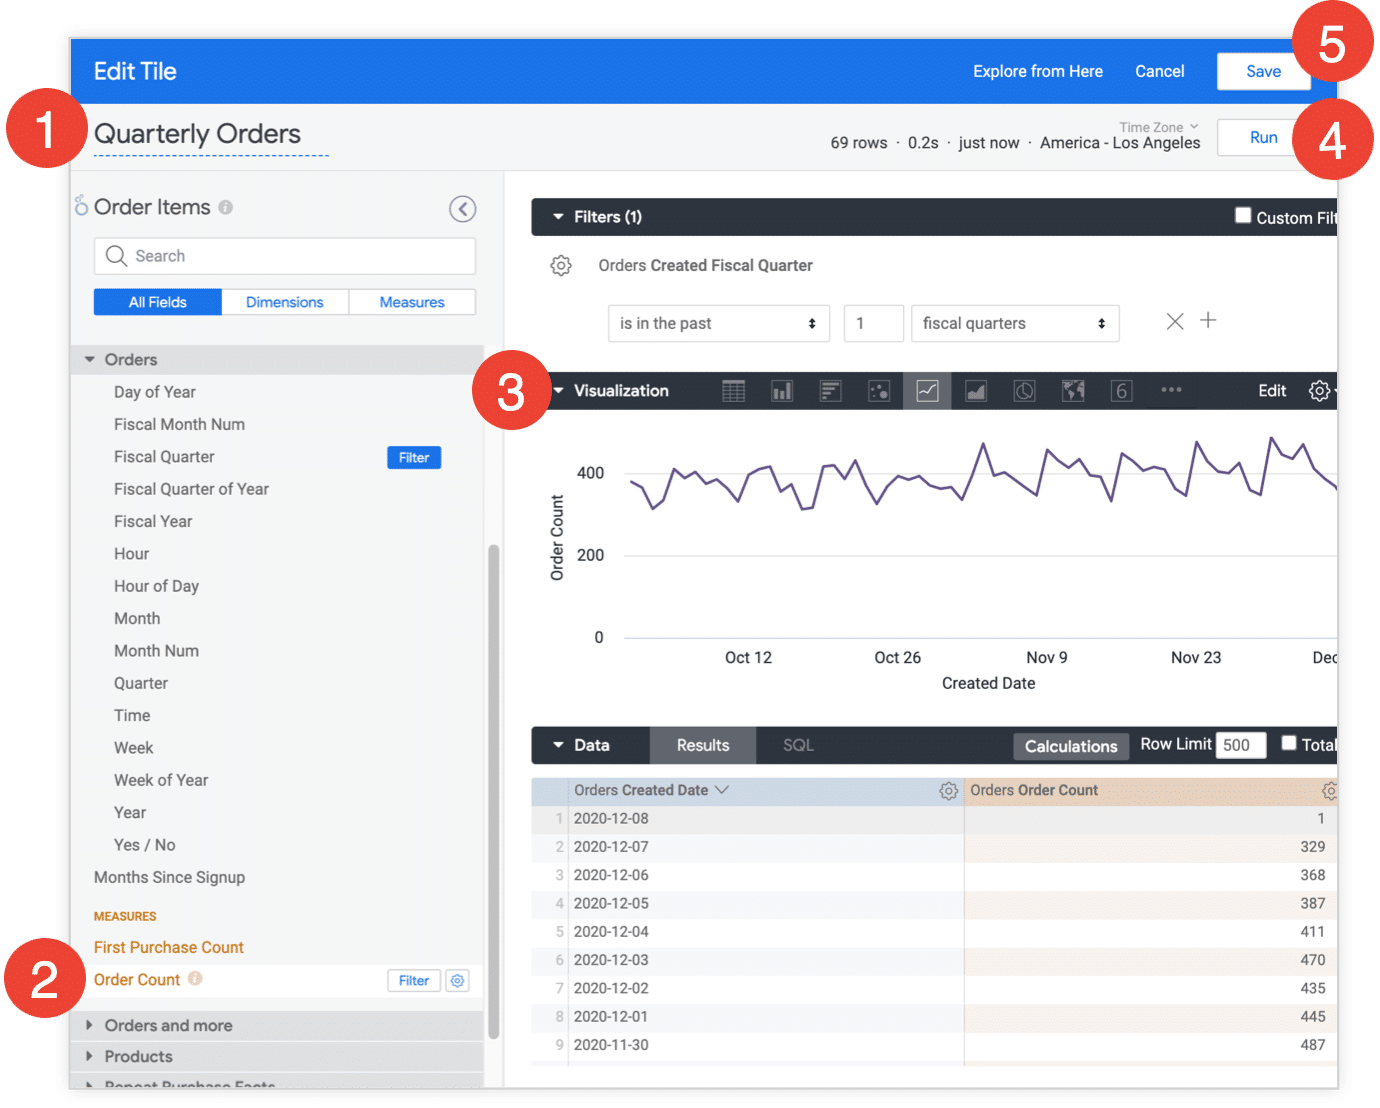
- Name your query (the tile’s name on the dashboard).
- Choose your query’s fields and filters.
- Set up your Visualization options.
- Click Run after setting up your query.
- Then save the query as a tile within your dashboard.
Adding query tiles from a Look
- Go to an Explore or a Look and click Save from the settings menu at the top right of the interface.
- On the displayed sub-menu, click To an existing dashboard to open the Add to Dashboard window.
- Choose the folder where the dashboard is stored and select the dashboard. Then click Save to Dashboard.
- Click the dashboard’s title in the confirmation message to enter Edit Mode. You can start moving and resizing tiles accordingly from here.
- If the Look was made from the same Explore, the new tiles will automatically have the dashboard filter.
Adding Look-linked tiles from a Look
- If the Look and the dashboard are in the same folder, you can insert a Look-linked tile on the dashboard. If not, then move the Look and the dashboard into a single folder.
- Click To an existing dashboard on the sub-menu to open the Add to Dashboard window.
- Select the folder containing the dashboard and Look.
- Select the dashboard and click Add Look to Dashboard.
Adding query tiles from an Explore
- From an Explore, navigate to the query you want to add to a dashboard.
- Click the gear icon. Select Save from the dropdown menu. Then select To an existing dashboard on the sub-menu.
- On the Add to Dashboard window, enter your tile’s title and choose the folder where the dashboard is stored.
- Select the dashboard. Click the Save to Dashboard button.
- Click the dashboard’s title in the confirmation message to launch the dashboard in Edit Mode. From here, you can adjust the tiles as you like.
Adding text
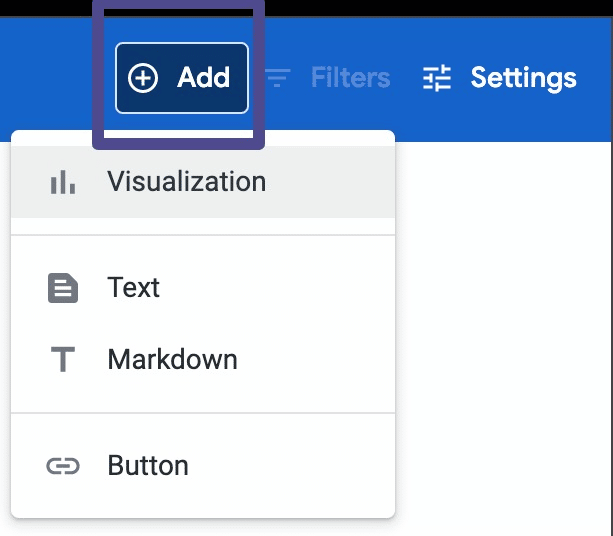
- Once in Edit Mode, click the Add button. Select Text from the dropdown.
- Enter your title, subtitle, and body in the Add Text window. Titles, subtitles, and body text can support some HTML, including images and links. Additionally, body text supports markdown.
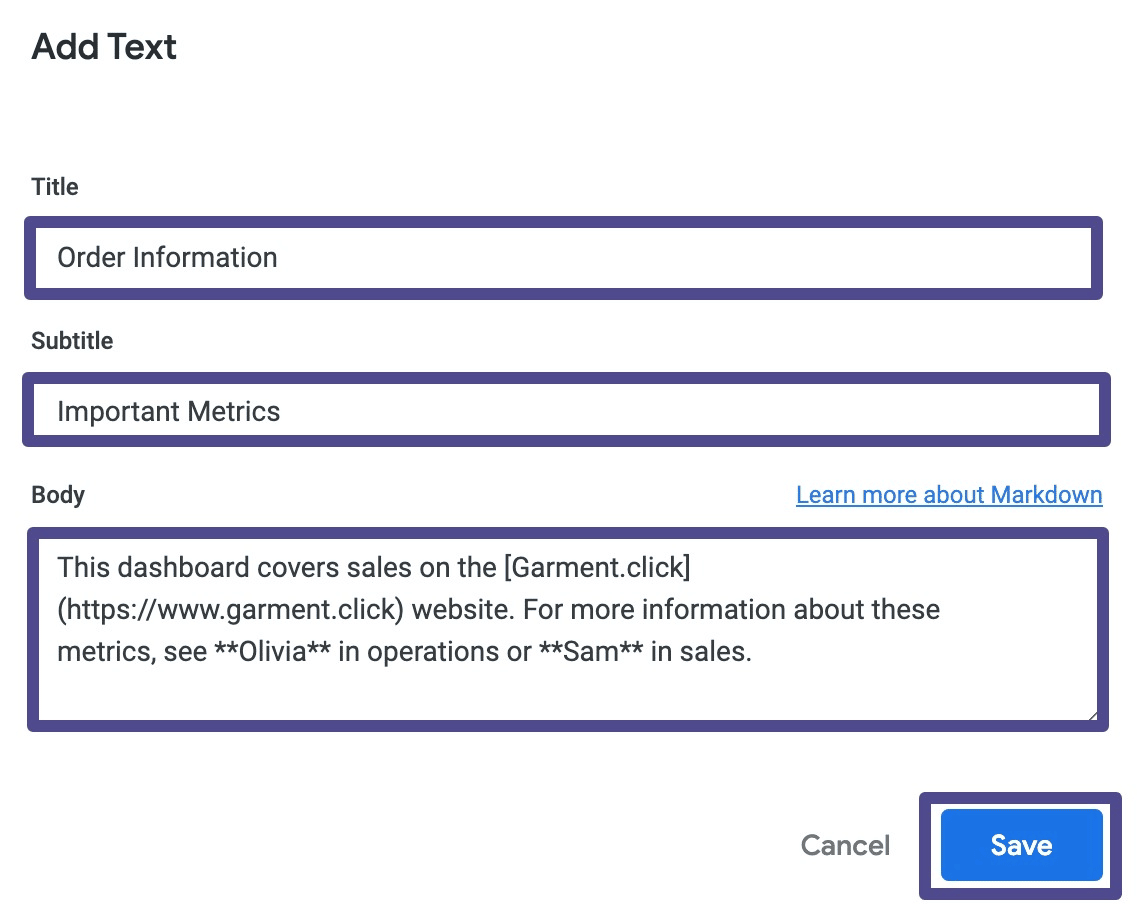
- Click Save and your text tile will appear at the bottom of the dashboard. Adjust and move the tile as you like.
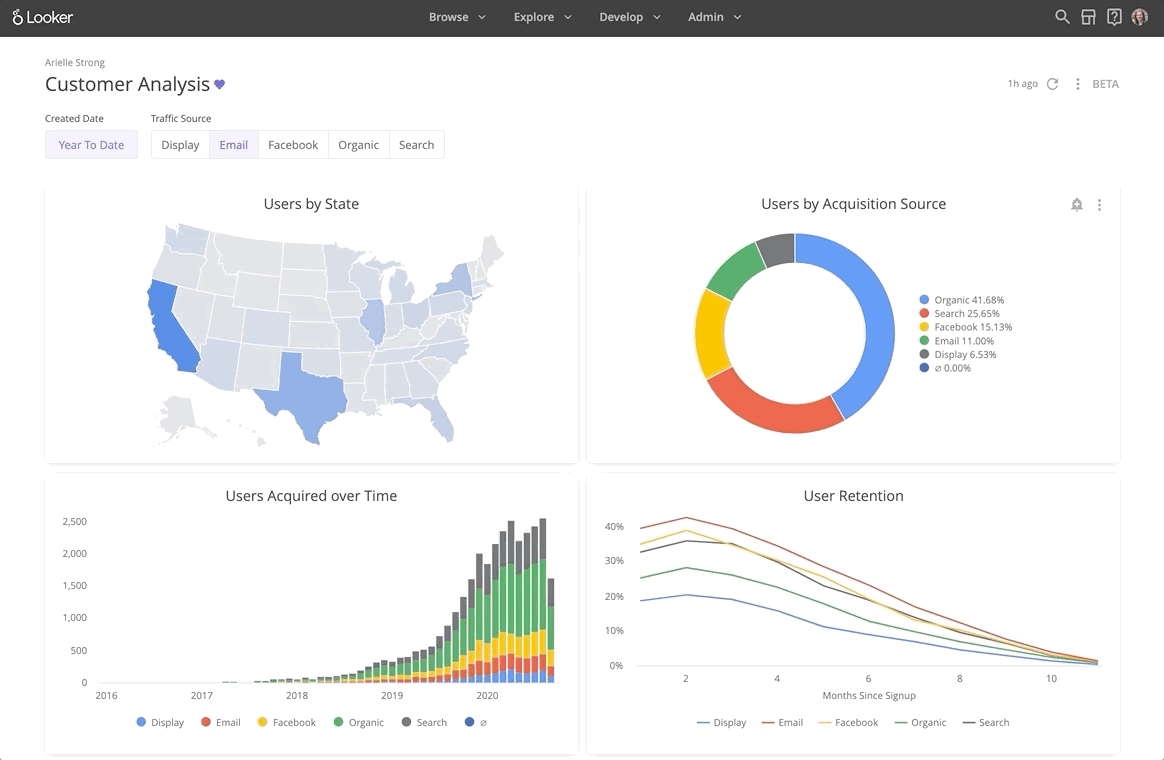
Final Product
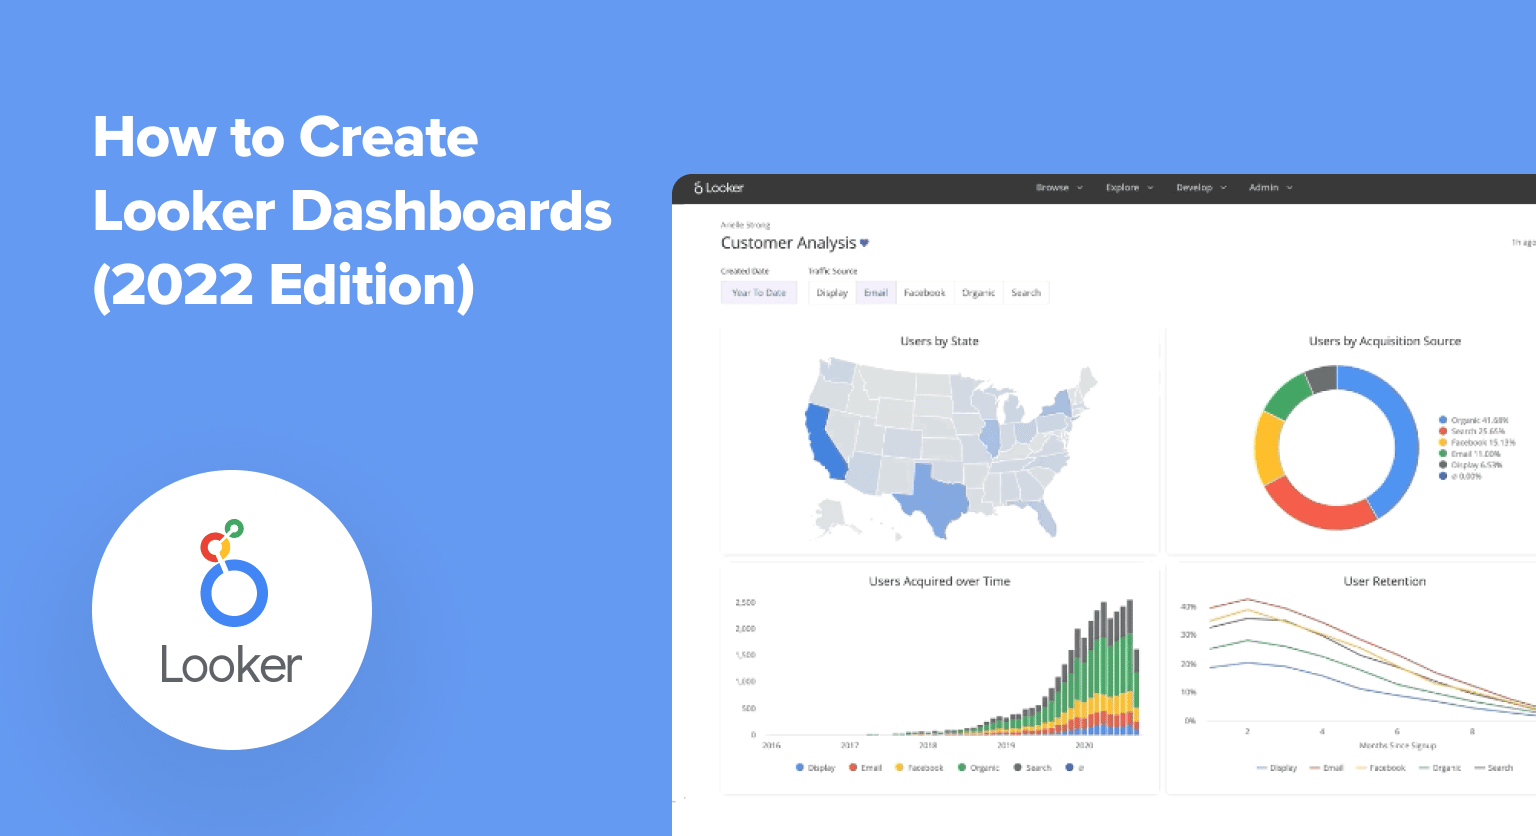
After adding all your tiles and other elements, you’ll have a complete Looker dashboard, such as the Customer Analysis dashboard we built below.
Other steps in creating user-defined Looker dashboards that are not covered in this guide include:

Stop exporting data manually. Sync data from your business systems into Google Sheets or Excel with Coefficient and set it on a refresh schedule.
Get Started
- Adding buttons
- Adding data actions to the tiles
- Adding a dashboard description
- Configuring dashboard settings
Now you can use Looker’s cloud-based BI features to create real-time dashboards for insightful data analysis.
2. Creating LookML dashboards
You can also create LookML dashboards in Looker. LookML is a language for describing dimensions, aggregates, calculations, and data relationships in a SQL database.
A LookML project is a collection of model, view, and dashboard files that are typically version controlled together via a Git repository. Before creating a LookML dashboard, you’ll need:
- The access level (Manage Access, Edit) for the folder where you want to place your dashboard.
- The necessary Looker permissions to create LookML dashboards.
- Access to the LookML models for data you wish to use in the dashboard.
Once you’re done with the prerequisites, you can start building a LookML dashboard:
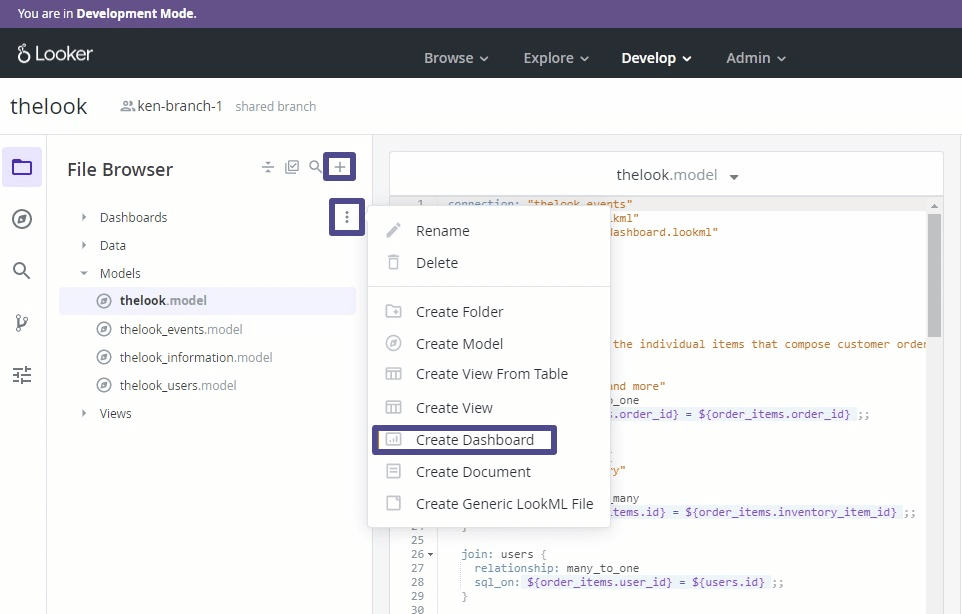
- Enable Development Mode in the Develop menu and go to your project.
- Click the plus (+) icon at the top of the file browser panel within the Looker IDE. You can also select the three-dot menu to make the file inside the folder, then click Create Dashboard.
- Name your dashboard file and click Create. New LookML dashboard files automatically set the preferred_viewer dashboard parameter to dashboards-next to default to the new dashboard experience.
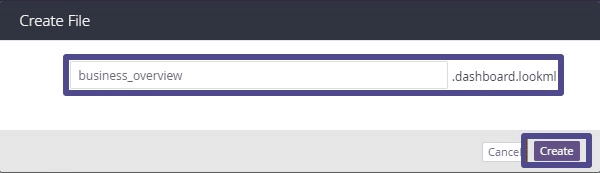
- Start creating your LookML dashboard from here. You can configure preferred_viewer to dashboards to render new LookML dashboards as legacy dashboards.
3. Connecting Looker Dashboard Data to Google Sheets
While Looker dashboards provide organized, visualized insights, they do not provide teams with data that is immediately actionable.
A team member might be able to set high-level decision-making from a Looker dashboard. But if they want to integrate this data into a business workflow, or run their own analysis, it is difficult to disaggregate the data from a Looker dashboard.
However, the rich and robust BI data that powers Looker dashboards offers immense potential for line-of-business users, such as SalesOps managers.
The data in Looker has already been transformed by SQL queries, a programming language that few business users know how to use. But they typically only see the visualizations of this transformed data, and do not have direct access to it.
Coefficient changes all of that. With Coefficient, business users can import Looker data directly into Google Sheets for self-service data analysis. This gives business users the best of both worlds: the valuable transformed data of Looker, combined with the ease and familiarity of Google Sheets.
Coefficient allows non-technical users to leverage BI data without needing to learn SQL, LookML, or even Looker, for that matter.
They can harness the rich data associated with Looker dashboards, and create their own visualizations, reports, and analyses, directly in the interface they know how to operate: spreadsheets.
This means business users can act as their own data analysts, and incorporate BI data directly into their business processes, similar to how reverse ETL functions.
Looker Dashboards: Powerful Business Insight Visualizations
Looker dashboards empower your data-driven teams to access incisive visualizations featuring powerful business insights.
You can build dashboards for your team in Looker, or you can replicate and enhance your BI insights by importing Looker data into Google Sheets. Try Coefficient for free now to pull your Looker data into Google Sheets & Excel in a single click.


