How to Create a Salesforce Dynamic Dashboard in 2025

Far beyond the static confines of traditional dashboards, a Salesforce dynamic dashboard allows you or your team to take the role and view your data as you demand.

This step-by-step guide will unravel how to craft a Salesforce Dynamic Dashboard. 

Whether you’re a Salesforce novice or an experienced user, this guide will walk you through the entire process with the same clarity.

As a bonus, As a bonus, we’ll introduce how Coefficient’s 2-way sync between Salesforce and your spreadsheet can revolutionize your dashboard experience, allowing you to extend visibility and interaction beyond Salesforce, without the extra cost on licenses.

So, let’s start! 

What is a Salesforce Dynamic Dashboard? 

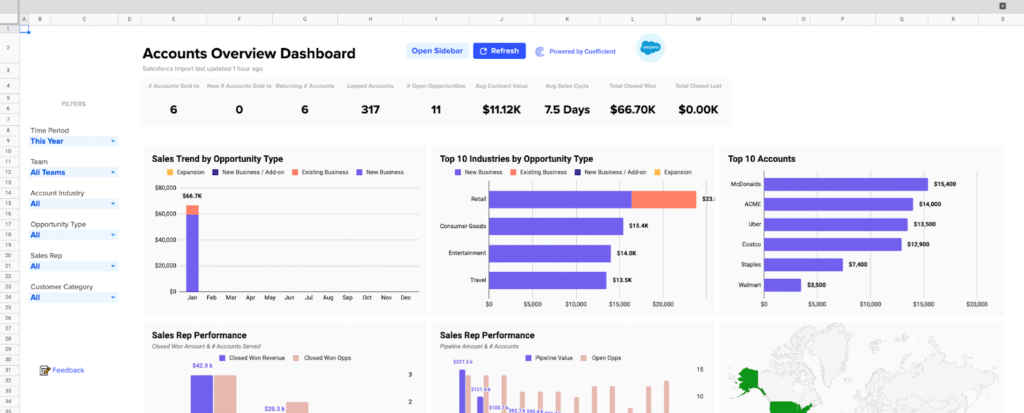
Salesforce dynamic dashboard creation allows users to take on a role of their choice when looking at their insights and data. It empowers users to make data-driven decisions by offering flexibility, interactivity, and the ability to showcase key performance indicators dynamically.

There are many features of a Salesforce dashboard that make it a great part of the platform:

  • Real-Time Data Updates – Dynamic Dashboards pull real-time data from Salesforce, ensuring that the visualizations and metrics are always current.
  • Interactivity – Users can directly interact with the data on the dashboard, such as clicking on charts or applying filters, to tailor the view based on their needs.
  • Customization – Dynamic Dashboards are highly customizable, allowing users to choose from various components and settings to create a personalized and visually appealing dashboard.
  • Collaboration – Dashboards can be shared with team members or stakeholders, promoting collaborative decision-making by providing a unified view of essential metrics.

However, the biggest issue with collaborating on your dashboard is that it’s static, and the person seeing it can only have one role to look at the insights at a time.

But you can change it, so let’s take the first step!

Preparing for Salesforce Dynamic Dashboard Creation

Before diving into the creation process, laying the groundwork for a successful dynamic dashboard is essential. It is also important to note that you don’t actually ‘create’ a dynamic dashboard. Instead, you transform your default dashboard into a dynamic one.

Here are key steps to consider:

  1. User Permissions

Ensure you and your team have the necessary user permissions in Salesforce to view and modify dashboards. Verify that your Salesforce profile includes the required dashboard-related permissions to avoid access issues during creation.

  1. Data Sources

Identify and review the data sources that will feed into your dynamic dashboard. Confirm that the relevant Salesforce reports and datasets are available and up-to-date. Assess the data quality to avoid discrepancies in your visualizations.

  1. Salesforce Dynamic Dashboard Feature

Familiarize yourself with the Salesforce Dynamic Dashboard feature. Understand its capabilities, components, and customization options. This foundational knowledge will empower you to make informed decisions during the dashboard creation.

  1. Clear Objectives and Metrics

Define the objectives of your dynamic dashboard clearly. Identify the key metrics and data points that align with your organizational goals. This clarity will guide your team and yourself to understand when to switch roles and the difference in insights.

  1. Third-party Integrations

Consider integrating third-party apps like Coefficient meant to make your data management in Salesforce dynamic. Coefficient offers a two-way connection between Salesforce and your spreadsheet (Google Sheets or Excel). This connection allows you to bypass any report limitations in Salesforce, share reports with unlicensed users via your native spreadsheet share settings, push data alerts to Slack and email, and more.

5 Steps on How to Create a Dynamic Dashboard in Salesforce 

Follow these step-by-step instructions for a seamless dashboard creation experience:

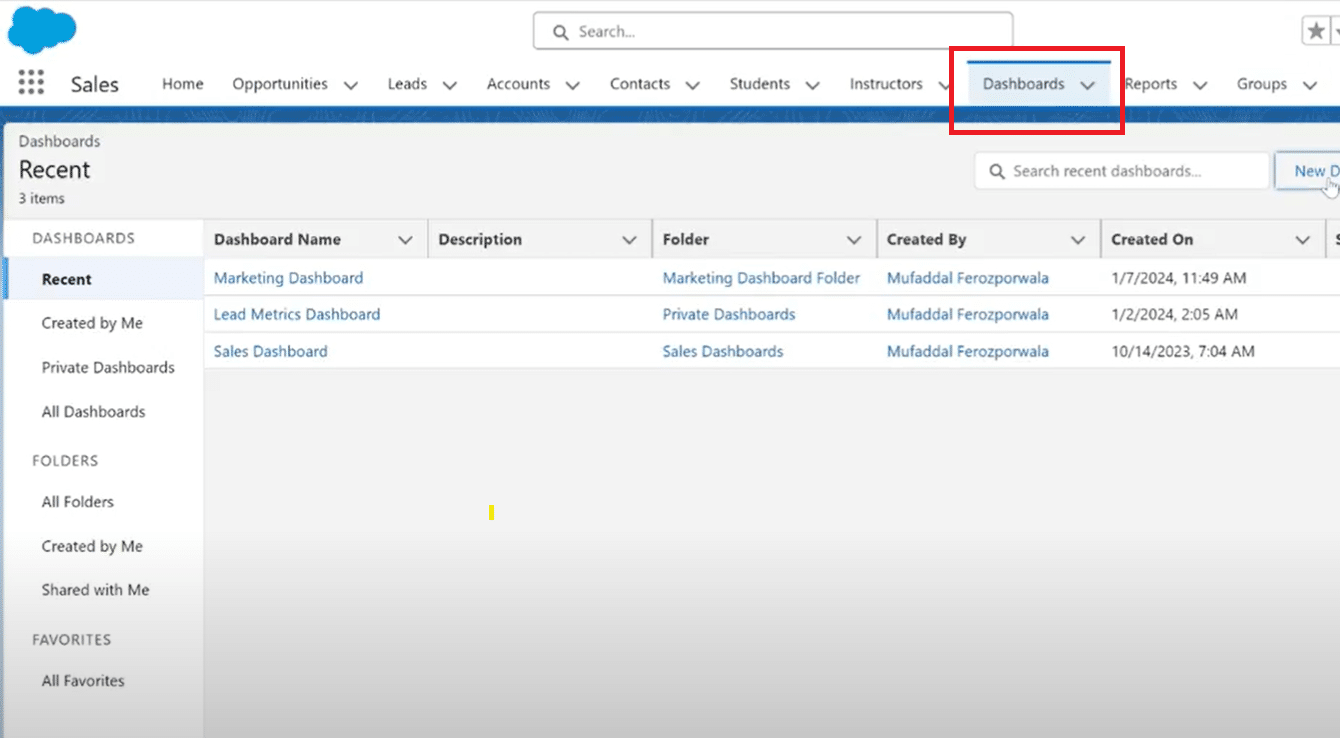
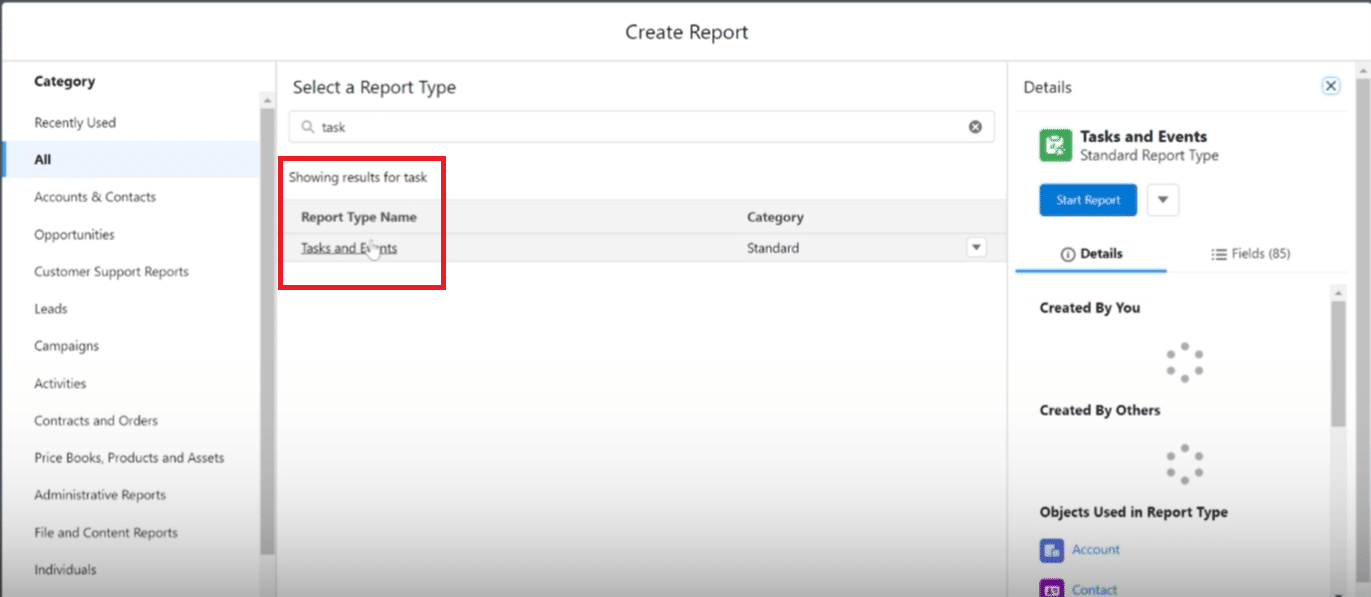
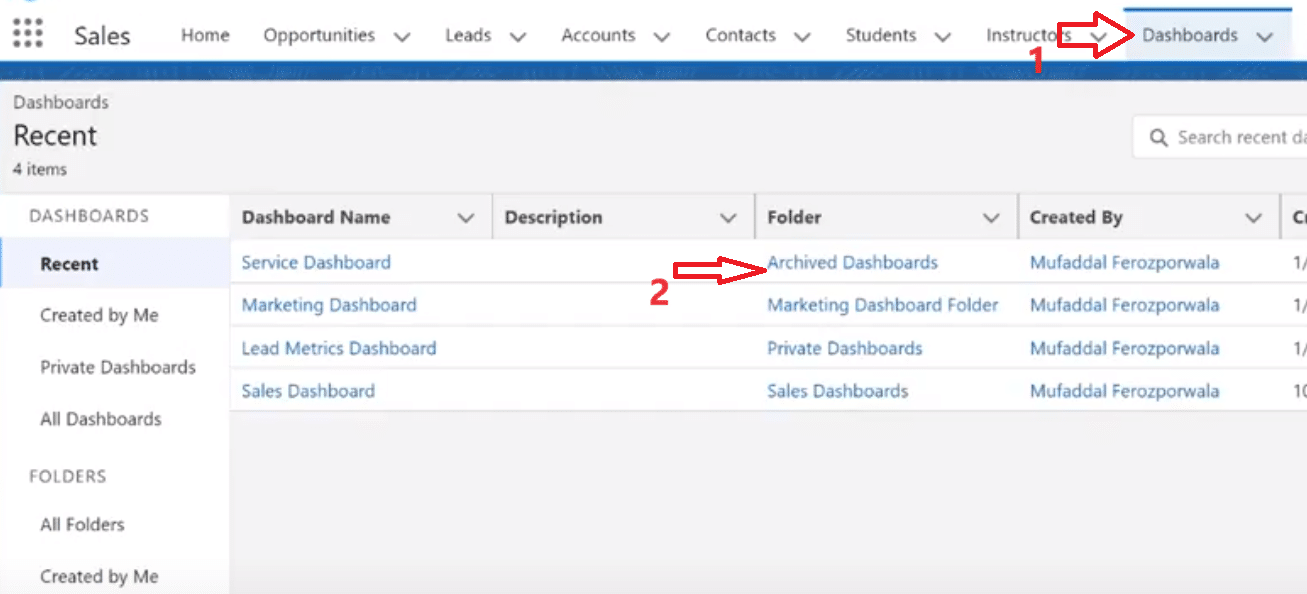
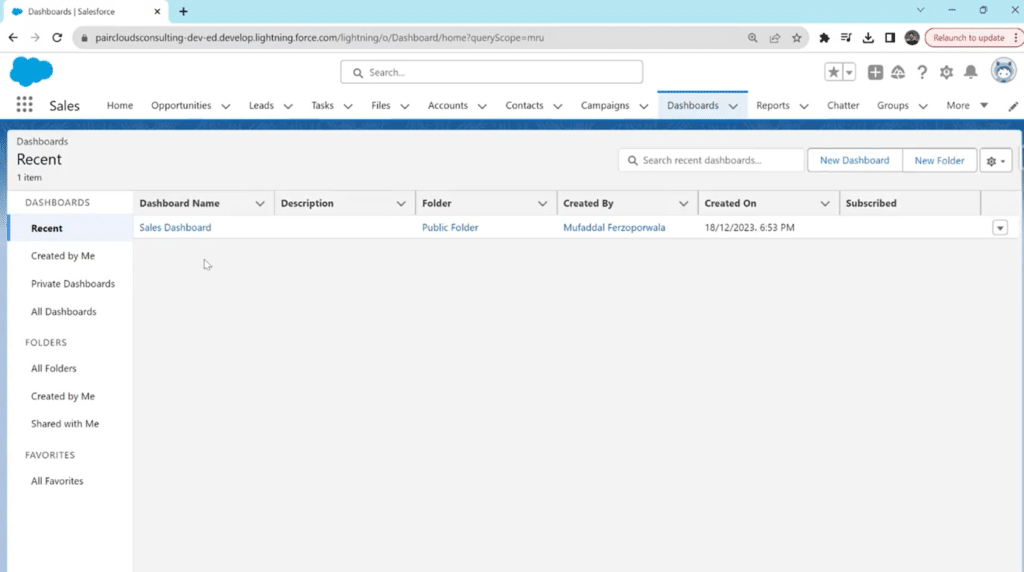
Step 1: Navigate to the Dashboards

Log in to your Salesforce account with valid credentials.

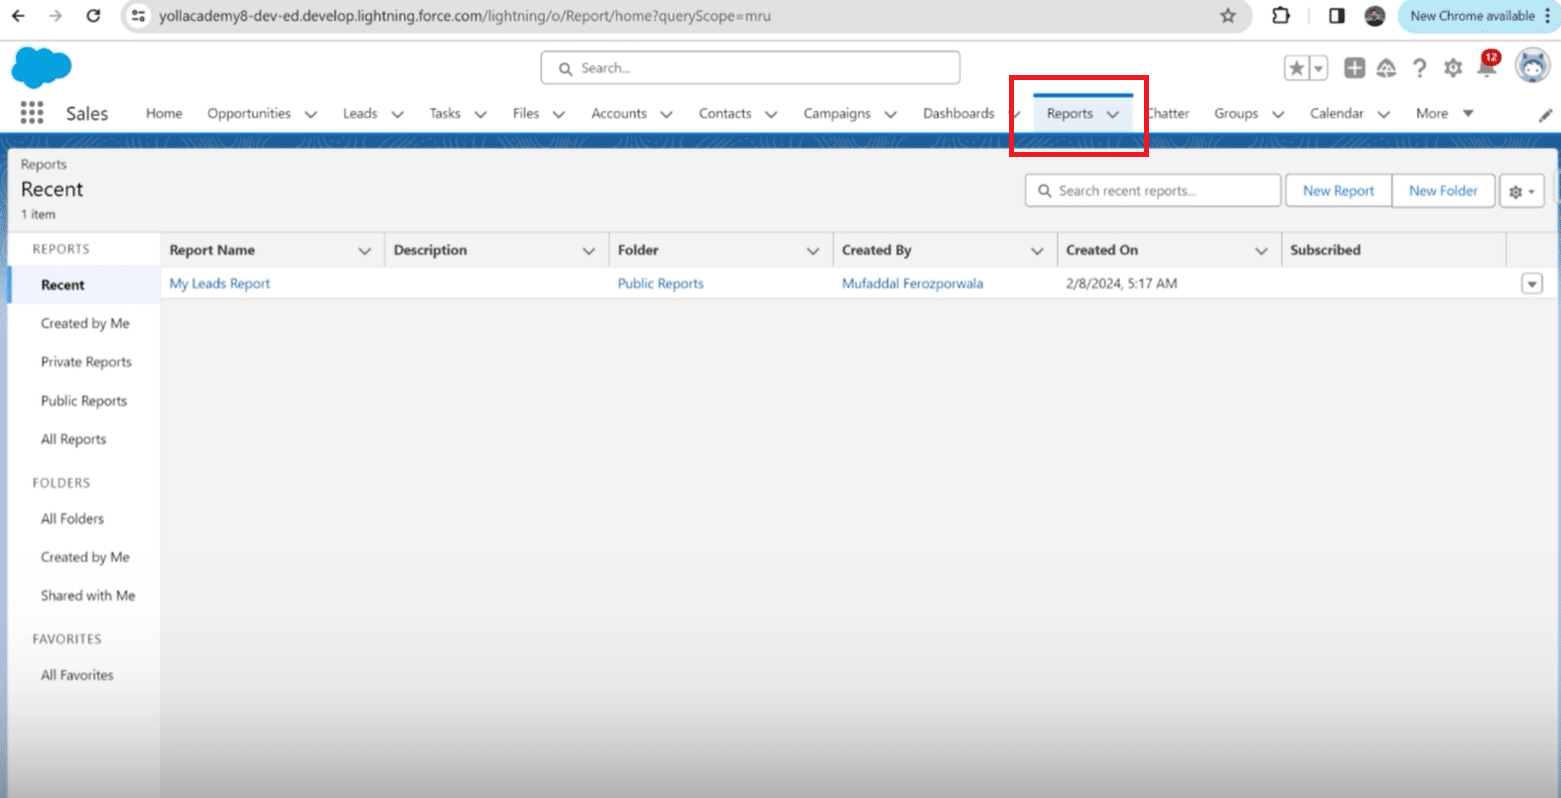
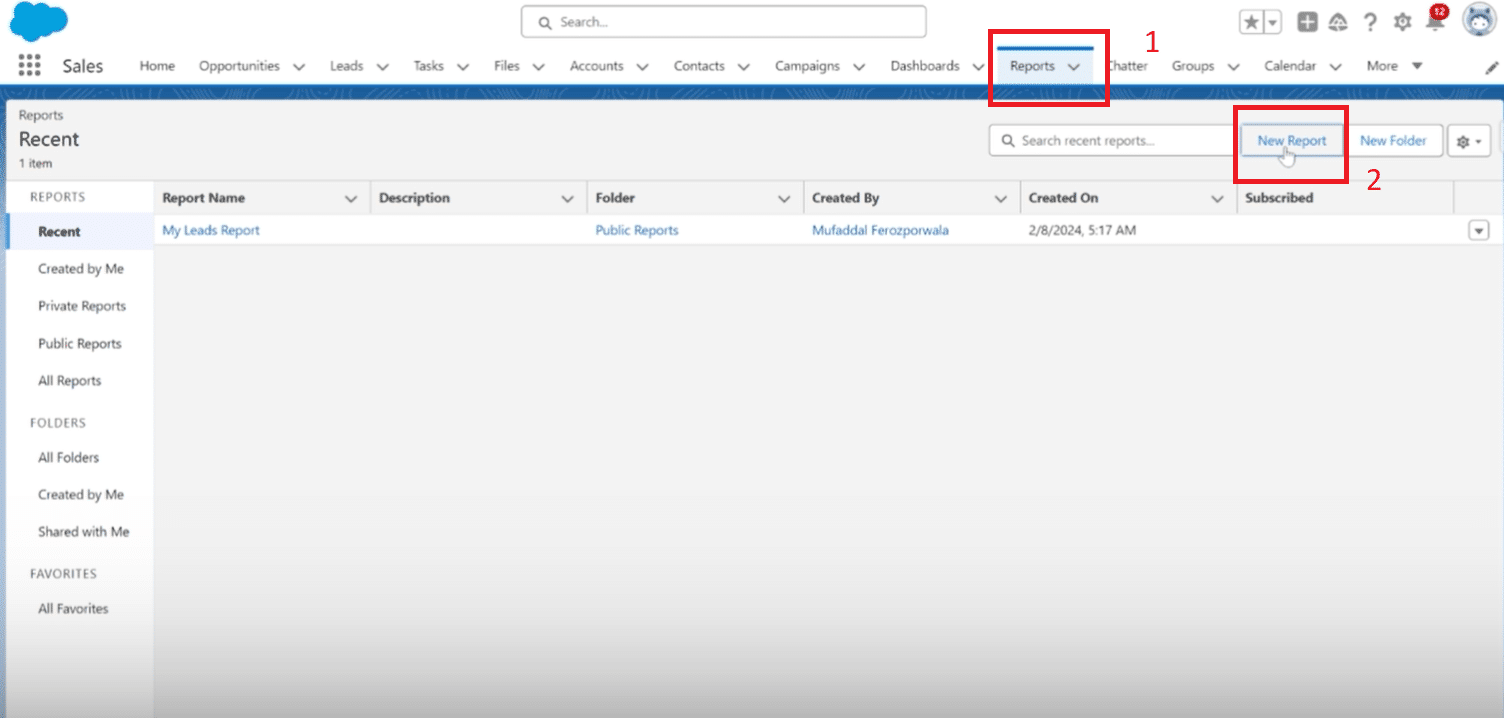
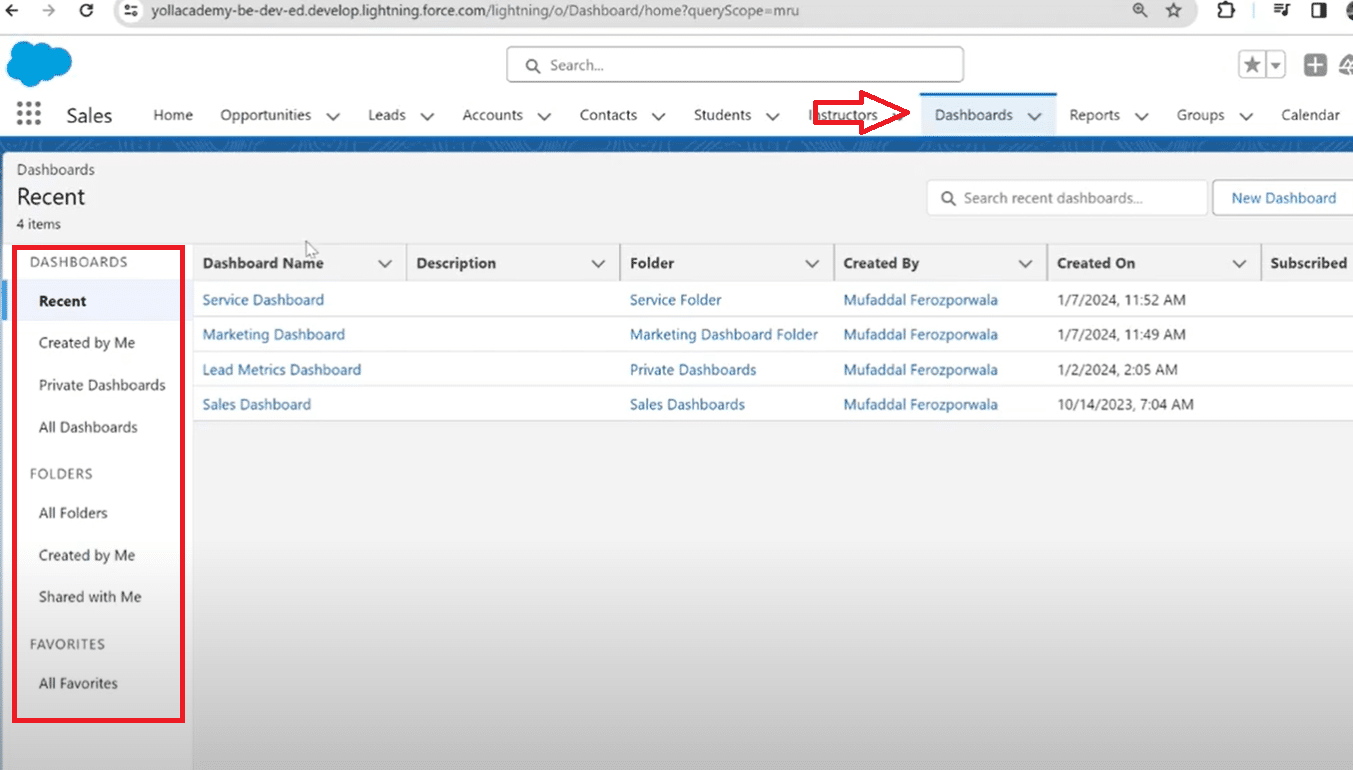
In the top navigation bar, locate the “Dashboards” tab and click to access the Dashboards section.

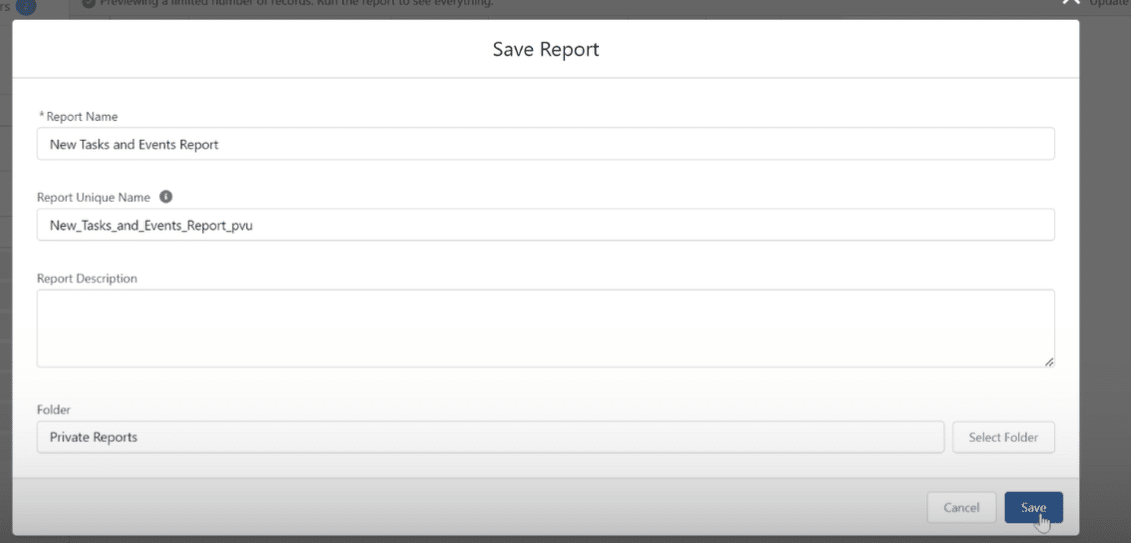
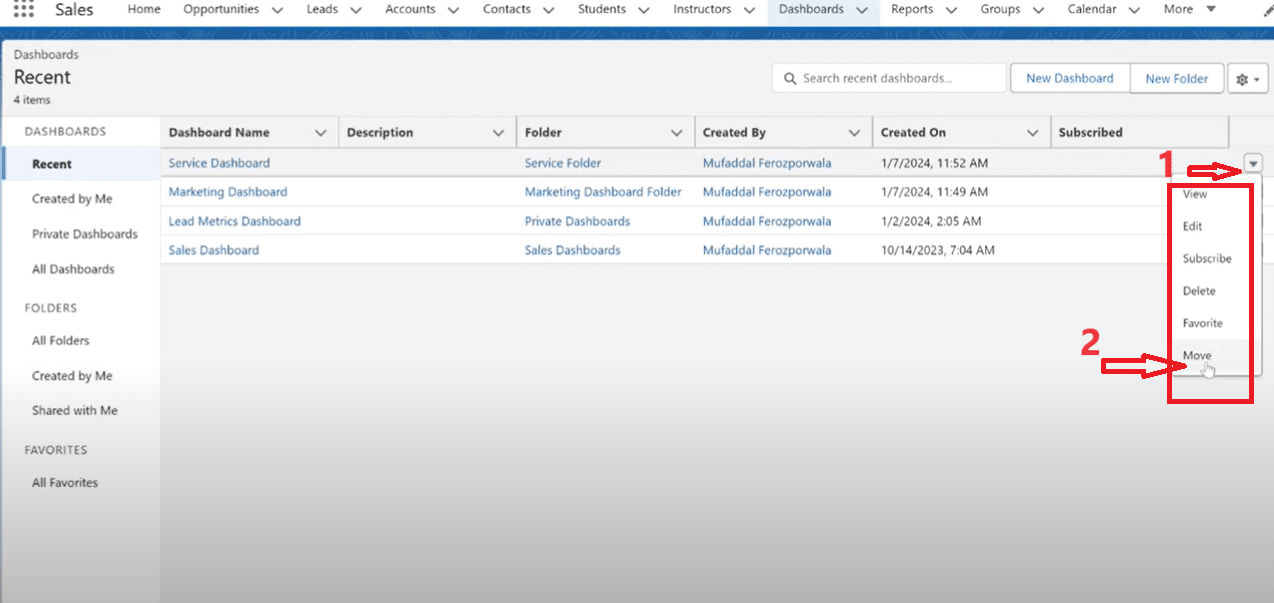
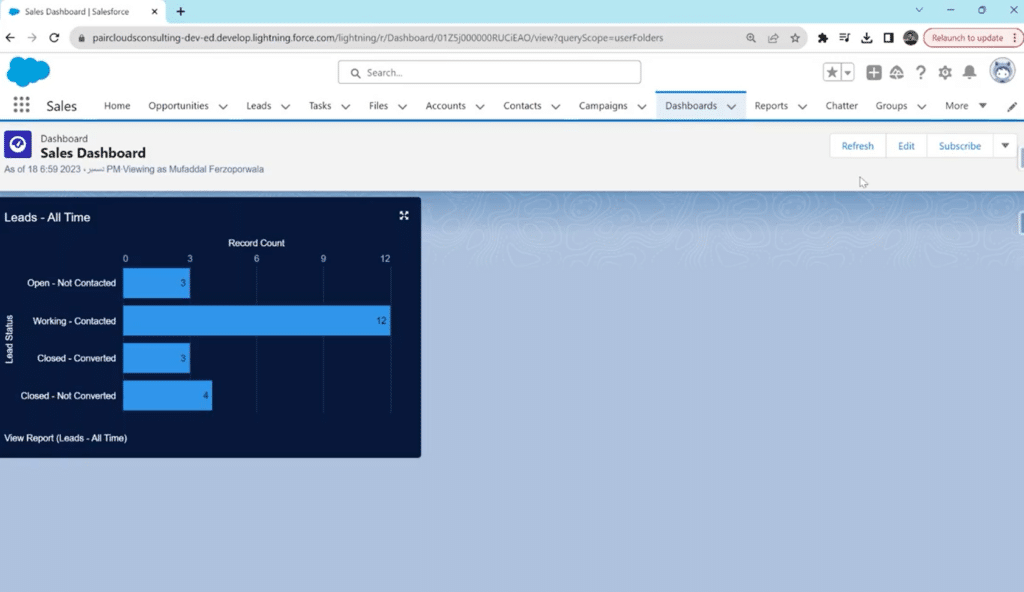
Once it loads, select the dashboard you wish to transform from the list of present dashboards. 

Accessing the Dashboards section via the top navigation bar in Salesforce.

Step 2: Edit and Navigate to Dashboard Settings 

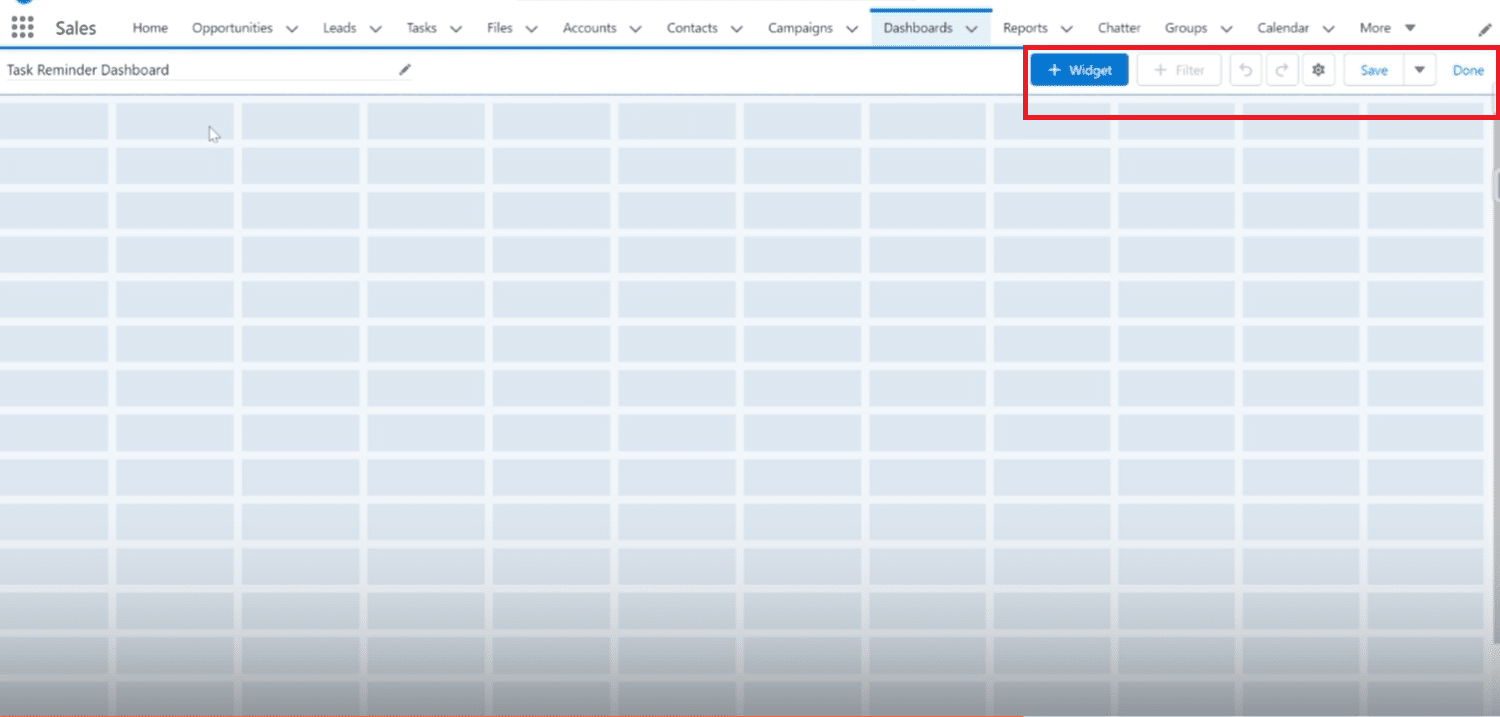
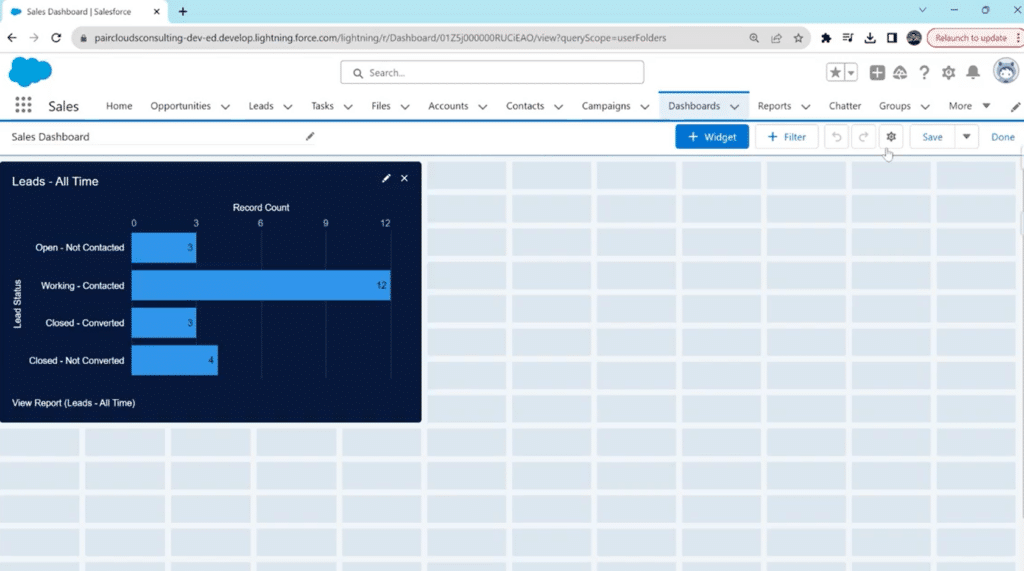
When your selected dashboard loads, navigate to the top right corner and select “Edit.”

Choosing a specific dashboard from the list in the Salesforce Dashboards section.

On the editing page, navigate and click on the Gear Icon to open dashboard settings.

Selecting the 'Edit' option on a loaded Salesforce dashboard.

Step 3: Change ‘View Dashboard As’ Settings

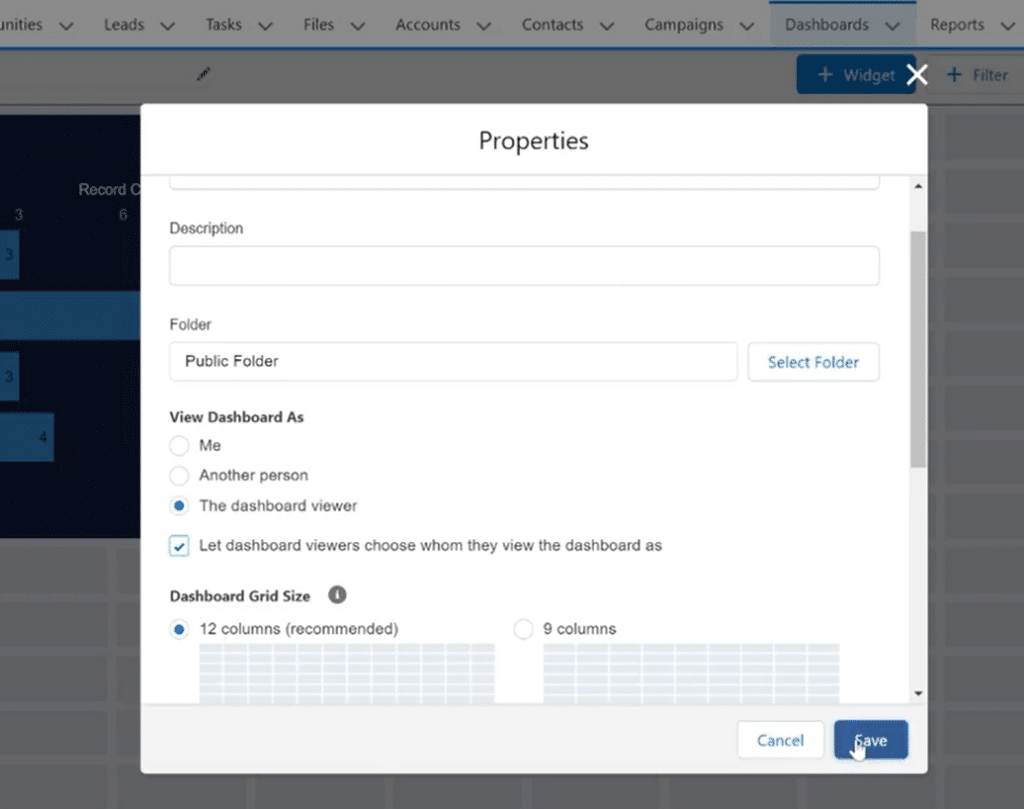
Once you select the Gear Icon, a pop-up window will appear for ‘Properties.’

Scroll down to the “View Dashboard As” section. 

Here, you can see the default option selected is ‘Me.’ 

This means you or any other team member can only view the dashboard as themselves based on the roles assigned to their accounts. This can become inconvenient for a team constantly collaborating and needing to view data insights from a different role, e.g., the owner, the editor, the accounts analyst, etc.

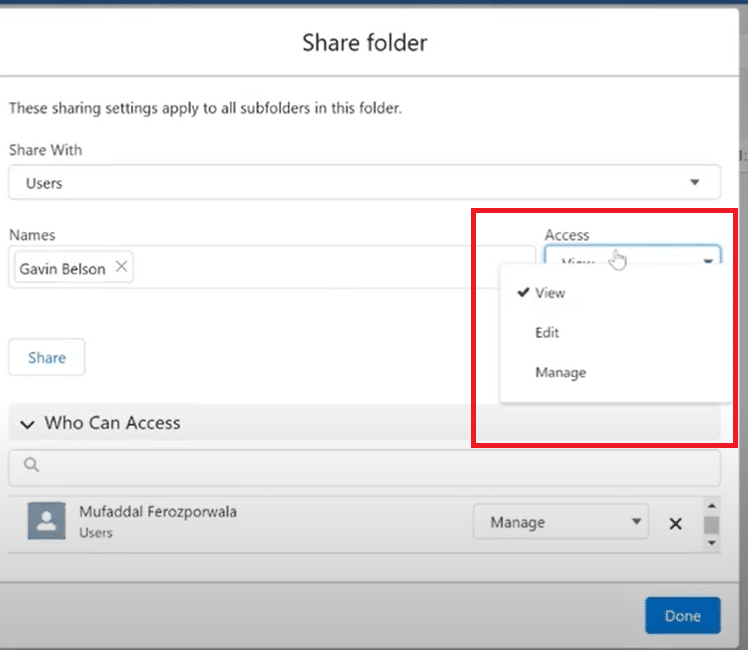
To make your dashboard dynamic, Choose “The Dashboard Viewer” and opt for the checkbox “Let the dashboard viewers choose whom they view the dashboard as.”

Navigating to the Gear Icon to access dashboard settings in Salesforce

This option will allow everyone on your team, including you, to choose the role you want when viewing this dashboard’s data insights. Salesforce will let you change these roles indefinitely and switch between them for different dashboard views.

Click on ‘Save’ to close and save changes to Properties.

Choosing 'The Dashboard Viewer' and enabling dynamic view options in Salesforce dashboard settings

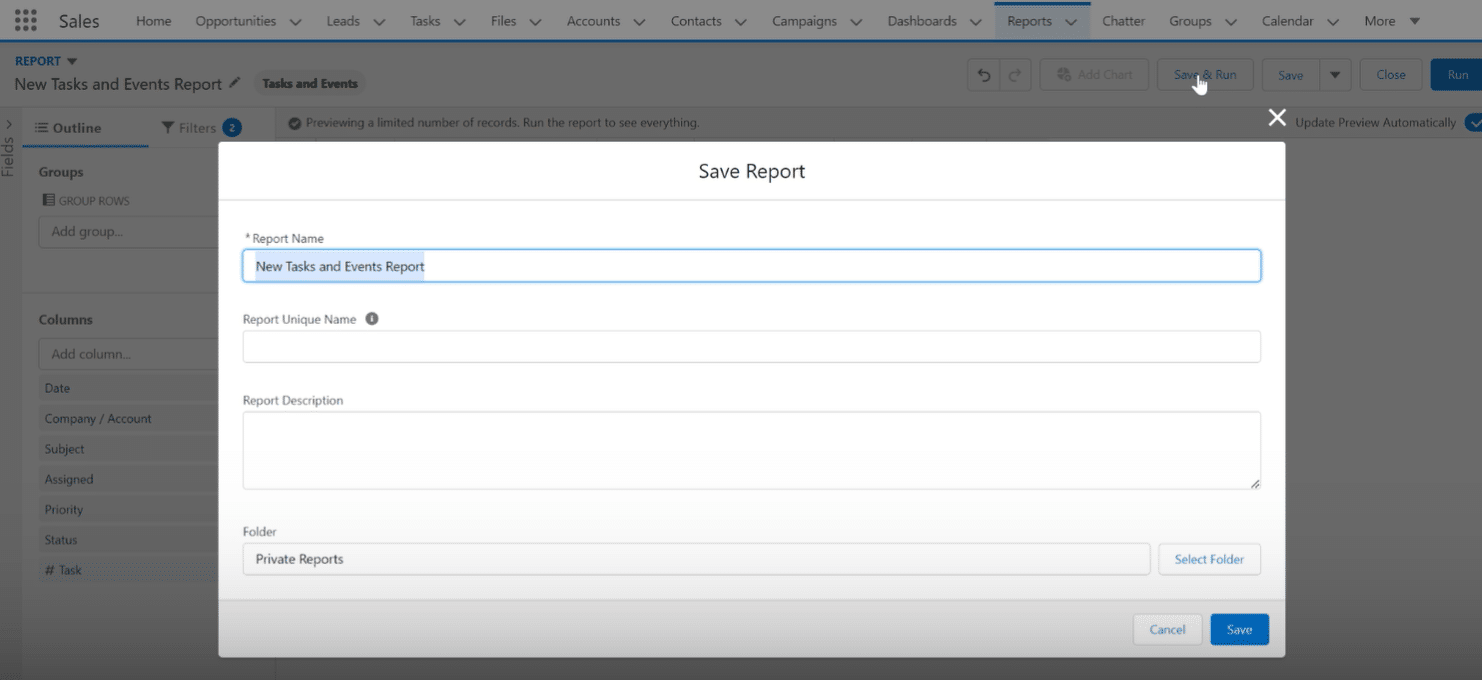
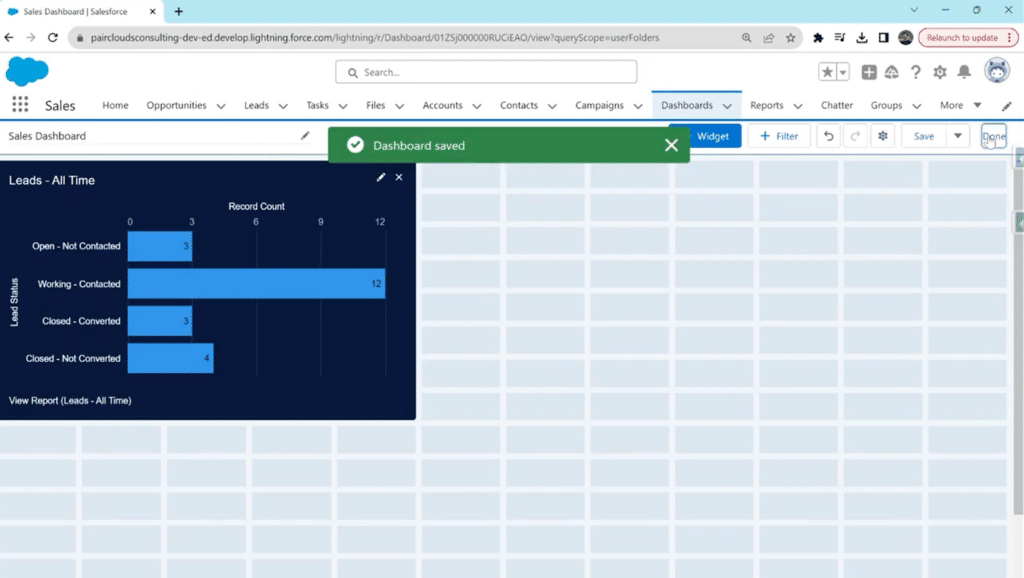
Step 4: Save All Changes

After exiting the pop-up window, Click ‘Save’ again on the top right corner of the main dashboard editing bar.

Saving changes in the dashboard properties by clicking 'Save' in Salesforce.

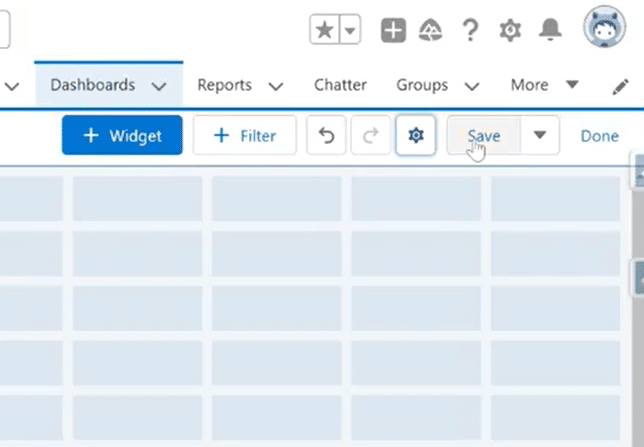
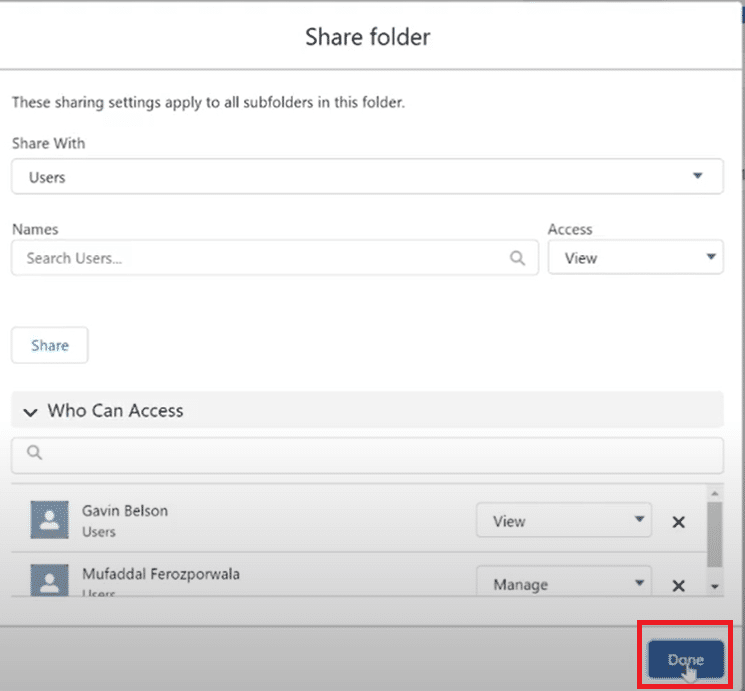
Following that, Click on ‘Done’ to save all changes made and exit the session.

Clicking 'Save' to apply changes made in the Salesforce dashboard editing session.

Step 5: Preview and Test Your Dynamic Dashboard 

Once you’re done, Salesforce will revert to the home panel of Dashboards. The changes you made will be shown later. Make sure you Reload before reviewing changes.

After the page reloads, you can see the option ‘Change’ below the dashboard name ribbon

Clicking 'Done' to exit the dashboard editing mode in Salesforce

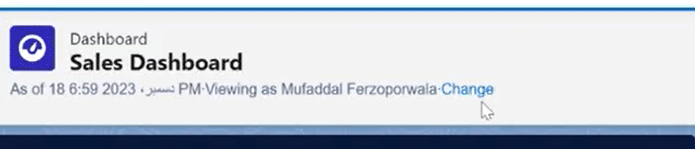
Now, anytime you or one of your team users log in, they can change how they view the dashboard. Simply click ‘Change’ and select the user from the drop-down menu in the pop-up window, and Salesforce will adjust the dashboard accordingly.

Viewing the 'Change' option on the Salesforce dashboard to adjust user views post-reload

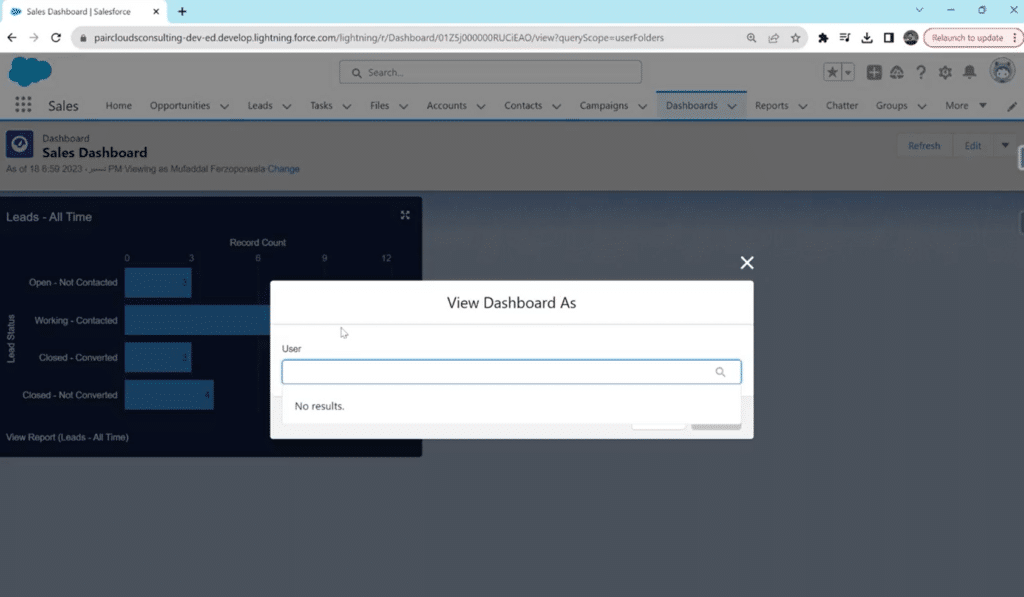
That’s all! Your Salesforce Dashboard has been turned into a dynamic one that will streamline and improve collaboration and data analysis, reporting, and editing.

Integrate Coefficient and Salesforce to Enhance Dynamic Data Management

Elevate your Salesforce dynamic dashboards by seamlessly integrating Salesforce with your spreadsheet using Coefficient, the indispensable companion that transforms data management into a streamlined and collaborative experience.

Let’s delve into the features that make Coefficient’s Salesforce integration with Google Sheets and Excel a game-changer:

  • Always-Live Salesforce Data: With Coefficient, stay in the loop in real-time as your Salesforce data evolves. Sync the Salesforce data or reports you need into Google Sheets or Excel and keep your data import on a refresh schedule.
  • Share Reports Seamlessly: No need to add expensive Salesforce licenses when your team is only viewing reports. Instead, sync your Salesforce reports into your spreadsheet and share your reports with your native spreadsheet share settings.
  • Push Back Data When You Need: Coefficient’s Salesforce spreadsheet connector offers a 2-way sync. Export your data to Salesforce in just a few clicks without ever leaving your spreadsheet.
  • Slack & Email Monitoring: With Coefficient, stay in the loop in real-time as your Salesforce data evolves. Trigger Slack and email alerts when cells change values or meet predefined conditions. This means instant notifications for chosen recipients, ensuring that crucial data changes are promptly communicated to the right stakeholders.
  • Team Notifications: Promote seamless collaboration within your team by automatically delivering notifications via Slack and email. Coefficient allows you to set up real-time, daily, or weekly digests of changes, enabling your team to monitor critical reports and KPIs effortlessly. This shared awareness ensures everyone is on the same page, facilitating informed decision-making.
  • Instant Row Alerts: Act fast on new opportunities or critical changes in your Salesforce data. Coefficient allows you to set up automatic Slack and email alerts that notify your team when a new row is added to a spreadsheet. This instant notification ensures that your team is informed and ready to take action on the latest data entries.

By integrating Coefficient with Salesforce, you will streamline data management and foster a collaborative environment where real-time insights and actionable alerts empower your team to make informed decisions.

4 Tips for Optimizing Dashboard Performance in Salesforce  

Generally, dynamic dashboards are more than just viewing roles and insight directions. There are also some other ways you can optimize and improve your dashboards for better productivity, organizing, and collaboration:

  1. Identify Your Key Metrics

Before diving into the dashboard creation process, pinpoint the key metrics that matter most to your organization. Whether it’s sales revenue, lead conversion rates, customer satisfaction scores, or other vital indicators, these metrics form the foundation of your dashboard. 

Building around these essential elements ensures your dashboard is tailored to deliver meaningful insights.

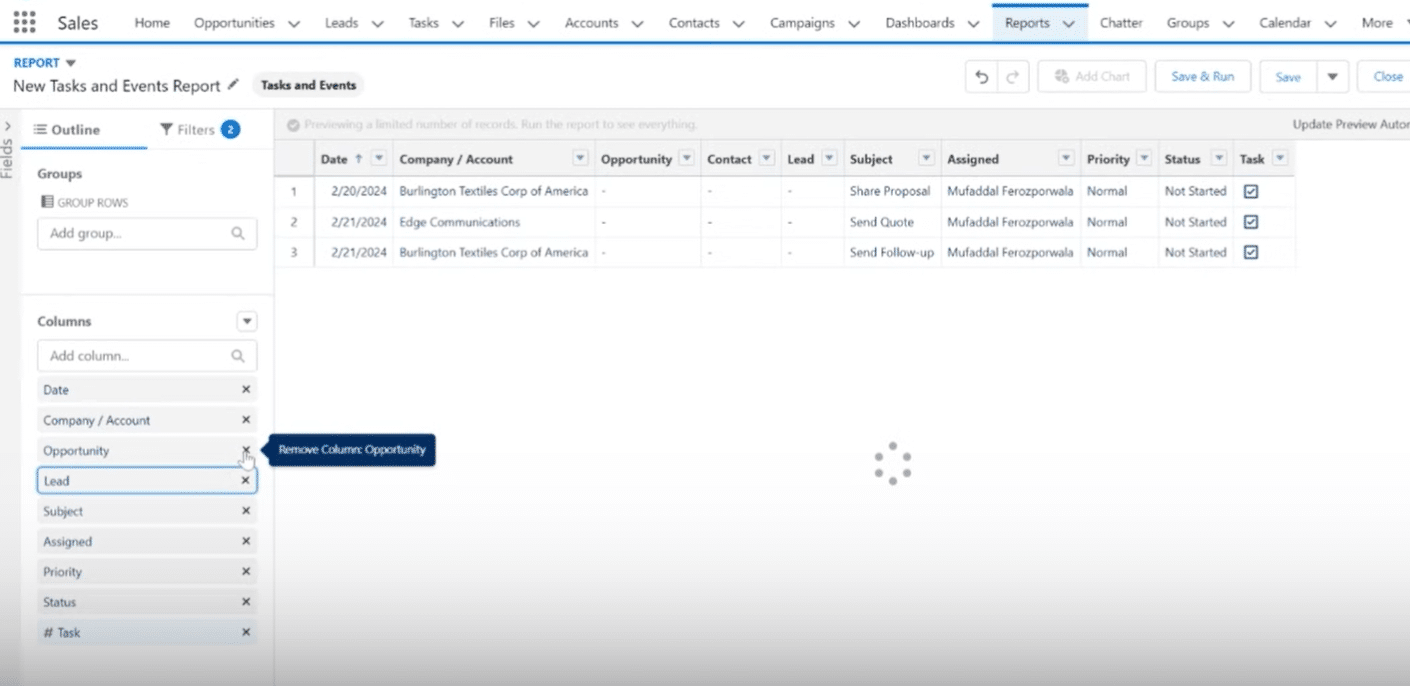
  1. Choose the Right Dashboard Components

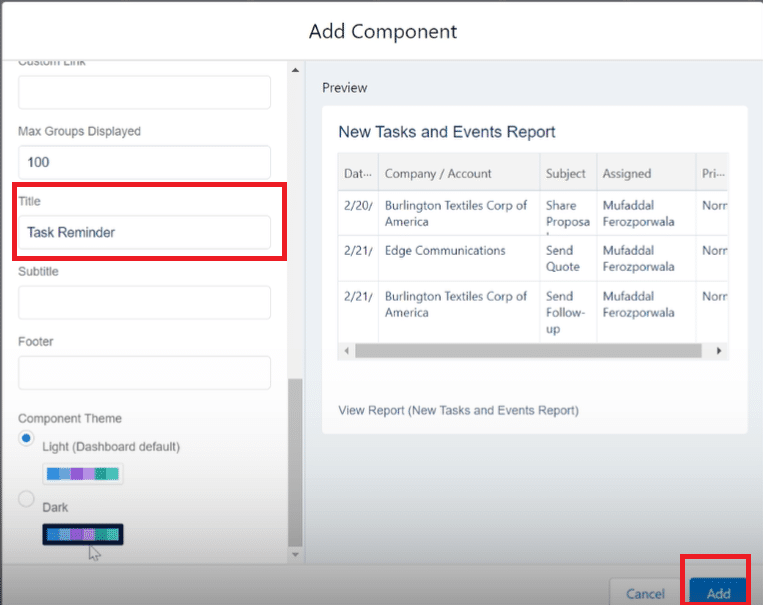
Salesforce provides many dashboard components—charts, tables, gauges, and more. Carefully select components that best represent your data and make it easily digestible for your team. The right components enhance data visibility and comprehension.

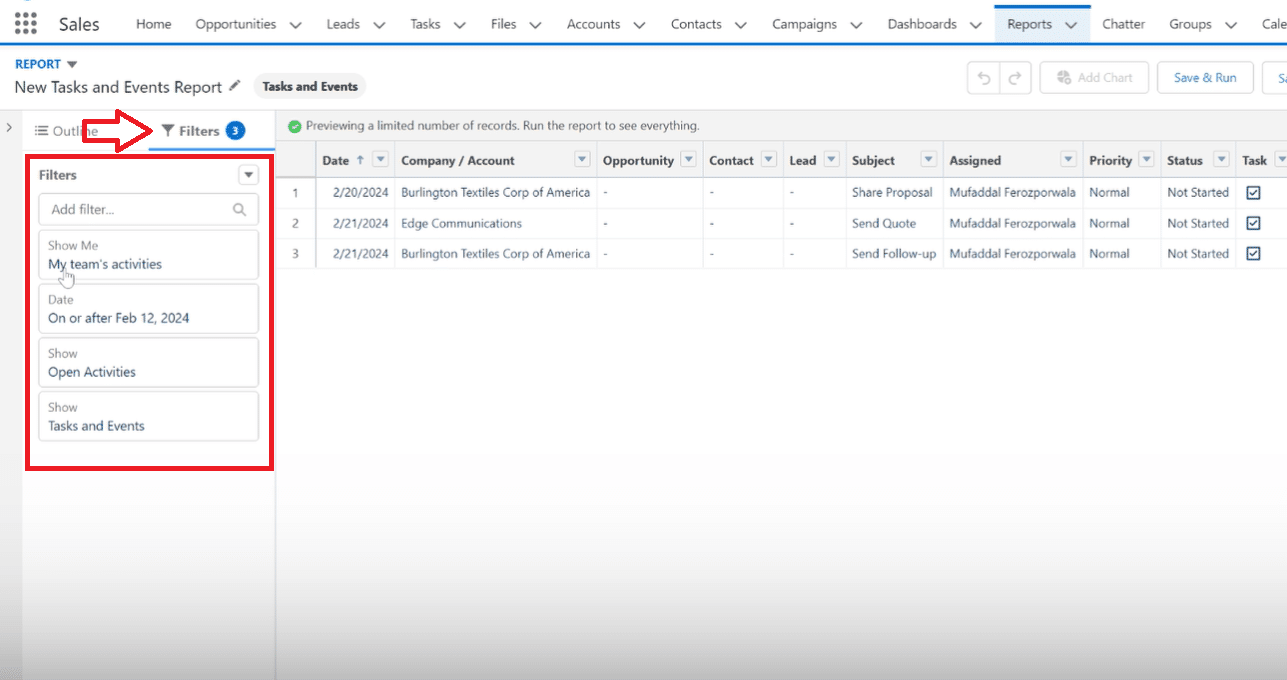
  1. Use Filters to Focus on Specific Data

Harness the power of filters to hone in on specific data within your dashboard. Whether filtering sales data by region or product line, customization ensures your dashboard remains targeted and relevant to distinct teams or individuals within your organization.

  1. Customize Your Dashboard for Different User Groups

Recognize that not all users within your organization require access to the same data. Tailor your dashboard to cater to the unique needs of various user groups. By providing customized views, you empower each team to access the data most pertinent to their responsibilities.

Advanced Features and Tips 

As you create a dynamic dashboard in Salesforce, consider elevating your dashboard creation with these advanced features and best practices. 

  • Dynamic Dashboards in Lightning Experience

Explore the enhanced capabilities of dynamic dashboards in Salesforce Lightning Experience. Lightning Experience introduces interactive features, such as drill-downs and dynamic filters, providing users with a more immersive and intuitive dashboard experience.

  • Cross-Filtering Across Components

Enhance the interactivity of your dynamic dashboard by implementing cross-filtering across components. This feature lets users click on a data point in one chart or table, automatically filtering related components to display pertinent information.

  • Scheduled Refresh for Data Accuracy

Maintain the accuracy of your dynamic dashboard by configuring scheduled data refreshes. Salesforce allows you to set intervals for automatic updates, ensuring that your dashboard reflects the latest data from your Salesforce reports.

By incorporating these advanced features and best practices, you not only enhance the sophistication of your Salesforce Dynamic Dashboard but also create a robust and user-friendly environment for insightful data exploration.

How Can Other Users See My Dashboard in Salesforce

Salesforce dashboards are more than individual tools; they’re a gateway to team collaboration and data-driven decisions.

This guide will walk Salesforce admins and report builders like you through sharing your Salesforce dashboards, ensuring every team member stays informed and aligned.

However, often there are stakeholders that need visibility that may not have a Salesforce license. We’ll introduce Coefficient as an option to share Salesforce reports with your native Google Sheets or Excel share and permissions settings for anyone you require to view, edit, and collaborate seamlessly.

Teams like Miro have used Coefficient for years to give visibility and analytical capabilities to cross-functional stakeholders who don’t have Salesforce, Snowflake, or Looker licenses.

Understanding Salesforce Dashboard Sharing

Dashboard sharing in Salesforce is vital for teamwork, offering benefits like unified data views, quick decision-making, and streamlined communication.

But how do you share a dashboard effectively? Let’s dive in.

Pre-Requisites for Sharing Dashboards

You require some Salesforce permissions and roles to activate the user-sharing dashboard. Here are the essential prerequisites for sharing dashboards on Salesforce:

  • User Permissions and Roles

Ensure your Salesforce setup has the necessary user permissions and roles for sharing. Key permissions include “View Dashboards in Public Folders” and “Create and Customize Dashboards.”

  1. Roles and Hierarchies

In Salesforce, there’s a system that uses roles to control who can see what. Every user has a role. When you share a dashboard, think about the roles of the users you’re sharing it with.

You can set up the dashboard so that different roles see different parts of the information. This way, the right people see what they need based on where they are in the organization.

  1. Dashboard Visibility Settings

Salesforce dashboards have settings to decide who can see them. There are three main settings to know.

  1. Private dashboards are only for the person who made them. If you want to share, the creator has to allow access to others.
  2. Public read-only lets others view but not change the dashboard. It’s good when you want to show information without letting anyone make changes.
  3. Public read/write lets others both view and make changes. This is handy for teamwork when many people need to add or change things on the dashboard.

To bypass these prerequisites within Salesforce, you can simply pull your previously built Salesforce reports into Google Sheets or Excel in just a few clicks with Coefficient and set it on a refresh schedule. Because the report will now be updated live within your spreadsheet, you can lean on your native spreadsheet share settings to share your report amongst your team.

Here’s a quick video walkthrough.

Step-by-Step Guide to Sharing a Salesforce Dashboard

Sharing your Salesforce dashboard is crucial for effective collaboration and ensuring that key insights are accessible to the right stakeholders. Follow this detailed walkthrough to seamlessly share your dashboard with the necessary users within Salesforce.

Step 1: Open Your Salesforce Dashboard

  • Navigate to the Salesforce homepage and log in to your account.
  • Once logged in, locate and open the dashboard you want to share.
  • Click on the dashboard name to enter the dashboard view.
Opening the Salesforce dashboard for configuration

Step 2: Click on the “Share” Button

  • In the upper-right corner of the dashboard, you’ll find the “Share” button.
  • Click on it to access the sharing settings for the dashboard.
Clicking the 'Share' button in Salesforce dashboard

Step 3: Choose Sharing Settings

A new window will appear, allowing you to define the sharing settings.

  • Select “Share Dashboard” and choose the type of access you want to grant: Public Link, Specific Users, or Groups.
  • Adjust the settings according to your collaboration needs.
Choosing sharing settings in Salesforce dashboard

Step 4: Add Specific Users or Groups

  • If you selected “Specific Users” or “Groups,” you can now add the Salesforce users or groups you want to share the dashboard with.
  • Start typing their names, and Salesforce will provide suggestions.
  • Click on the correct suggestion to add them.

Don’t see your stakeholder on the list? Coefficient facilitates seamless sharing with external stakeholders who don’t have Salesforce licenses.

Adding specific users or groups for Salesforce dashboard sharing

Step 5: Define Access Levels

  • For each user or group added, define their access level—Read-Only or Read/Write. 
  • This controls whether they can only view the dashboard or also make changes.
  • Click “Add More” if you need to include additional users or groups.
Defining user and group access levels in Salesforce dashboard

Step 6: Save Changes

  • Once you’ve added all the users or groups and defined their access levels, click “Done” to apply the sharing settings.
  • Your dashboard is now shared with the selected users or groups based on the specified access levels.
Saving the configured sharing settings in Salesforce dashboard

Troubleshooting Common Issues when Sharing Dashboards

Here are the common problems you might encounter while sharing your dashboard on Salesforce and the best solution to troubleshoot them:

Access Denied Issues

  • Issue: Users might encounter “Access Denied” messages when trying to view a shared dashboard.
  • Solution: Confirm that the dashboard’s sharing settings are configured correctly. Check the user’s profile and ensure they have the necessary permissions to access and view dashboards. Alternatively, sync your Salesforce reports into your spreadsheet for free with Coefficient. You can now share with anyone, even those without Salesforce licenses.

Missing User or Group in Sharing Settings

  • Issue: Shared users or groups might not be able to view the dashboard.
  • Solution: Revisit the dashboard’s sharing settings and verify that all intended users or groups are added. Ensure correct spelling and user/group selection. Save changes if modifications are needed.

Incorrect Access Levels

  • Issue: Users may have unintended access levels (Read-Only vs. Read/Write).
  • Solution: Double-check the access levels assigned to each user or group in the sharing settings. Adjust as needed, and remind users to refresh their browsers to apply the changes.
  • Issue: Users may experience difficulties accessing the dashboard through a public link.
  • Solution: Confirm that the public link is generated and accessible. If issues persist, regenerate the link and share it again. Ensure that the sharing settings allow for public link access.

Changes Not Reflecting

  • Issue: Shared users may not see the latest changes made to the dashboard.
  • Solution: Instruct users to refresh their browsers to ensure they are viewing the most recent version of the shared dashboard. Additionally, verify that the dashboard’s running user has the necessary data access for shared users to see updates.

Sharing with Large User Groups

  • Issue: Sharing with a large user group might be inefficient or lead to performance issues.
  • Solution: Consider sharing with smaller user groups or using public links for broader access. Evaluate the impact on performance and adjust sharing methods accordingly.

Advanced Tips and Tricks

Over the years of experience on the Salesforce platform, here are some of the advanced tips and tricks we’ve learnt to make operation easier and faster:

Dynamic Dashboard Filters

  • Tip: Leverage dynamic dashboard filters to allow shared users to interactively filter data based on their preferences.
  • How-to: In the dashboard editor, add a filter component and choose dynamic options. Shared users can then adjust filters without altering the dashboard’s underlying structure. Alternatively, you can simplify this filtering process in your spreadsheet with Filter Views that are much more easily setup and manipulated. Here’s a quick video of the process.

Nested Folders for Hierarchical Access

  • Tip: Organize dashboards into nested folders to create a hierarchical structure for sharing.
  • How-to: Create folders within folders to represent different departments, teams, or projects. Share at the folder level to grant access to all contained dashboards at once.

Utilize Permission Sets for Granular Control

  • Tip: Use Salesforce permission sets to provide granular control over dashboard access.
  • How-to: Assign permission sets to users based on their roles or responsibilities. This allows for more nuanced control beyond profile-based access.

Conclusion

Sharing Salesforce dashboards effectively enhances team collaboration and data-driven decision-making.

As you implement these steps and tips, consider simplifying your Salesforce report sharing experience with Coefficient.

Ready to transform your Salesforce capabilities? Get started with Coefficient today and unlock a new realm of efficiency and insight for your organization.

How Can Reminders in Salesforce Be Shown on a Dashboard

Don’t let important tasks slip through the cracks again. Setting up reminders on your Salesforce dashboard is easier than you think and can significantly boost your productivity.

This guide walks you through the process, from report creation to dashboard customization, ensuring you never miss key tasks again. Let’s dive right in.

Step-by-step guide: How to Show Reminders in a Salesforce Dashboard

Step 1: Navigate to the Reports Tab
Begin by logging into Salesforce and heading over to the Reports tab. It’s crucial to create a report for any data you wish to feature on your dashboard.

 salesforce-reports-tab-navigation

Step 2: Create a New Report
Select “New Report” and choose “Tasks and Events” as your report type, a standard category within Salesforce. Hit the “Start Report” button to proceed.

Creating-new-report-salesforce

Step 3: Filter Your Tasks
Under “Filters”, decide which tasks you’d like to display on the dashboard. Opt for all tasks to get a broad overview or narrow it down based on your preference.

Setting-report-filters-salesforce

You’re aiming to be reminded of tasks due in the near future, so filtering by due date is essential. Set it to show tasks due in the next seven days.

Customizing-report-fields-salesforce

Step 4: Customize Report Fields

Decide which fields or columns are necessary for your reminders. Remove any columns you find unnecessary, keeping only the ones that provide value. Ensure the due date column is visible, as it will indicate when each task is due.

Saving-running-report-salesforce

Step 5: Save and Run the Report

Name your report, something identifiable like “New Tasks and Events Report”, and save it. Now, you’re ready to incorporate this report into the dashboard.

Creating-task-reminder-dashboard-salesforce

Step 6: Create a New Dashboard

Navigate to the Dashboards section and opt to create a new one. Name it appropriately, for instance, “Task Reminder Dashboard”, to easily distinguish its function.

Adding-report-to-dashboard-salesforce

Step 7: Add Your Report as a Reminder Component

Select the Widget, Chart, or Table options to add your newly created report to the dashboard. Choose the report from the list, ensuring it’s set to display tasks by due date in ascending order, to spotlight the most imminent tasks.

Finalizing-task-dashboard-customization-salesforce

Step 8: Customize and Save Your Dashboard


Edit your component title to “Task Reminder”, select a theme, and make any other necessary customizations. Finally, click “Add”, adjust the size as desired, and hit “Save”. You’ve now established a dashboard that will remind you of upcoming tasks.

Image8

Best Practices for Managing Reminders in Salesforce

To maximize the efficiency of your Task Reminder Dashboard, consider these best practices:

  • Regular Update and Review: Make it a habit to review your dashboard daily. Regular interaction ensures you’re always ahead of your tasks and deadlines.
  • Customize According to Your Workflow:Tailor the fields and filters in your reports based on your specific needs. Not every team or individual will prioritize the same data, so adjust as necessary.
  • Optimize for Visibility:Place your Task Reminder Dashboard prominently within your Salesforce setup. You’re more likely to act on your tasks if they’re constantly in view.
  • Utilize Salesforce Notifications: Besides dashboard reminders, leverage Salesforce’s notification system to get alerts on upcoming due dates directly via email or through the Salesforce mobile app.
  • Train Your Team: If you’re managing a team, ensure every member is familiar with the process and the importance of the dashboard. Collective diligence amplifies productivity.
  • Automation Where Possible:Look into automating repetitive tasks or reminders through Salesforce’s built-in automation tools. This can save time and reduce the likelihood of human error.
  • Feedback and Iteration:Solicit feedback from your team or reflect on your usage to identify areas for improvement. Salesforce dashboards and reports are versatile tools that can evolve with your needs.

By implementing these strategies, you’re not just setting up a reminder system; you’re crafting a workflow that bridges proactive task management with efficiency.

Conclusion

With these steps and best practices in mind, your Task Reminder Dashboard will become a cornerstone of your daily routine, ensuring that no task goes unnoticed or deadline missed. For businesses seeking to further streamline their Salesforce experience, consider Coefficient.

This highly acclaimed tool on AppExchange provides seamless integration with Google Sheets and Excel, enabling sophisticated data management and enhancing team efficiency. Discover how Coefficient can transform your Salesforce strategy today by visiting Coefficient. Elevate your productivity to new heights—where efficiency meets innovation.

Get started today for free!

How to Archive Dashboards in Salesforce

In the realm of modern business, managing Salesforce data effectively is pivotal. Dashboards in Salesforce provide a clear picture of vital business data, guiding critical decisions.

As businesses expand, the volume of data and the need for efficient data management strategies become more pronounced.

This is where the concept of data archiving in Salesforce becomes crucial, particularly for Salesforce orgs grappling with storage costs and data overload.

The Importance of Data Archiving in Salesforce

Data archiving is not just about data storage; it’s a strategic approach to managing large data volumes in your Salesforce platform.

By archiving, you systematically store and manage less-used dashboards, ensuring quick access to current and vital information.

This process is integral to maintaining data integrity and data security, especially when dealing with custom objects and sensitive business data.

Why Archive Dashboards in Salesforce?

Archiving is more than a mere data storage technique; it’s a comprehensive data management strategy. It’s crucial for:

  • Improving User Experience: By archiving, Salesforce users navigate less clutter, leading to a more streamlined and efficient user interface.
  • Optimizing System Performance: The archiving process helps in managing storage limits and enhancing system performance.
  • Ensuring Data Security and Compliance: With concerns like GDPR, it’s essential to have robust data retention policies and data protection mechanisms in place.

Step-by-Step Guide to Archiving Dashboards in Salesforce

Archiving dashboards in Salesforce is a strategic way to maintain a clutter-free and efficient environment. Follow this comprehensive step-by-step guide to seamlessly archive dashboards and enhance the overall user experience.

Step 1: Access Your Salesforce Dashboard

  • Log into your Salesforce account and navigate to the dashboard you want to archive, considering your data archiving strategy.
  • Click on the dashboard name to open it.
Accessing Salesforce Dashboard for Archiving

Step 2: Enter the Dashboard Editor

  • In the upper-right corner of the dashboard, locate the “Move” button.
  • Click on it.
Entering Dashboard Editor in Salesforce

Step 3: Select Components for Archiving

  • Identify the components on the dashboard that you want to archive. Choose the components based on data lifecycle, volume of data, and relevance.
  • Hover over a component, and click on the drop-down arrow in the upper-right corner.
  • Select “Archive Component” from the menu.
Selecting Components for Archiving in Salesforce Dashboard

Step 4: View Archived Dashboards

  • To view your archived dashboards, navigate to the Salesforce Home page.
  • In the left sidebar, under the “Dashboards” tab, click on “Archived Dashboards.” 
  • Here, you can access and manage all your archived components.
Viewing Archived Dashboards in Salesforce

For a detailed video walk-through, check out our YouTube Tutorial.

Tips and Best Practices

Every business has unique needs. Tailor your archiving strategy to your specific use case, whether it’s handling large data volumes, maintaining data lifecycle, or customizing page layouts and functionality.

Ensuring data security and governance is paramount. Implementing data governance practices ensures compliance with regulations like GDPR. Regular data protection audits and adherence to data retention policies are essential.

Troubleshooting Common Issues

Here are the common problems you might encounter while archiving your dashboard on Salesforce and the best solution to troubleshoot them:

1. Access Denied Errors

  • Issue: Users may encounter “Access Denied” errors when attempting to archive dashboards.
  • Solution: Ensure that users have the necessary permissions to archive dashboards. Verify their roles and adjust permissions as needed in Salesforce settings.

2. Archived Dashboards Still Visible

  • Issue: Even after archiving, some users might still see the dashboards.
  • Solution: Clear browser cache and refresh the page. If the issue persists, double-check the archiving settings and confirm that the dashboards are properly archived.

3. Performance Issues After Archiving

  • Issue: Some users might experience performance issues after archiving a large number of dashboards.
  • Solution: Optimize dashboard components or consult Salesforce support for large data volume issues.

4. Loss of Data on Archived Dashboards

  • Issue: Users may worry about losing data when archiving dashboards.
  • Solution: Ensure that data backup practices are in place before archiving.

5. Dashboard Dependency Errors

  • Issue: Archiving a dashboard may lead to errors if it is dependent on other components or reports.
  • Solution: Identify dependencies before archiving and update or remove them accordingly. Ensure that all related components are compatible with the archiving process.

6. User Resistance to Change

  • Issue: Users may resist the change of archiving dashboards they are accustomed to.
  • Solution: Provide clear communication about the reasons for archiving and the benefits it brings. Offer training and support to help users adapt to the new system.

Conclusion

Archiving dashboards in Salesforce is a critical step in managing data effectively and optimizing system performance. By incorporating advanced tools like Coefficient, you can further streamline your Salesforce experience. Coefficient enhances data management, user experience, and ensures a more intuitive interface, perfectly aligning with the best practices of Salesforce data archiving.

Unlock the full potential of your Salesforce dashboards and elevate your decision-making processes effortlessly with Coefficient. Explore Coefficient and take your Salesforce data management to the next level.

Salesforce KPI Dashboard Examples: Every Sales Leader must use in 2024

For sales leaders, KPI dashboards allow them to make sense of the sales performance and chart strategy for the sales cycle.

Sales dashboards are often built in Salesforce CRM by the SalesOps team. But the inherent limitations of Salesforce reporting functionalities make it cumbersome for the SalesOps team to create and maintain dashboards.

That’s why many SalesOps turn to the flexibility of spreadsheets to build their Salesforce dashboards.

However, this requires SalesOps to not only build dashboards in their spreadsheets. SalesOps users must also continuously copy-and-paste fresh Salesforce data into their spreadsheets to keep the dashboards up-to-date.

That’s why we built our free dashboard templates for SalesOps. Our templates allow SalesOps to launch pre-built Salesforce dashboards in Google Sheets, powered by real-time data sync automation from their Salesforce CRM.

Here are the top 6 Salesforce KPI dashboards examples for sales leaders, along with pre-built Google Sheets templates for each one.

Accounts Overview Dashboard

Salesforce Accounts Overview Dashboard

Coefficient’s Accounts Overview Dashboard for Google Sheets is a centralized dashboard for all of your customer account metrics. You can dive deep into any of your accounts, and access pre-built visualizations directly in your Google spreadsheet.

The dashboard allows you to monitor activity, track sales rep performance, and win future deals for all of your different customer accounts. See open opportunities, closed lost, closed won timeline, and more.

Download our free Salesforce Account Overview Dashboard below!

Download Salesforce Account Overview Dashboard

Pipeline Creation Dashboard

Salesforce Pipeline Creation Dashboard on Google Sheets

The Salesforce Pipeline Creation Dashboard offers a definitive view of pipeline creation, replete with visualizations, inside your Google spreadsheet. Now you can track how your reps and teams are generating pipe, based on your live Salesforce data, all from your Google spreadsheet.

Monitor critical sales KPIs by day, week, or month, so you can modify sales strategy, augment sales qualified opportunities, and drive more revenue. Download the free Salesforce dashboard below!

Download Salesforce Pipeline Creation Dashboard

Sales Performance KPI Dashboard

Sales Performance Dashboard template
Monitor your sales team’s performance, all within a single view. This Sales Performance Analysis Template allows you to see if and how sales reps are meeting kpis, annual goals, without requiring you to build anything.

Harness charts and graphs to view sales performance by time period, opportunity type, and country. Filter visualizations by year, team, opportunity, and geolocation.

Download Sales Performance KPI Dashboard

Sales Team Leaderboard

Sales Team Dashboard on Google Sheets

Coefficient’s Sales Team Leaderboard encourages friendly competition among your sales reps, leading to more closed deals and higher revenue. View side-by-side comparisons of all your reps for key sales metrics, such as opps created, win rate, new logos, and more. You can also easily toggle between reps, teams, years, and opportunity type.  Download the Salesforce Sales Rep Leaderboard Dashboard now!

Download Salesforce Sales Rep Leaderboard Dashboard

Win-Loss Analysis Dashboard

Win Loss Analysis Dashboard on Google Sheets

The Win-Loss Analysis Dashboard breaks down your winning and losing sales efforts in granular detail, so you can set a victorious strategy in the future. The dashboard leverages your live Salesforce data to create visualizations of win-loss KPIs.

Use this spreadsheet dashboard to monitor how company, team, and individual win rates are impacted by sales efforts. Identify performance trends early to double-down on wins or adjust strategy where you have lower win rates. Generate a clean list of recently lost opportunities and why they failed.

Download our free Win-Loss Template in one click!

Download Win-Loss Analysis Dashboard

Sales Opportunity Dashboard

Salesforce Sales Opportunity Dashboard

You can leverage our Salesforce Sales Opportunity Dashboard to manage the full lifecycle of your sales opportunities. Retain visibility into all stages of your opportunity pipeline by stage, for any month, quarter, or year, past or present. Track key monthly sales KPIs, such as win rate, average deal size, and value of each stage or forecast category.

Download the Salesforce Sales Opportunity Dashboard for free now to streamline your sales opportunities!

Download Salesforce Sales Opportunity Dashboard

Opportunity History Dashboard

Salesforce Opportunity History Dashboard in Google Sheets

It’s difficult to access sales forecast changes in Salesforce. The CRM’s functionality prevents you from easily generating such a report. However, with our Opportunity History Template, you can view sales forecast changes directly inside Google Sheets.

The spreadsheet template measures the impact on your revenue by tracking new sales pipelines, lost opportunities, modified close dates, and upsells. Now you can track your sales pipeline over any time period, isolate opportunities that have changed in value, set custom fiscal periods, record changes to close dates, and much more.

You can launch our free Opportunity History Template in less than a minute. Give it a try!

Download Opportunity History Dashboard

Sales Leader Dashboards: Take the Burden Off Your Plate

Building Salesforce dashboards for sales leaders is a time-consuming process for SalesOps users. However, with our pre-built Google Sheets dashboards, you can reproduce your most valuable Salesforce dashboard directly inside your spreadsheet. The best part is that the dashboards are free – so you can try the ones in this blog or any other in our templates gallery right now!