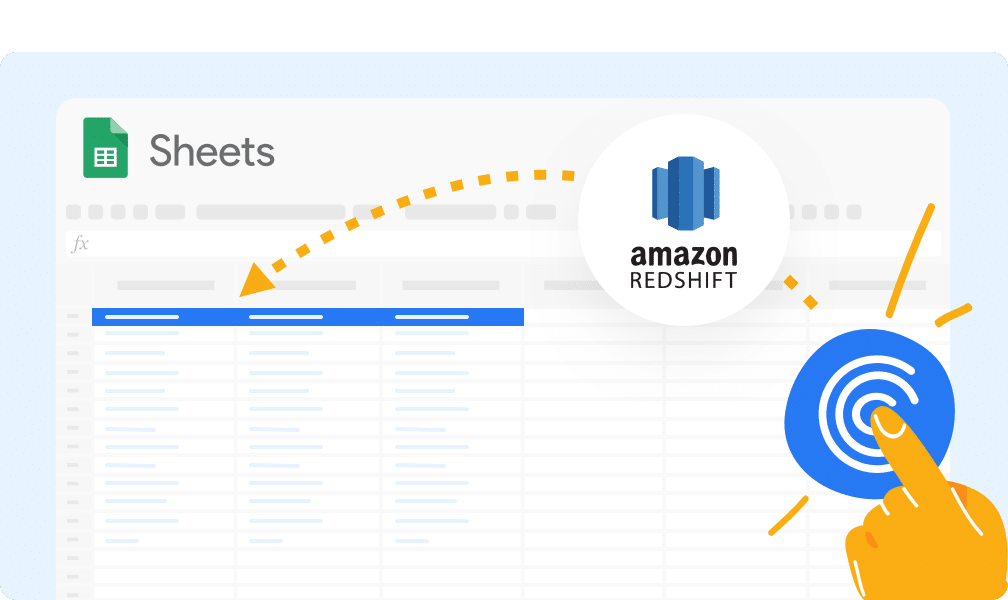
Want to learn how to connect Redshift to Google Sheets? Read the following blog to find out how.
Redshift is a cloud data warehouse by Amazon Web Services (AWS) that stores and transforms massive volumes of structured and unstructured data for analysis. But many SalesOps and RevOps teams prefer to analyze Redshift data in Google Sheets. Not only is Google Sheets more flexible, but business users typically don’t know enough SQL to analyze data in Redshift.
There are many ways to connect Redshift to Google Sheets. Thankfully, we’ve sorted through them all, so you don’t have to. Here are some of the top methods, including step-by-step walkthroughs on how to set them up.
Top methods to connect Redshift to Google Sheets
- Coefficient – Seamless Plug and Play Data Connector
- Zapier – Limited features and high setup effort
- Google Apps Script – Requires Coding Knowledge to setup and maintain
1. Coefficient
Advantages of using Coefficient Data Connector:
- Automated Data Sync: Coefficient automatically pulls your live Redshift data into Google Sheets, and keeps your spreadsheet synced with Redshift in real-time. Non-technical team members can pull data from Redshift using Coefficient’s intuitive data inline previewer.
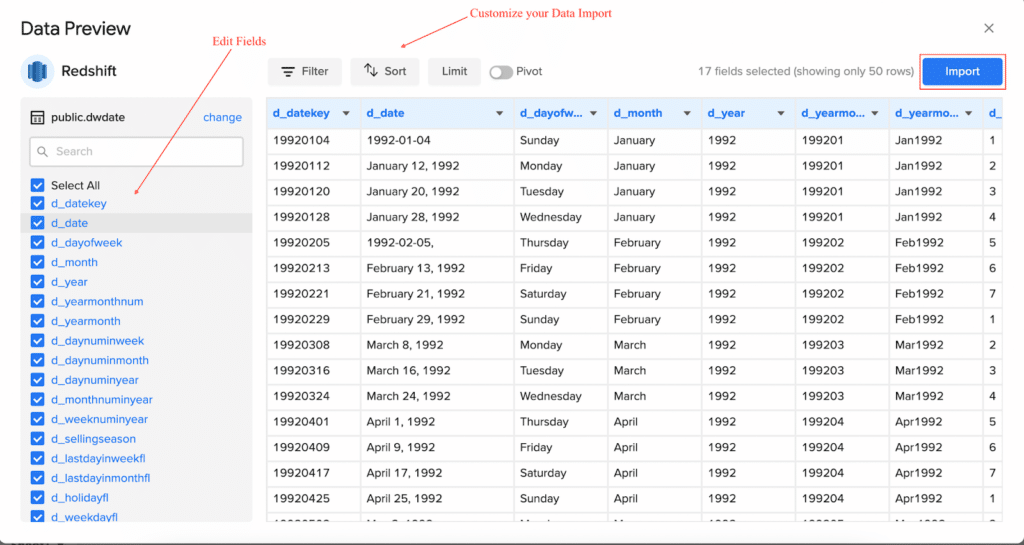
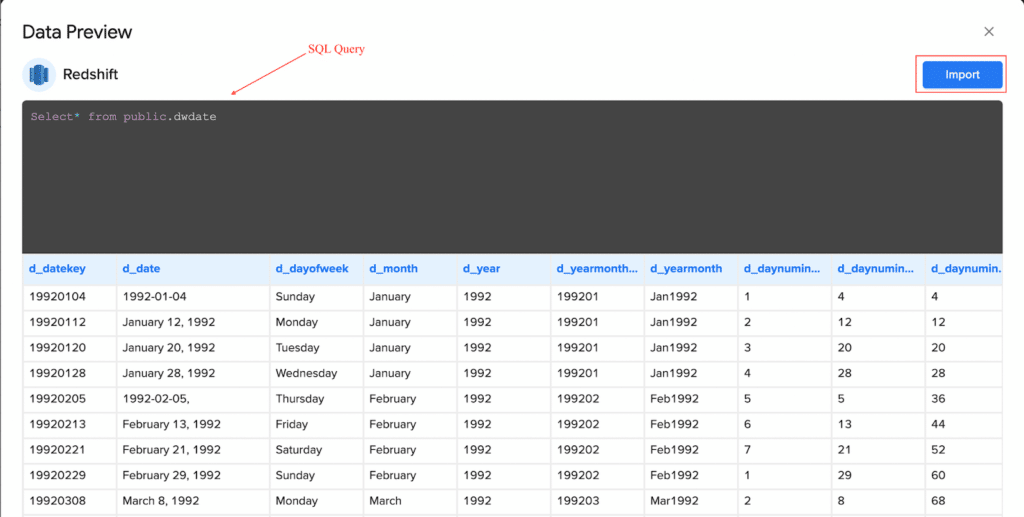
- Custom SQL Queries: Technical users can also conduct custom SQL queries on top of Amazon Redshift, directly from Google Sheets.
- Supercharges your spreadsheets: Coefficient doesn’t just make it easier to connect to Redshift. It also empowers you to expand your analysis and reporting inside Google Sheets. It’s the best fit for non-technical and technical teams alike.
Let’s see the step by step method on how to connect Redshift to Google Sheets,
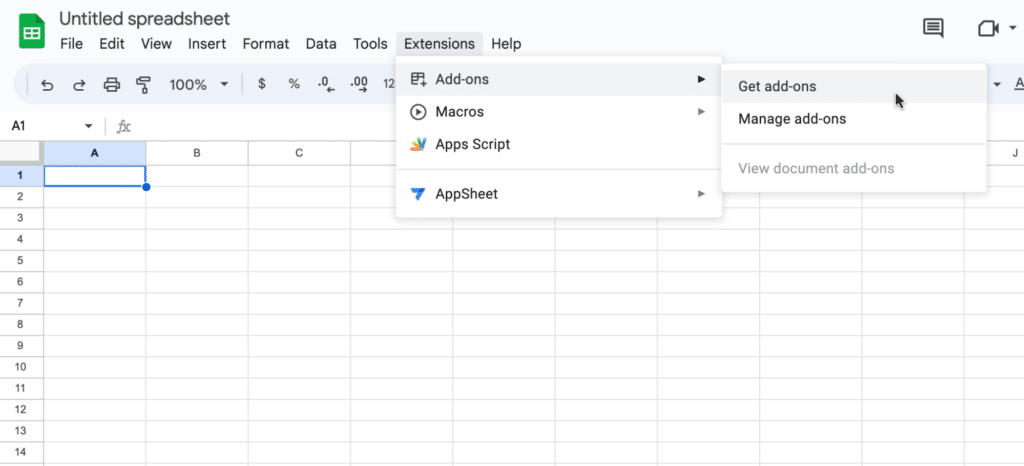
Step 1: Click Extensions on the Google Sheets top menu. Hover your mouse over Add-ons from the dropdown and select Get add-ons to access Google Workspace Marketplace.
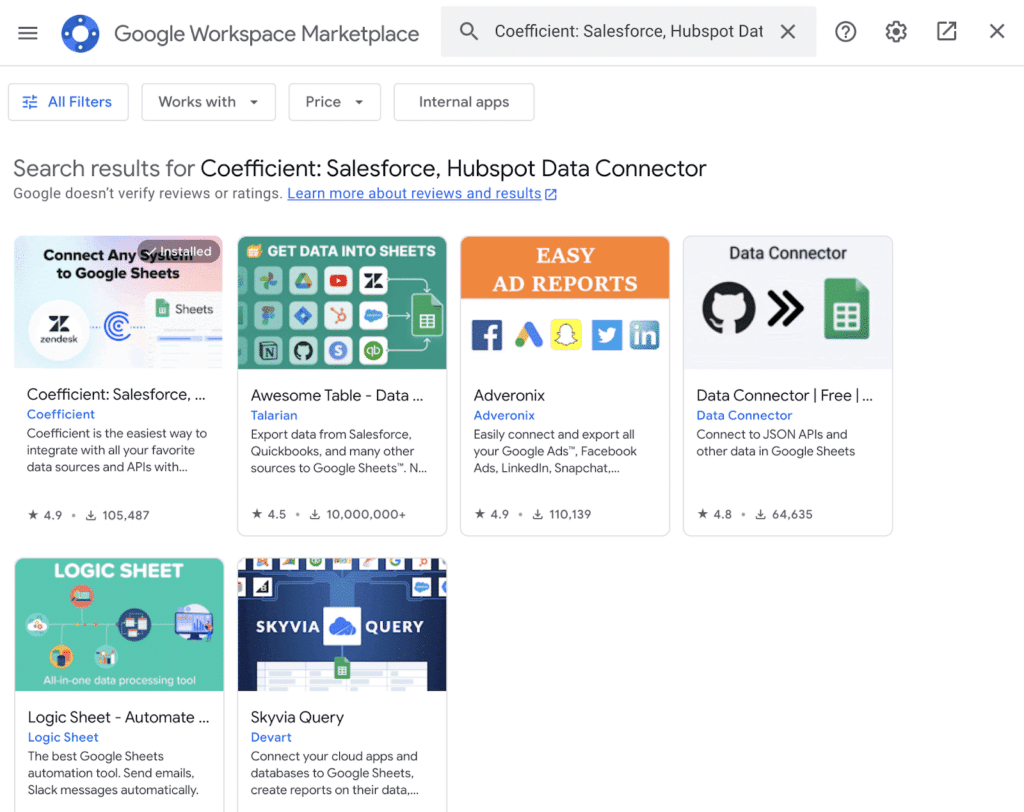
Type “Coefficient” into the search bar and click on the Coefficient app. Follow the prompts to install the app.
Choose the Google account you want to associate with Coefficient. Click Allow to provide Coefficient with the necessary access to install the app.

Once installation is finished, return to Extensions on the Google Sheets menu. Coefficient will appear as an add-on in the menu.
Launch the app. Coefficient will run as a right-hand sidebar on your Google Sheet.
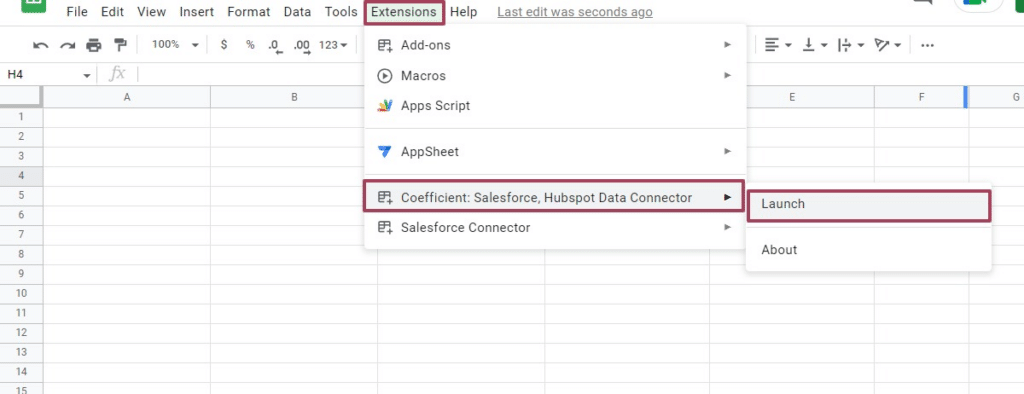
Step 2: Select Import from… on the Coefficient sidebar.

Choose Redshift as your data source.

You can import columns from your Amazon Redshift tables or use a custom SQL query to pull data into your spreadsheet. For this example, let’s import data using the data inline previewer.
Step 3: Click Import from tables.

Next, enter the required credentials to link your Amazon Redshift account to Google Sheets, including the Host, Database Name, Username, Password, Port.
Then click Connect.
Step 4: Select the columns and tables you want to import via the visual data inline previewer.

The data inline previewer’s view-it-and-click-it process allows you to pull data from the Amazon Redshift database into your Google sheet via a GUI. You won’t need to use column identifiers or specific table names.
You can also add row limits and apply key filters to your data imports. Group or pivot your Amazon Redshift data in the cloud. This allows you to avoid ingesting massive amounts of raw data that can make your spreadsheet less performant.
Step 5: Click Import when you’re done. You should see your data auto-populating your Google Sheet within seconds.

Step 6: Coefficient automatically refreshes data to keep your Amazon Redshift data up-to-date in your Google spreadsheet. You can configure your data to auto-refresh hourly, weekly, or monthly.
Coefficient also enables you to refresh data instantly by clicking the Refresh button at the top of your imported dataset.

Finally, keep your team in the loop by setting up Slack and email notifications for important KPIs and reports.
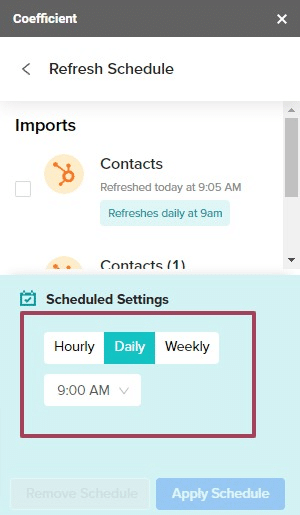
Now your whole team can automatically stay synced.
2. Zapier
You can connect Redshift to Google Sheets with Zapier. Zapier allows you to create workflows called Zaps to connect your applications, in this case Google Sheets and Redshift. Zaps automate repetitive tasks, such as automatically creating a new row in your Sheet when you create a new Amazon Redshift cluster.
Here’s how to integrate Amazon Redshift with Google Sheets using Zaps:
- Authenticate your Amazon Redshift and Google Sheet accounts in Zapier.
- Select Amazon Redshift as the trigger that starts the automated Zap workflow.
- Pick the action in the app that the Zap workflow will perform, in this case, pushing data to Google Sheets.
- Select the Redshift data you want to send to Google Sheets.
- Run the automated Zap workflow to push Redshift data into Google Sheets.
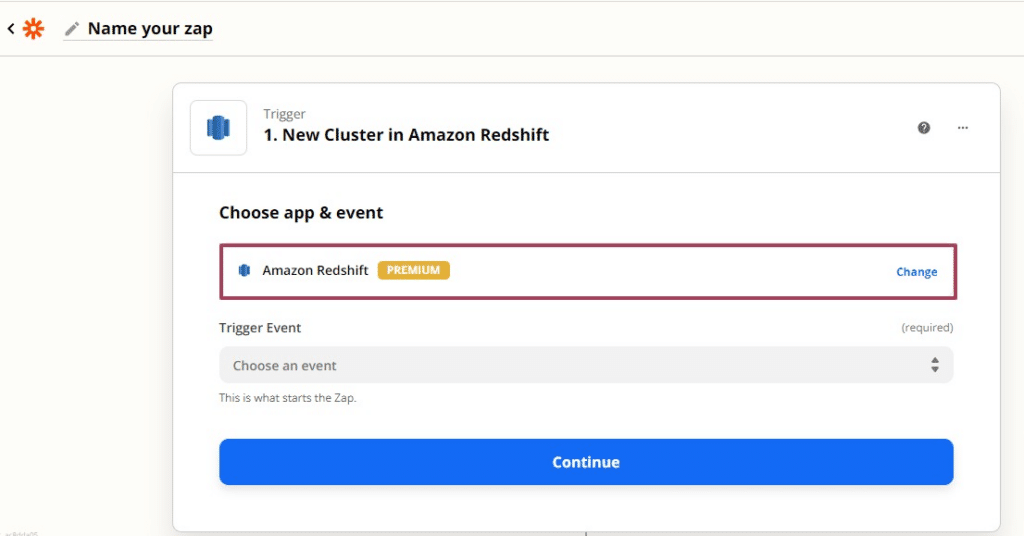
However, Zapier has certain limitations since it can only work based on pre-designed workflows. It can hinder your access to specific datasets and limit your reporting and Amazon Redshift data analytics.
If you want to set up specific automated workflows, you might need to use an Amazon Redshift data API or write some SQL. Connecting more apps and processing more data with Zapier can also cost you more money.
3. Google Apps Script
If you have coding experience, you can use Google Apps Script to connect Redshift to Google Sheets. CData’s SQL Gateway lets you create a MySQL interface for an ODBC driver, including sources such as Redshift.
The MySQL protocol has native support via the JDBC service within Google Apps Script. You can utilize the SQL Gateway to access live data from Amazon Redshift in your Google documents.
With SQL Gateway, your local ODBC data sources can act like a standard MySQL database. You can create a new MySQL remoting service within the SQL Gateway for Amazon Redshift, and then connect the SQL Gateway to hosted SSH servers. Before connecting Reshift to Google Sheets using Apps Script, you must provide the required connection properties within the Data Source Name (DSN).
You can set up the DSN using the built-in Microsoft ODBC Data Source Administrator. Follow these steps to connect to Redshift:
- Set the Port to the cluster’s port.
- Configure the Server to the IP address or hostname of the cluster hosting the database you’re connecting to
- Set your preferred username to authenticate to the Server
- Set the database’s name or leave it blank to use the authenticated user’s default database
- Input the password you will use to authenticate to the server
Get the Port and Server values within the AWS Management Console:
- Open the Amazon Redshift console
- Click the name of the cluster (or Amazon Redshift clusters) on the Clusters page
- Copy the cluster URL from the displayed connection strings under the Configuration tab for the cluster
After you create and enable a MySQL remoting service for your Redshift data, you can connect it to Google Sheets with Apps Script. Access Google Apps Script from the Google Sheets top menu. Select Extension and click Apps Script from the dropdown.
Then, make or declare several class variables that should be available for functions created within the script:
//replace the variables in this block with real values as needed
var address = 'my.server.address:port';
var user = 'SQL_GATEWAY_USER';
var userPwd = 'SQL_GATEWAY_PASSWORD';
var db = 'CData Redshift Sys';


var dbUrl = 'jdbc:mysql://' + address + '/' + db;


				425,000 Pros Sync Live Data from Their Business Systems into Spreadsheet
									Stop exporting data manually. Sync data from your business systems into Google Sheets or Excel with Coefficient and set it on a refresh schedule.

Next, write a function that adds a menu option to your Google sheet. It allows you to call your function using the UI.
function onOpen() {
var spreadsheet = SpreadsheetApp.getActive();
var menuItems = [
{name: 'Write data to a sheet', functionName: 'connectToRedshiftData'}
];
spreadsheet.addMenu('Redshift Data', menuItems);
}
Create a helper function that finds the first empty row within your spreadsheet.
/*
* Finds the first empty row in a spreadsheet by scanning an array of columns
* @return The row number of the first empty row.
*/
function getFirstEmptyRowByColumnArray(spreadSheet, column) {
var column = spreadSheet.getRange(column + ":" + column);
var values = column.getValues(); // get all data in one call
var ct = 0;
while ( values[ct] && values[ct][0] != "" ) {
ct++;
}
return (ct+1);
}
The final step is to create a function to write Redshift data to your spreadsheet. The function uses the JDBC functionality from Apps Script to connect to the MySQL remoting service, and populate the spreadsheet.
After running the script, provide the name of the Sheet holding the data alongside the Redshift table to read. The function is intended mainly as a menu option, but you can extend its use as a spreadsheet formula if you have the technical skills.
Once you complete the function, your Redshift data will populate in your spreadsheet.
While Google Apps Script is a potential option, it also has several limitations. Non-technical users cannot leverage this method at all. Also, maintaining and debugging the GAS function is often challenging even for those with coding proficiency. Pre-built connectors are often a more practical option.
Redshift to Google Sheets: What’s the Best Method for You?
The methods for connecting Redshift to Google Sheets span the spectrum, from one-click integrations to code-based functions. The choice you make will depend on your own team’s priorities. But among the options, Coefficient offers the fastest and easiest method for connecting Redshift to Google Sheets.
Try Coefficient for free, with no credit card required, to unlock the full potential of your Redshift data using the flexibility of spreadsheets.
