
Testimonial

"Coefficient's Google Sheets templates are the next step in spreadsheet evolution–connected spreadsheets. Connected sheets mean faster, better, and more accurate analysis by everyone–especially if you can't code!"
Evan Cover
Director, BI Engineering and Governance, Klaviyo
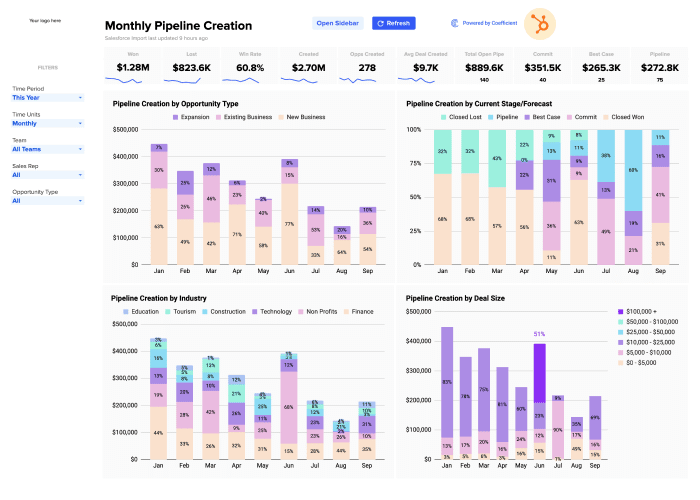
Free, pre-built HubSpot Pipeline Analysis Dashboard
Help your sales team celebrate their hard work by sharing results on year-over-year growth. Get started in seconds with a dashboard that helps you better understand core sales operations metrics. Compare monthly results for pipeline creation, win rates, average deal age, average deal size, and sales velocity. Easily filter your data by sales team, time period or deal type.
This Pipeline Analysis Dashboard will help you:
- Automatically populate this dashboard with live data from your HubSpot CRM
- Measure and track key indicators, such as Pipeline Creation, Sales Conversions, and Sales Velocity
- Slice and dice your sales results by team, deal type and other filters
- Instantly gain insights into your top performing teams, regions, industries and accounts