Testimonial

"Coefficient's Google Sheets templates are the next step in spreadsheet evolution–connected spreadsheets. Connected sheets mean faster, better, and more accurate analysis by everyone–especially if you can't code!"
Evan Cover
Director, BI Engineering and Governance, Klaviyo
Smash Sales Goals with 360° View of Pipeline Creation
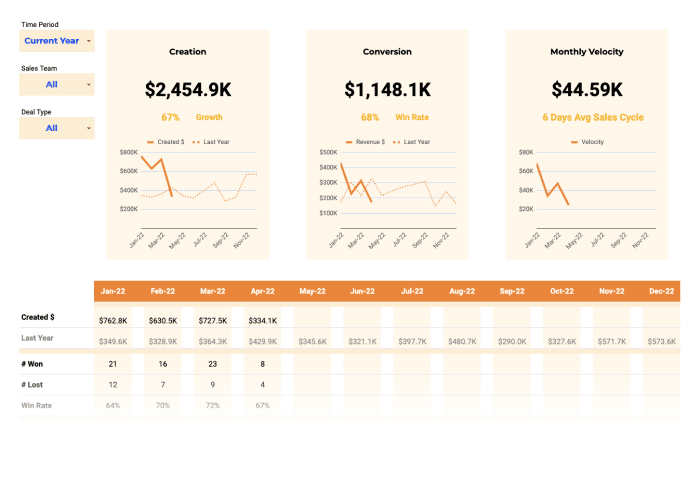
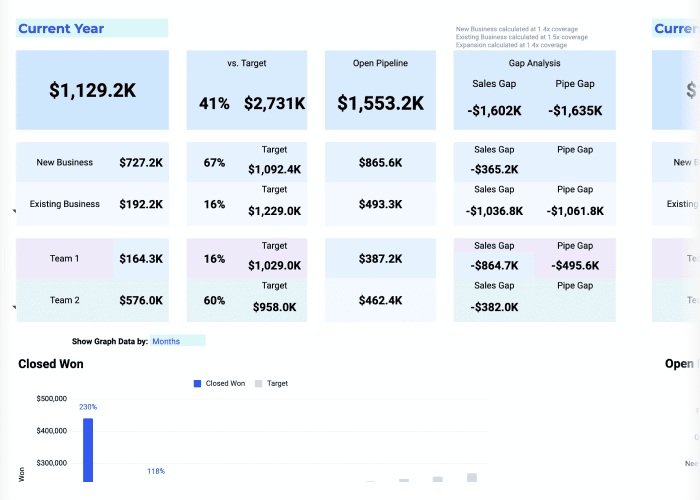
Harness a 360° view of pipeline creation, directly from Google Sheets, in a single click. Visualize key pipeline creation metrics by day, week or month, so you can adjust prospecting tactics, create a surplus of opportunities, and smash sales goals.
Pipeline Creation Dashboard keeps you on track:
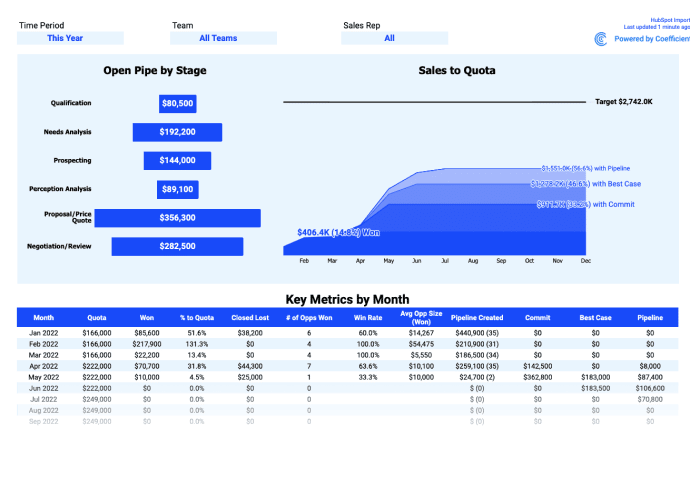
- Visualize all the core metrics of pipeline creation with pre-built dashboards, by team or by sales rep.
- Track pipeline creation by opp type, industry, deal stage, source, and other critical segments.
- Monitor overall pipeline performance, including win rate, opps created, closed won/lost, and more.
- Automatically connect to real-time data in HubSpot to access fresh metrics.