
- Excel
- Google Analytics
- Google Sheets
- Marketing
GA4 Website Performance Dashboard. Build Yours in Minutes
Describe what you want in plain English. Coefficient turns your spreadsheet data into a live, shareable BI-Quality dashboard where every number traces back to the source.
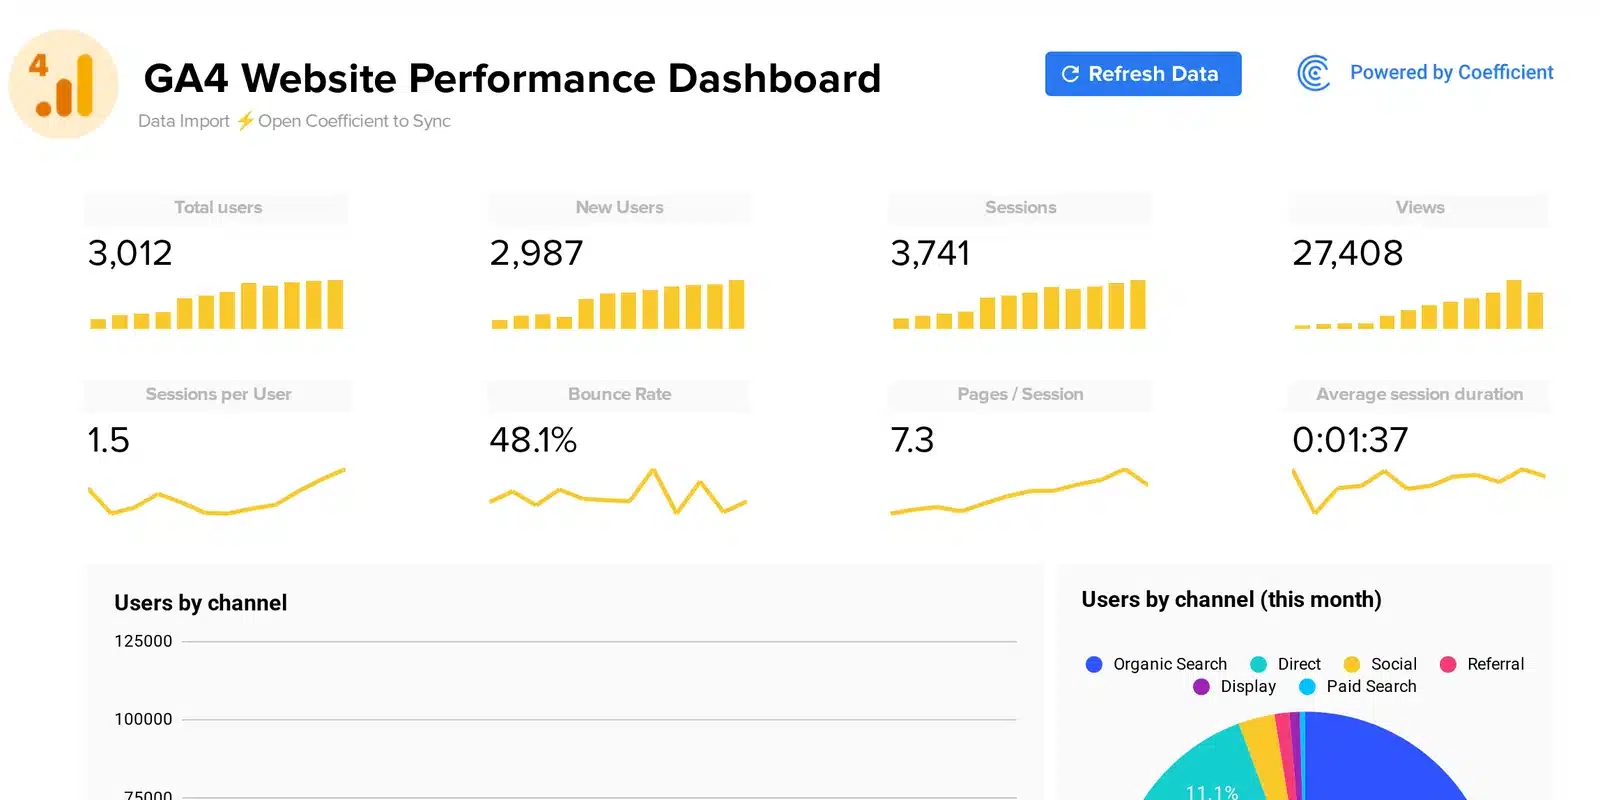
Free GA4 Website Performance Template for Google Sheets
Not ready to build with AI?
Start from the pre-built Google Sheets template.
Connect GA4 with Coefficient and pull your website data directly into the template seamlessly.
How to build Website Performance Dashboard with Coefficient AI
No BI tool, no SQL and no data team. If you can describe the report, you can build it.
Connect
Describe
Share
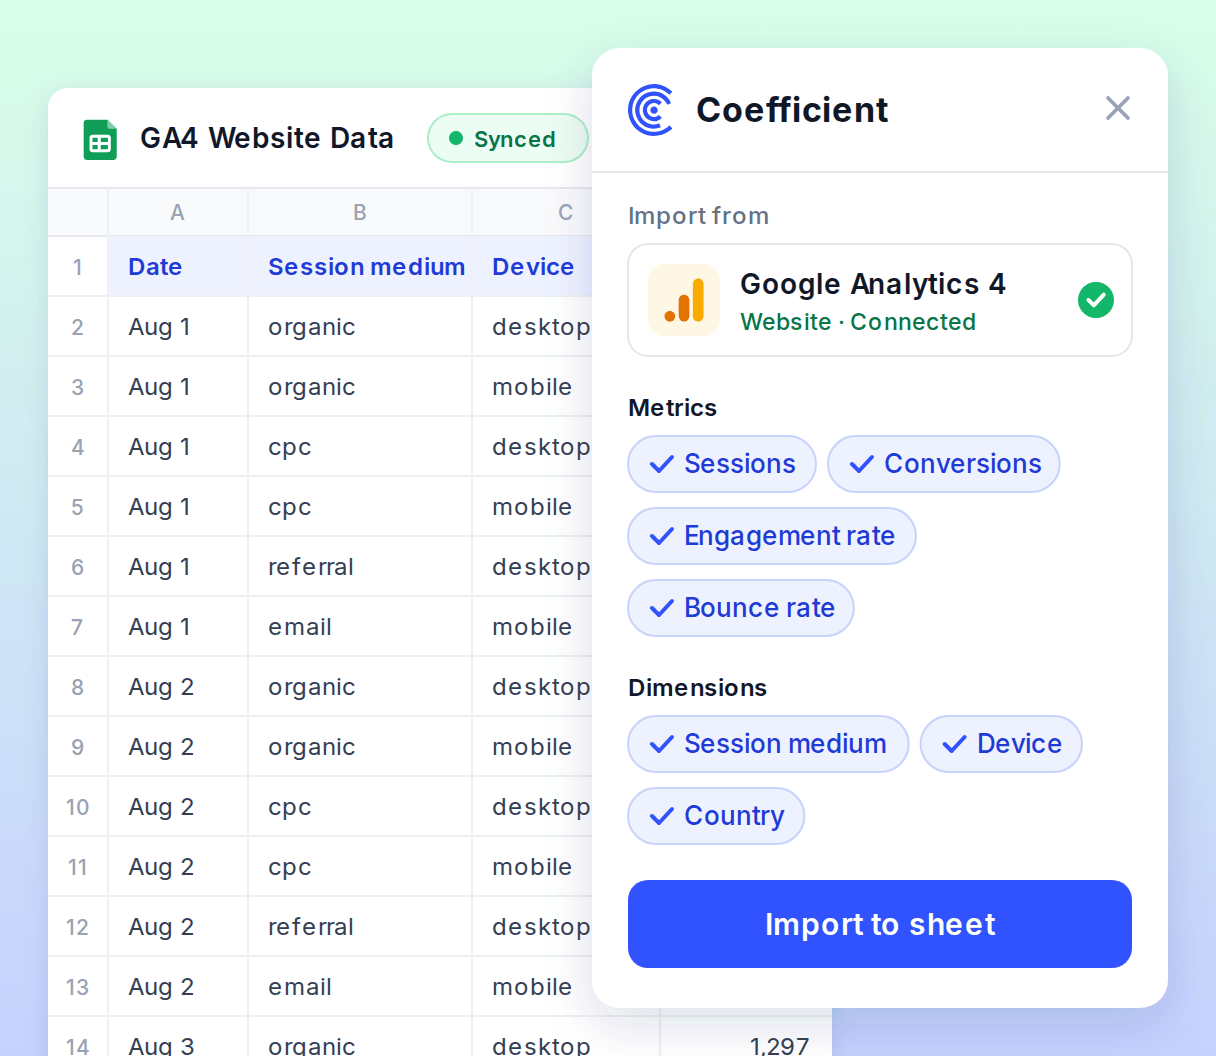
Connect GA4 to your spreadsheet
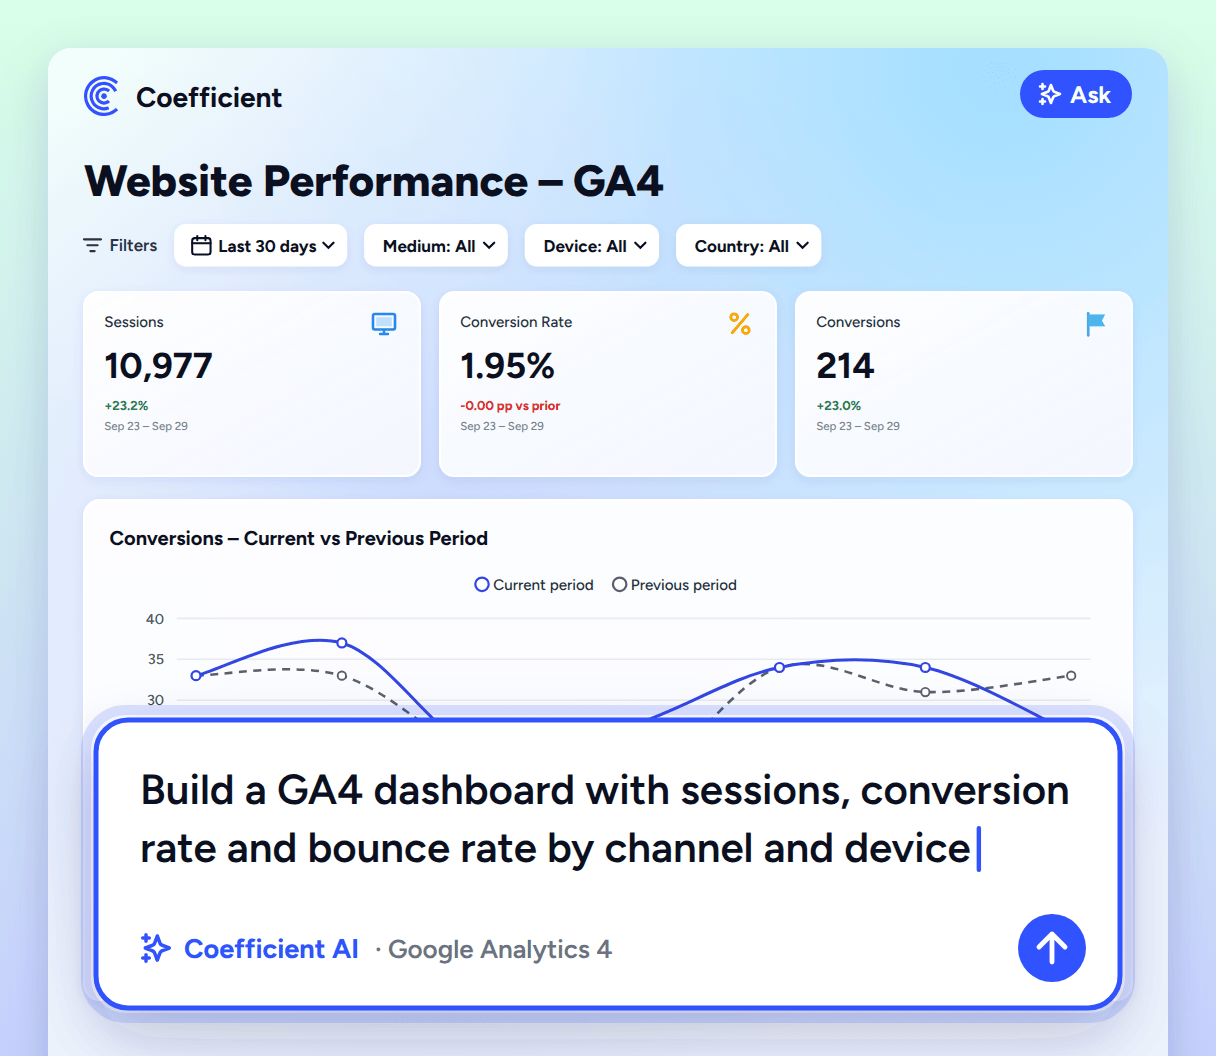
Describe your dashboard to Coefficient AI
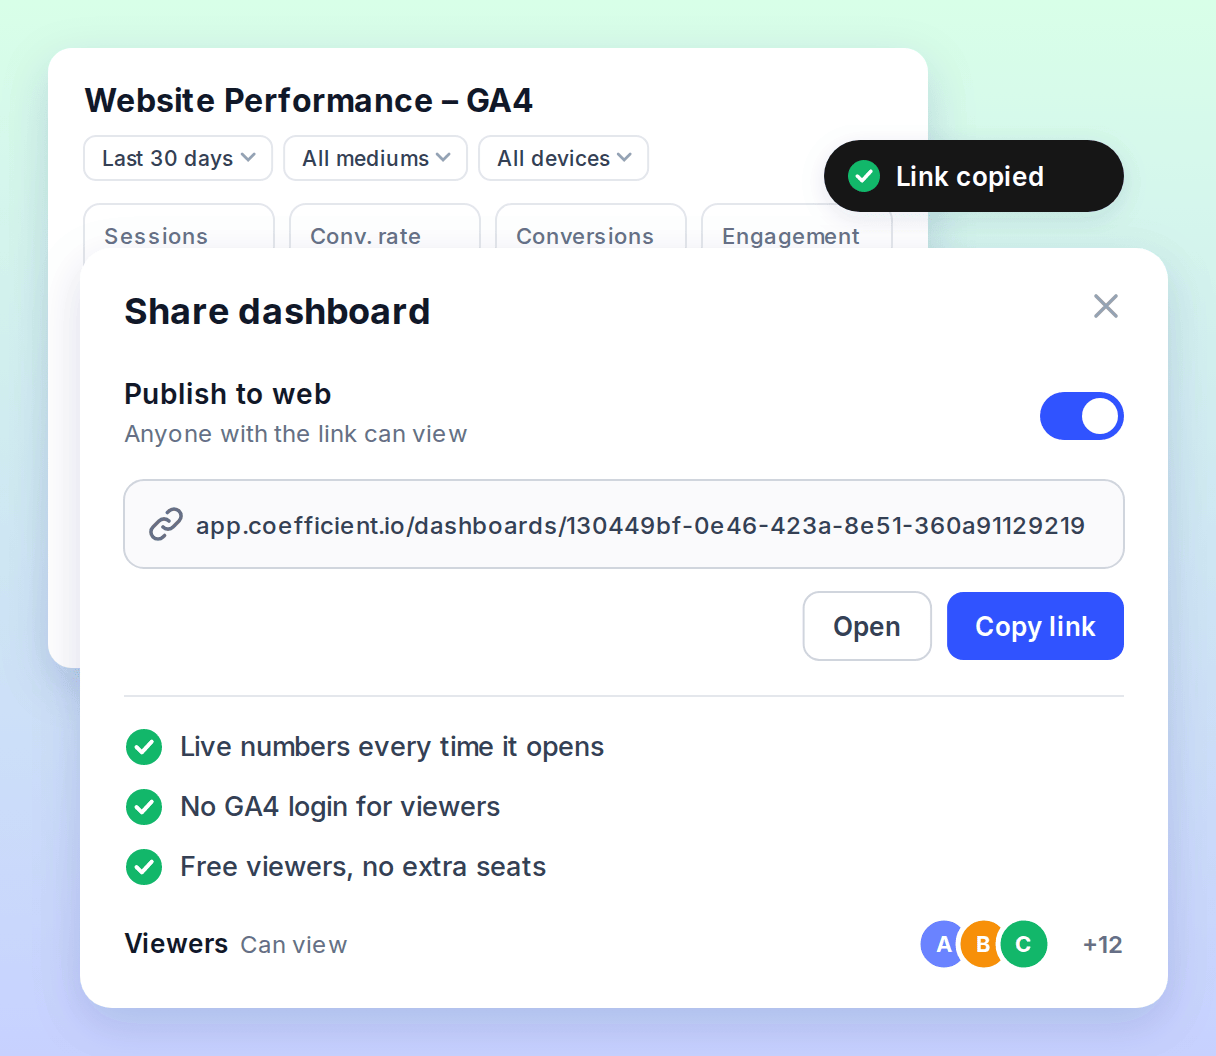
Share the live dashboard with anyone. No Viewer Pricing
Connect
Connect GA4 to your spreadsheet
Describe
Describe your dashboard to Coefficient AI
Share
Share the live dashboard with anyone. No Viewer Pricing

Rather than it taking weeks, I was able to deploy four new dashboards which we haven’t had before, in a matter of three days.


Analyze and gather insights from the dashboard charts & data by asking Coefficient AI
Coefficient Dashboards are not just visuals. Coefficient AI can analyze the data for you. Just ask for it in English.

Marketing Ops
"Why is so much traffic showing up as Unassigned this week?"

Demand Gen Manager
"Did the new paid campaign lift conversions, or just sessions?"

SEO Lead
"Is the organic drop sitewide, or only on mobile?"

CMO
"Is the website delivering more conversions than last month, and which channel is driving it?"

Coefficient Dashboards give us an ability to get something up and running in minutes to a massive amount of people that’s correct and visually appealing.

BI Dashboarding Features in your AI Dashboards

Free viewer sharing

Drill down to the source record

Slack and email scheduling

Row-level security
Key Metrics in this website performance dashboard
Critical KPIs pulled live from your GA4 property to build the dashboard.
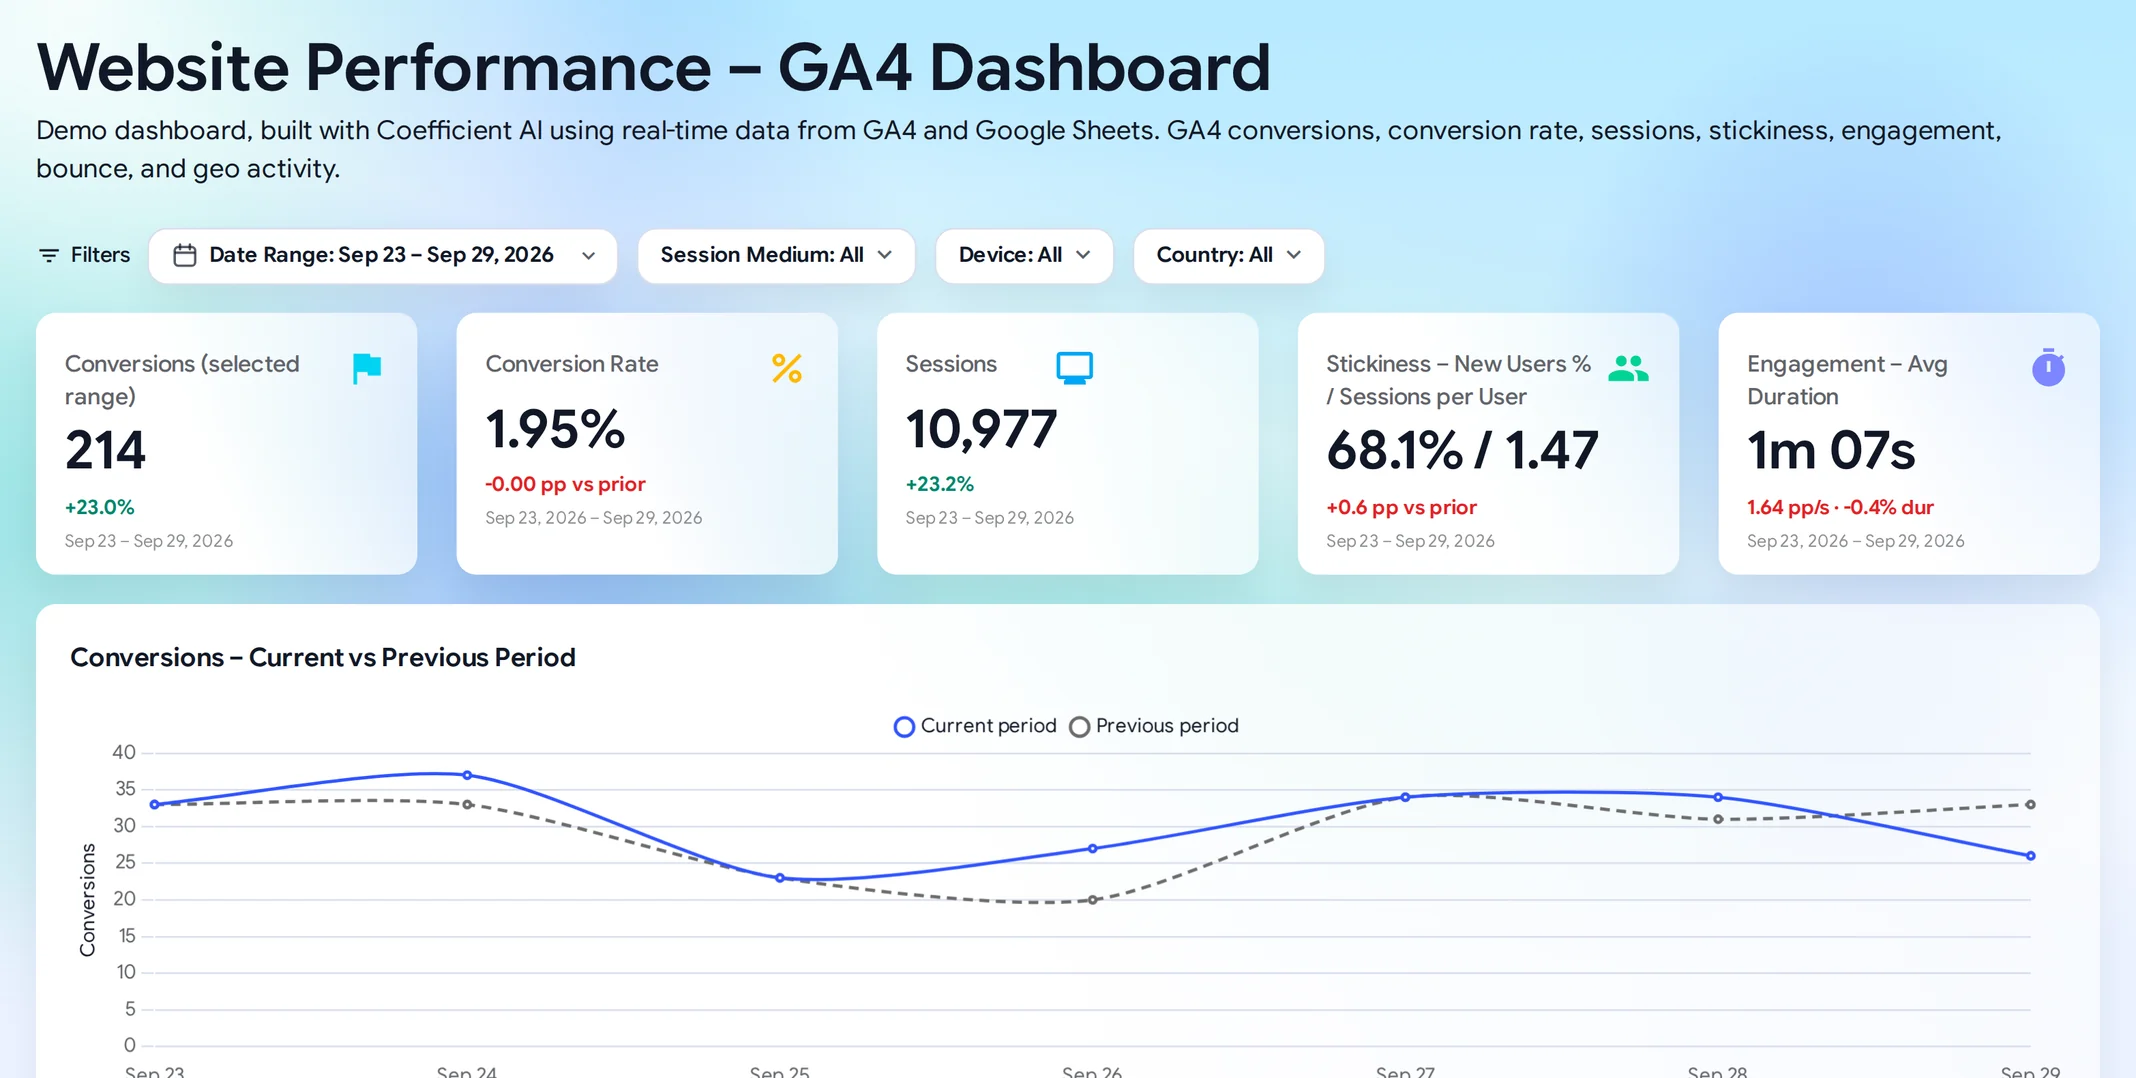
Conversions
Google Analytics 4 · keyEventsTotal key events completed in the selected date range, across every traffic medium and device. GA4 renamed conversions to key events in 2024, and the count is the same.
Conversion Rate
Google Analytics 4 · sessionKeyEventRateShare of sessions with at least one key event. The headline efficiency number for any acquisition channel.
Sessions
Google Analytics 4 · sessionsVisits that started on your site in the period, grouped by traffic medium, device category and country.
Stickiness
Google Analytics 4 · newUsers, sessionsNew users as a share of traffic, paired with sessions per user. Read together, they show whether growth comes from new visitors or returning ones.
Average Session Duration
Google Analytics 4 · averageSessionDuration, screenPageViewsPerSessionAverage length of a session in the period, shown alongside page views per session.
Engagement Rate
Google Analytics 4 · engagementRateShare of sessions that lasted longer than 10 seconds, included a key event, or had 2 or more page views.
Bounce Rate
Google Analytics 4 · bounceRateShare of sessions that were not engaged. In GA4 this is the inverse of engagement rate, not the older single-page definition from Universal Analytics.

Why not just build this Website Performance Monitoring in GA4?
The two things people try first, and where each one stops.
| Coefficient | GA4 reports | LLMClaude, ChatGPT | |
|---|---|---|---|
| Dashboard Type | Live BI-quality dashboard in a dedicated URL | Report inside GA4 | A one-off chart or summary |
| Stays current | Scheduled refresh or on demand | Live in GA4 | Re-prompt each time |
| Traceability | Drill down to the source rows | Drill-down within GA4 only | No link back to source rows |
| Alerts and delivery | Agentic alerts to Slack, Teams and email | Limited | None |
| Sharing | Link, no GA4 access needed | Needs GA4 property access | Not built for team sharing |
| Per-viewer access if enabled | Row-level security | GA4 property roles | None |
Website performance dashboard FAQs
A website performance dashboard shows how visitors find, use and convert on your site in one live view. This one is a Coefficient AI dashboard that reads from Google Analytics 4 and reports sessions, conversions, engagement, bounce rate and user location by traffic medium, device and country. It covers traffic and on-site behavior, not page load speed.

Customize this website performance dashboard with Coefficient
Change the metrics, add a second data source or rebrand it. Describe what you want in plain English and Coefficient rebuilds it on your live data.