Table of Contents
![]()
- 1. How to Set Up Bookkeeping in Excel
-
2. How to Build a Startup Financial Model in Excel
- Startup financial model fundamentals
- Step-by-step: Building your startup model using our template
- Essential startup metrics and KPIs
- Free startup financial model template
- Advanced startup financial modeling
- Automate your model with live data integration
- Startup model best practices
- Get the template and start building
- FAQs


Building a solid financial model separates successful startups from those that burn through cash without direction. Unlike established businesses with years of historical data, startups must navigate uncertainty while convincing investors they understand their unit economics and growth trajectory.
Most founders struggle with complex Excel formulas and financial statement connections. They need something that works immediately. Our pre-built startup financial model template eliminates the guesswork, giving you a professional foundation that connects revenue forecasting with expense planning and cash flow projections.
With Coefficient’s live data integration, your model stays current automatically. No more manual updates or stale assumptions.
Startup financial model fundamentals
What makes startup models different
Startup financial models operate in a world of educated guesses. You’re projecting revenue from products that might not exist yet, estimating customer acquisition costs without historical data, and planning for growth that could accelerate or stall overnight.
- High uncertainty drives different priorities. While established businesses focus on optimizing existing operations, startups need models that answer: How long until we run out of money? What happens if growth slows by 50%? Which levers move the needle most?
- Cash burn and runway calculations become critical. Traditional businesses might model profitability over quarters. Startups count months or weeks until their next funding milestone. Every hire, every marketing dollar, every product delay impacts survival.
- Investor presentation requirements shape everything. Your model needs to tell a compelling story about scalable unit economics, defensible growth rates, and capital efficiency. Investors want to see you understand the business mechanics, not just the dream.
P&L vs. 3-statement approach
- Early-stage startups benefit from simplified P&L models. When you’re pre-revenue or just finding product-market fit, balance sheets and cash flow statements add complexity without insight. Focus on revenue projections, burn rate, and key operating metrics.
- Series A and beyond demands more sophistication. As you scale, investors expect full three-statement models showing working capital management, debt capacity, and cash conversion cycles. The complexity tradeoff becomes worth it when you’re managing real assets and liabilities.
- Match model complexity to funding stage. Pre-seed companies need scenario planning around customer acquisition. Series B companies need detailed departmental P&Ls and cash management strategies.
Core components every startup model needs
- Revenue projections with clear assumptions. Break down customer acquisition, pricing, churn, and expansion revenue. Show the math behind your growth story.
- Expense categories tied to growth drivers. Link headcount costs to revenue targets. Connect marketing spend to customer acquisition goals. Make every dollar defensible.
- Headcount planning with realistic timelines. Model when you’ll hire each role, their full compensation cost, and productivity ramp-up periods.
- Cash flow forecasting with scenario analysis. Track monthly cash burn, project runway under different growth scenarios, and plan funding milestones accordingly.
Step-by-step: Building your startup model using our template

Download our free Startup Financial Model Template to follow along with each step
Step 1: Download and explore the template structure
Access our HubSpot-powered template and familiarize yourself with the five core tabs. The Dashboard provides your main financial overview. Deals connects to live CRM data. Revenue handles forecasting logic. Downgrades tracks deal adjustments. Expense Forecast manages all cost planning.
Each tab feeds into the others automatically. Change an assumption in Revenue, watch it flow through to your Dashboard P&L. Add a new hire in Expense Forecast, see the impact on cash burn immediately.
The template works whether you’re tracking ten deals or ten thousand. Start simple, add complexity as you grow.
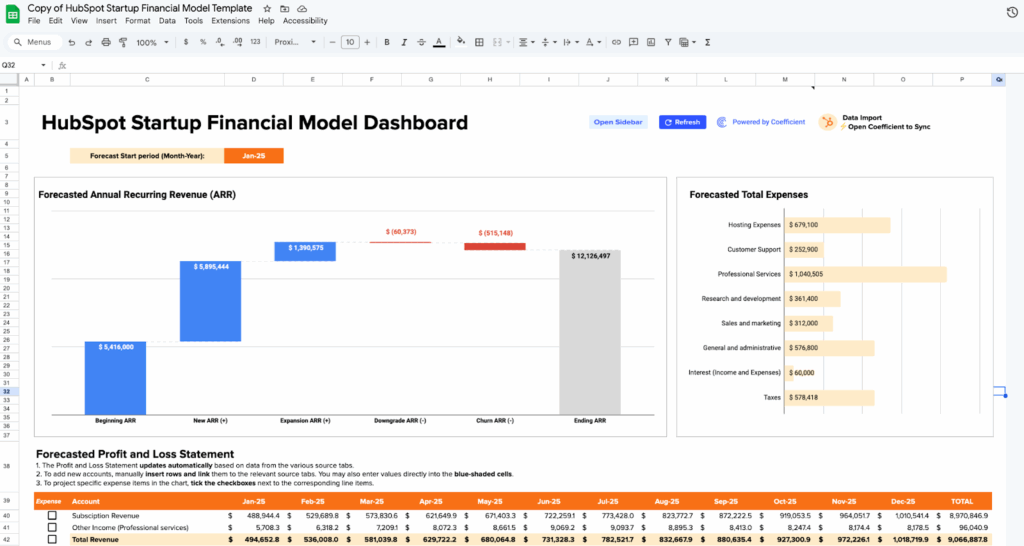
Step 2: Review your dashboard overview

- Your financial command center lives here. The Dashboard shows your Forecasted Annual Recurring Revenue (ARR) as a waterfall chart, breaking down beginning ARR, new acquisitions, expansions, downgrades, and churn into ending ARR.
- The expense breakdown categorizes all costs from hosting to professional services. Below that, your auto-generated Profit and Loss Statement projects monthly performance across subscription revenue, expenses, and net income.
- This overview updates automatically as you modify assumptions in other tabs. Change your churn rate in Revenue, watch the ARR waterfall adjust. Add headcount in Expense Forecast, see the P&L reflect new salary costs.
Use this tab for board presentations and investor updates. Everything flows from your underlying assumptions into this clean, professional view.
Step 3: Connect your deal pipeline data
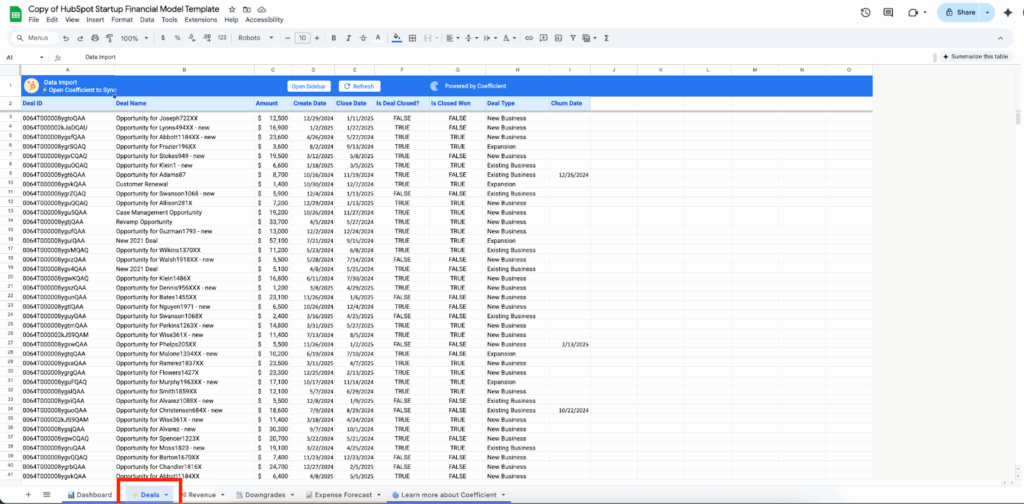
- Live CRM integration eliminates manual data entry. The Deals tab pulls directly from HubSpot (or your preferred CRM), showing deal amounts, create dates, close dates, deal status, and type classifications.
- Each row represents a real opportunity in your pipeline. The model uses this data to calculate conversion rates, average deal sizes, and sales velocity metrics that drive your revenue forecasting.
- Deal classification drives different assumptions. New business deals might have different close rates than expansion opportunities. The template accommodates multiple deal types with customizable conversion logic.
Review this data monthly for accuracy. As deals progress or stall, your revenue projections adjust automatically.
Step 4: Build your revenue forecasting model
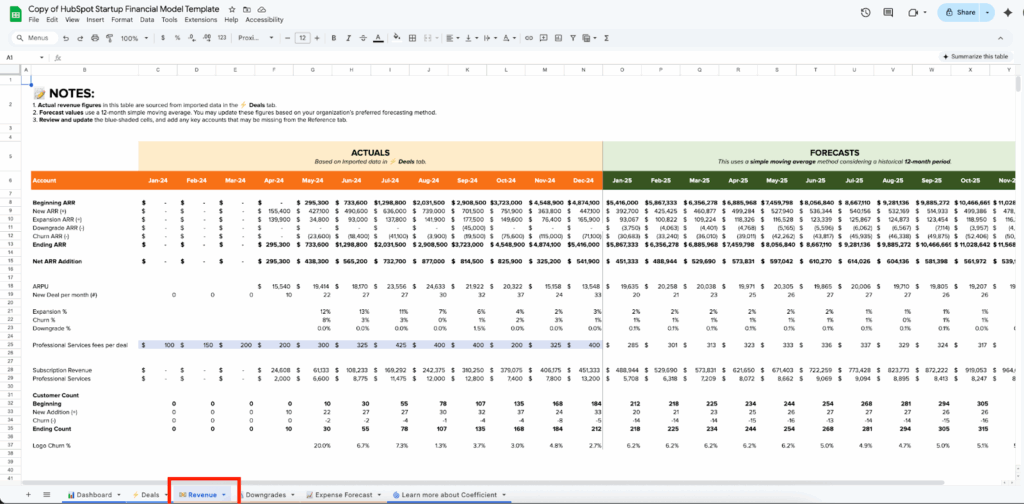
- The engine behind your growth story lives here. The Revenue tab splits into actuals (left side) and forecasts (right side), using simple moving averages to project future performance based on historical trends.
- Key metrics drive everything: ARPU (Average Revenue Per User), new deals per month, expansion percentages, churn rates, and downgrade assumptions. Modify these assumptions to model different growth scenarios.
- Customer count tracking shows beginning customers, new acquisitions, churn, and ending counts monthly. Logo churn percentages help you understand customer retention dynamics beyond just revenue.
The template includes professional services revenue alongside subscription income. Adjust the mix based on your business model and growth strategy.
Step 5: Track deal downgrades and adjustments
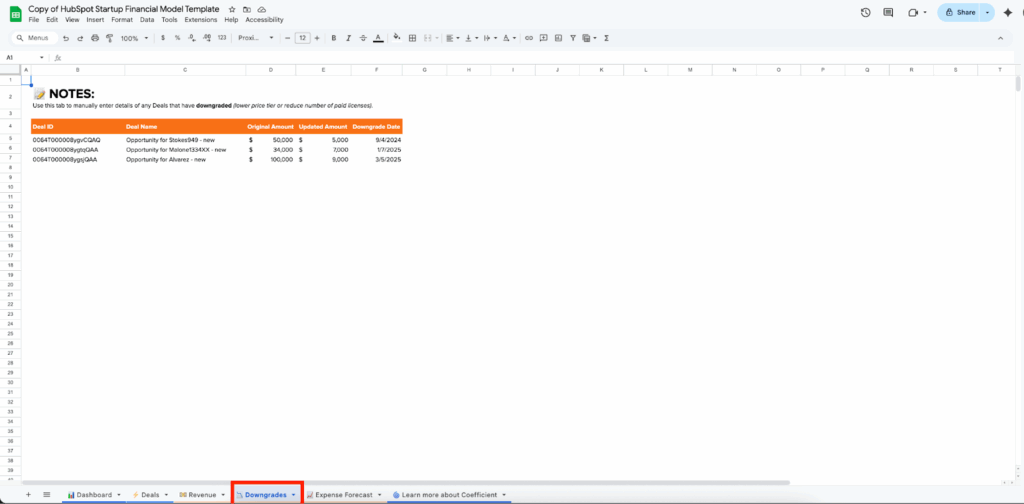
- Reality rarely matches initial projections. The Downgrades tab captures deals that reduced in value, showing original amounts, updated amounts, and downgrade dates.
- Manual entry ensures accuracy. While most data flows automatically, downgrades often require human judgment. Did a customer reduce seat count? Negotiate a lower price? Delay implementation? Capture those details here.
- This data feeds into your churn calculations and revenue forecasting. Proper downgrade tracking prevents overly optimistic projections based on initial deal sizes.
Step 6: Plan all your expenses
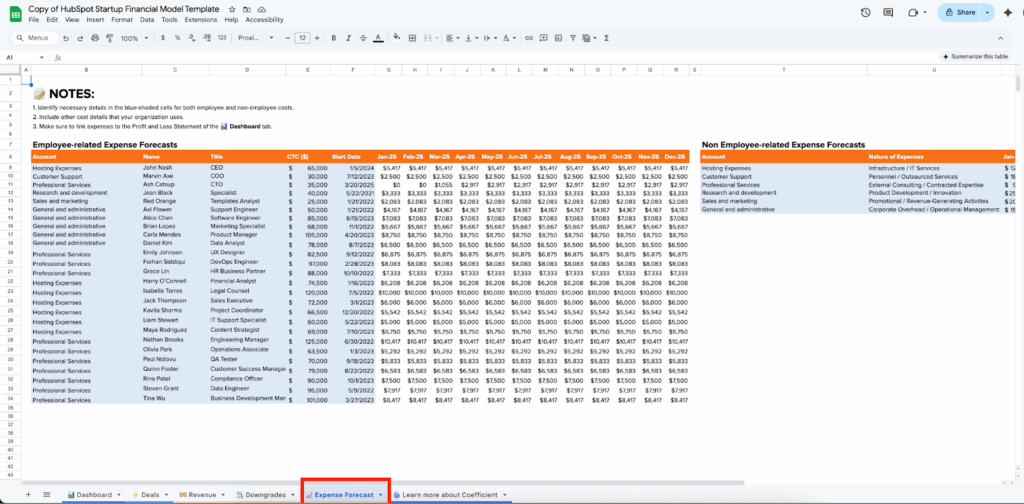
- Comprehensive cost modeling in one place. The Expense Forecast tab handles both employee-related expenses (left side) and non-employee costs (right side). Each employee entry includes name, title, CTC (Cost to Company), start date, and monthly projections.
- Role-based planning enables scenario modeling. Plan when you’ll hire your next engineers, sales reps, or marketing specialists. See the immediate impact on monthly burn rate and cash runway.
- Non-employee expenses cover everything else: hosting costs, customer support tools, professional services, research and development, sales and marketing spend, and general administrative expenses.
- Link variable costs to growth metrics. As revenue increases, certain expenses should scale proportionally while others remain fixed.
Step 7: Review auto-generated financial statements

- Back to your Dashboard for the complete picture. Your inputs from Revenue and Expense Forecast automatically populate the Profit and Loss Statement with monthly projections for subscription revenue, total expenses by category, and net income.
- Monthly cash flow visibility helps you plan funding milestones. See exactly when you’ll need additional capital based on current growth trajectories and spending plans.
The P&L follows standard startup accounting practices, separating revenue types and expense categories in ways investors expect to see.
Essential startup metrics and KPIs
Financial health metrics
- Monthly burn rate tells you how fast you’re consuming cash. Calculate it as total monthly expenses minus total monthly revenue. Track this religiously – it drives everything else.
- Runway calculations show months of survival at current burn rates. Divide remaining cash by monthly burn. Most startups need 12-18 months of runway before fundraising.
- Gross margin analysis reveals unit economics health. Subtract direct costs (hosting, support, delivery) from revenue. SaaS companies should target 70-80% gross margins.
- Unit economics fundamentals compare Customer Acquisition Cost (CAC) to Customer Lifetime Value (LTV). Healthy startups achieve 3:1 LTV:CAC ratios with CAC payback under 12 months.
Growth and efficiency metrics
- Monthly and quarterly growth rates demonstrate momentum to investors. Calculate month-over-month revenue growth, but also track customer count and average deal size growth separately.
- Revenue per employee measures team productivity. Early-stage startups often see $100K-200K per employee, scaling to $300K+ as they mature.
- CAC payback period shows how quickly new customers become profitable. Divide CAC by monthly revenue per customer. Target under 12 months for sustainable growth.
- ARR growth components break down growth into new business, expansion revenue, churn, and downgrades. Understanding each component helps you focus improvement efforts.
Operational metrics
- Employee productivity measures vary by department. Sales reps might generate $1M+ ARR annually. Engineers might ship features supporting $500K+ revenue each.
- Marketing ROI by channel reveals which customer acquisition strategies work. Track cost per lead, lead-to-customer conversion, and lifetime value by source.
- Sales conversion metrics include lead-to-opportunity rates, opportunity-to-close rates, and average sales cycle length. These drive your revenue forecasting accuracy.
How to build these into your model
- Automated calculation setups use Excel formulas to compute metrics from your underlying data. Change assumptions, watch metrics update automatically.
- Dashboard creation puts key metrics front and center for board meetings and investor presentations. Focus on 5-7 critical numbers that tell your story.
- Variance tracking compares actual performance to projections monthly. This feedback loop improves your forecasting accuracy over time.
Free startup financial model template
Download our complete startup financial model template with pre-built formulas, automated calculations, and investor-ready formatting. The template includes all tabs shown above plus detailed documentation.
Advanced startup financial modeling
3-statement model integration
- Series A and beyond companies need full financial statements. While early-stage startups focus on P&L and cash flow, growth-stage companies require balance sheet modeling for working capital management, debt capacity analysis, and investment planning.
- Working capital management becomes critical as you scale. Model accounts receivable collection periods, inventory turns (for hardware companies), and payment timing to suppliers.
- Debt and equity financing impacts require sophisticated modeling. Track dilution effects from equity rounds, interest payments on debt, and cash flow implications of different funding structures.
- Cash flow statement complexity increases with business maturity. Operating cash flow differs from net income due to non-cash expenses, working capital changes, and timing differences.
Multi-business model scenarios
- Hybrid revenue models combine subscription, services, and usage-based pricing. SaaS companies often blend recurring software revenue with professional services or implementation fees.
- Marketplace two-sided economics require modeling both supply and demand sides. Track customer acquisition costs for buyers and sellers, take rates, and network effects.
- Hardware plus software combinations involve complex inventory management, manufacturing costs, and different revenue recognition timing.
- Subscription plus usage-based pricing creates variable revenue streams. Model base subscription fees alongside usage charges that fluctuate with customer activity.
Fundraising integration
- Cap table modeling tracks ownership dilution across funding rounds. Plan how much equity you’ll give up and at what valuations.
- Dilution calculations help you understand founder and employee ownership evolution. Model option pool expansions and their dilutive effects.
- Use of funds planning details how investment dollars translate into growth. Break down hiring plans, marketing spend, and product development investments.
- Investor return projections show potential exits and returns. Model different exit scenarios and their impact on investor IRR.
- Exit scenario planning explores acquisition or IPO possibilities at various revenue multiples and growth rates.
Growth stage considerations
- Series A readiness requires demonstrating repeatable sales processes, predictable unit economics, and scalable business models through detailed financial modeling.
- Board reporting standards demand monthly variance analysis, departmental P&Ls, and forward-looking scenario planning.
- Department-level P&L tracking helps optimize resource allocation across engineering, sales, marketing, and operations.
- Advanced unit economics include cohort analysis, churn prediction modeling, and customer segmentation profitability.
Automate your model with live data integration
Manual model limitations
- Time-intensive monthly updates drain productivity from strategic work. Founders spend hours copying data from multiple systems, updating formulas, and checking for errors.
- Data entry errors compound over time. Wrong numbers in month one become wrong assumptions in month twelve. Manual processes inevitably introduce mistakes.
- Disconnected from actual business performance. When your model lives in isolation, it becomes a theoretical exercise rather than a management tool.
- Outdated assumptions persist because updating them requires touching multiple spreadsheet cells. Your model becomes stale quickly.
Coefficient’s integration solution

- Connect directly to your business systems and eliminate manual data entry. Pull deal data from HubSpot or Salesforce, expense data from QuickBooks or NetSuite, and customer metrics from your product analytics.
- Automatic refresh schedules keep your model current without intervention. Set daily, weekly, or monthly updates to ensure projections reflect reality.
- Live data feeds mean your Dashboard always shows current performance against plan. No more wondering if your numbers are accurate.
- Error elimination comes from single-source-of-truth data flows. When QuickBooks shows an expense, your model reflects it immediately and accurately.
Startup model best practices
- Keep assumptions visible and documented. Use dedicated assumption cells that feed into your calculations. When assumptions change, update one cell instead of hunting through formulas.
- Build in flexibility for business model evolution. Early-stage startups pivot frequently. Design your model to accommodate new revenue streams, different pricing models, or changed unit economics.
- Regular variance analysis drives improvement. Compare actual performance to projections monthly. Understand why reality differed from plan, then adjust future assumptions accordingly.
- Scenario planning prepares you for uncertainty. Model best case, base case, and worst case scenarios. Show investors you understand the risks and have contingency plans.
Get the template and start building
Financial modeling shouldn’t consume weeks when you need to focus on building your business. Our template gives you professional-grade forecasting in minutes, not months.
Smart founders automate what they can and focus energy on what matters most – customers, product, and growth. Your financial model should inform decisions, not slow them down.
Get started with live data integration and build a financial model that grows with your business.
FAQs
What’s the difference between a startup financial model and a traditional business model?
Startup models focus on uncertainty, cash burn, and growth scenarios rather than optimizing existing operations. They emphasize runway calculations, unit economics, and scenario planning over historical trend analysis.
Should early-stage startups use a 3-statement model or simplified P&L approach?
Early-stage startups benefit from simplified P&L models focusing on revenue projections and burn rate. Full 3-statement models become valuable at Series A when managing working capital and investor sophistication increases.
How often should I update my startup financial model?
Update actuals monthly and review assumptions quarterly. Major business changes (new pricing, different growth trajectory, market shifts) require immediate model updates regardless of schedule.
What metrics do investors look for in startup financial models?
Investors focus on unit economics (LTV:CAC ratio), growth efficiency (CAC payback period), burn rate and runway, gross margins, and monthly/quarterly growth rates. They want to see you understand the business mechanics.
How do I model revenue growth and customer acquisition?
Start with historical conversion rates from your sales funnel. Model new customers acquired monthly, average revenue per customer, churn rates, and expansion revenue. Use conservative assumptions and test sensitivity.
What’s the best way to handle churn and downgrades in my model?
Track both customer churn (lost customers) and revenue churn (reduced spending). Model them separately as they affect growth differently. Use cohort analysis to understand churn patterns over customer lifetime.
How do I connect my CRM and accounting data to Excel financial models?
Use tools like Coefficient to create live data connections between your spreadsheet and business systems. This eliminates manual data entry and keeps your model automatically updated with real performance data.
What scenarios should I include in my startup financial model?
Model best case (accelerated growth), base case (current trajectory), and worst case (growth slowdown) scenarios. Include sensitivity analysis on key variables like customer acquisition cost, churn rate, and average deal size.