
Data blending in Looker Studio is one of the most useful features and one of the most frustrating. When it works, it saves hours of manual report building. When it breaks, it breaks silently — inflated numbers, missing rows, charts that look plausible but are completely wrong. And there is rarely a useful error message to tell you why.
This guide is for people past the basics. You know what a blend is. You have built a few. You keep running into problems. Here are five tips that actually fix them — plus an honest take on when blending in Looker Studio is the wrong tool entirely.
What Data Blending in Looker Studio Actually Does
Data blending combines multiple data sources into a single chart or table using a shared dimension — the join key. Google’s official documentation defines five join types:
| Join type | What it returns |
| Inner join | Only rows that match in both sources. Non-matching rows from either side are dropped. |
| Left outer join | All rows from the left source plus matching rows from the right. Non-matching right rows are dropped. |
| Right outer join | All rows from the right source plus matching rows from the left. Non-matching left rows are dropped. |
| Full outer join | All rows from both sources. Non-matching rows from either side appear with nulls in the other’s fields. |
| Cross join | Every possible combination of rows from both sources. Rarely what you want — produces massive datasets. |
One constraint worth knowing upfront: blends are report-specific. You cannot reuse a blend across reports. Every report that needs the same join has to rebuild it from scratch.
Tip 1: Pick Your Left Data Source Carefully — It Controls Everything
This is the most misunderstood aspect of data blending in Looker Studio and the one that causes the most head-scratching.
In a left outer join (the default), the left data source controls which rows appear in the output. If your left source has no data for a given date, that date disappears from the blend entirely — even if the right source has data for it.
Here is a common example. You blend Google Ads (left) with Google Analytics (right), joined on date. There were no ad clicks on Sunday. That Sunday now has no row in the left source. Result: Sunday’s GA sessions vanish from your report too. Your traffic numbers look lower than they should be and you have no idea why.
The fix
Always put the most complete data source on the left — the one with a row for every date in your reporting window. GA4 or Google Search Console usually works well because they record sessions and impressions daily regardless of ad activity. If no single source has complete coverage, create a date dimension table in Google Sheets with one row per date and use that as your left source.
- Put the most complete source on the left.
- If a metric has gaps on some days, add a supplementary metric (like Sessions) to force zero-value rows to populate.
- Always check the row count in your blended output against each individual source before publishing.
Tip 2: Mismatched Join Keys Are Why Your Numbers Look Wrong
Inflated numbers are the most dangerous output of a broken blend. They look plausible — just a bit high. Stakeholders approve reports based on them. Decisions get made.
The cause is almost always a join key problem. Two things trigger it.
First: the join key values do not match exactly across sources. One source stores ‘United States’, another stores ‘US’. One stores ‘google / cpc’, another stores ‘Google CPC’. Looker Studio treats these as different values and produces a full outer join behaviour even if you configured a left outer join — rows that should match do not, and null rows proliferate.
Second: no join key is set at all, which triggers a cross join. Every row from the left multiplies by every row from the right. If you have 30 days of Google Ads data and 30 days of GA data, you get 900 rows. Metrics sum across all those rows. The numbers are not just wrong — they are systematically inflated by a factor equal to the number of rows in one of your sources.
The fix
Standardise join key values before they reach Looker Studio. If the join key is campaign name, make sure the name format is identical in both sources. If it is country, pick one format and clean both sources to match. The cleanest way to do this is upstream — pull both sources into Google Sheets with Coefficient, apply a normalisation formula to the join key column in each tab, then connect Looker Studio to the cleaned output.
- Always set a join key explicitly. Never rely on Looker Studio to infer one.
- Verify your blended total against the sum of each individual source. If it is higher than the larger source, you have a cross join or a fanout problem.
- Check the data type of your join key fields — date joined to string will silently fail to match.
Tip 3: Pre-filter Inside the Blend Editor, Not at Chart Level
Most people apply filters at the chart level in Looker Studio. For blended data sources, this is the wrong place — and it is why blended dashboards are slow.
Here is how filters work in a blend. A filter applied to the left source in the blend editor runs before the join — it reduces the data volume that source returns. A filter applied to the right source in the blend editor does the same for the right side. A chart-level filter runs after the blend — it filters the output, but both sources have already returned their full datasets to execute the join.
If you apply a 90-day date filter at chart level on a blended report pulling from three sources, each source returns 90 days of full data, the blend joins all of it, then the filter trims the output. You paid the query cost for all three sources in full. That is why your dashboard takes 15 seconds to load.
The fix
Apply date and segment filters inside the blend editor at the table level, before the join runs. Open the blend editor via Resources > Manage Blends. Select the table you want to filter. Add a filter directly to that table. This restricts what each source returns before blending happens — which is what actually reduces load time.
- Set date filters on each table inside the blend editor, not on the chart.
- Use the Custom date range option on each table to override the chart date range when sources have different data availability windows.
- Avoid putting calculations in join keys — they force Looker Studio to compute a field for every row before joining, which adds significant processing time.
Tip 4: Hit the 5-Source Cap? Move the Blending Upstream
Looker Studio caps blends at 5 sources per blend. For teams combining CRM data, paid search, paid social, SEO and revenue data that cap is hit on the first dashboard. Your options inside Looker Studio are to cut a source or split analysis across multiple reports. Neither gives stakeholders the unified view they need.
The better fix is to stop doing the blending in Looker Studio entirely.
The fix
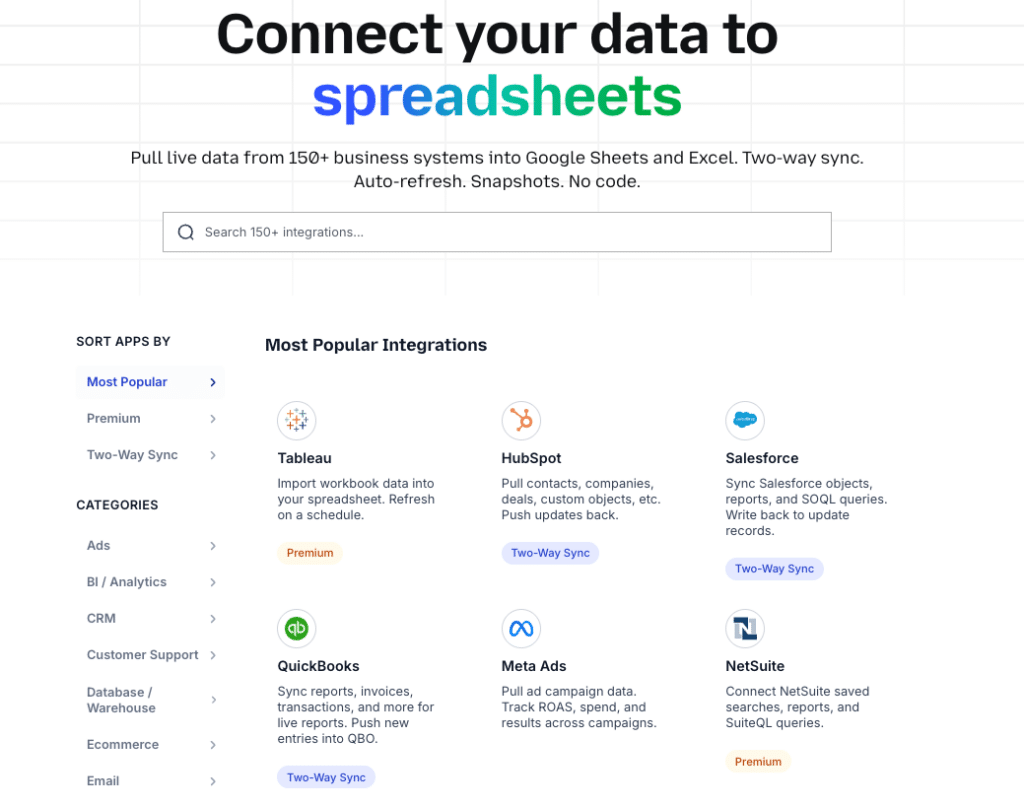
Pull each data source into Google Sheets with Coefficient on a refresh schedule. Coefficient connects HubSpot, Salesforce, Google Ads, GA4 and 100+ other sources directly to Sheets.

Stop exporting data manually. Sync data from your business systems into Google Sheets or Excel with Coefficient and set it on a refresh schedule.
Get Started
Use VLOOKUP, INDEX MATCH or the AI Sheets Assistant to join the data into one clean unified table. Connect Looker Studio to that single Sheets tab via the free native connector.
The result: no source cap, faster load times (one source instead of five queries at render), and you can see exactly what the join is doing because it is in plain Sheets formulas rather than a black-box blend editor.
- No 5-source limit — join as many sources as you need in Sheets.
- Schema changes in a source are visible immediately in the Sheets tab, not silent.
- The same Sheets tab can feed multiple Looker Studio reports without rebuilding the blend in each one.
| Coefficient pulls live data from 100+ sources into Google Sheets on a refresh schedule. Use it as the data layer for Looker Studio and skip the blend editor entirely for complex joins. Get started free. |
Tip 5: Blends Are Report-Specific — Design for That
This limitation catches teams out when they try to scale reporting. Blends in Looker Studio cannot be reused across reports. Every report that needs the same join has to recreate it from scratch inside that report.
For a single analyst building one dashboard, that is manageable. For an agency managing 20 clients with the same data structure — GA4 plus Google Ads plus Search Console — it means rebuilding the same blend 20 times. When a source API changes and the join key format updates, you fix it 20 times too.
The fix
Build the blend logic once in Google Sheets and use Looker Studio as the visualisation layer only. Create a master Sheets template with Coefficient pulling each source into a dedicated tab and a summary tab that joins them. Build one Looker Studio report template pointing to the summary tab. For each new client, connect the same report template to a new Sheets file with the same structure.
The join logic lives in one place. Updates to the join propagate automatically to every report that points to that tab. New clients take minutes to onboard rather than hours.
- Maintain one master join template in Sheets rather than duplicating blend logic per report.
- Name your Sheets tabs consistently so Looker Studio report templates can be duplicated and reconnected without reconfiguration.
- Schedule Coefficient refreshes to run before your stakeholders typically open dashboards — so the data is always current when they arrive.
When to Stop Blending in Looker Studio Entirely
Data blending in Looker Studio is the right tool for quick ad-hoc analysis and simple two-source joins where both sources are Google-native and the join key is clean. It is the wrong tool when:
- You have more than 5 sources to combine.
- You need blend logic to be reusable across multiple reports.
- The join key values are inconsistent between sources and need cleaning.
- The dashboard is business-critical and stakeholders check it daily — silent failures are too costly.
- Load times are unacceptable and pre-filtering inside the blend editor has not fixed them.
At that point the join belongs upstream — either in Google Sheets with Coefficient (for RevOps, marketing ops and agencies who do not have a data engineer) or in BigQuery (for data engineering teams with a warehouse already in place). Both approaches feed a single clean data source to Looker Studio. Both are faster and more maintainable than a complex native blend. More on what Looker Studio can and cannot do here.
Already Have the Data in Sheets? Publish It as a Live Dashboard
If the blend complexity is adding up and Looker Studio feels like more overhead than it is worth, there is a faster path. Coefficient’s Vibe Reporting lets you describe your dashboard in plain English and publishes a live shareable web dashboard directly from your pre-joined Sheets data.
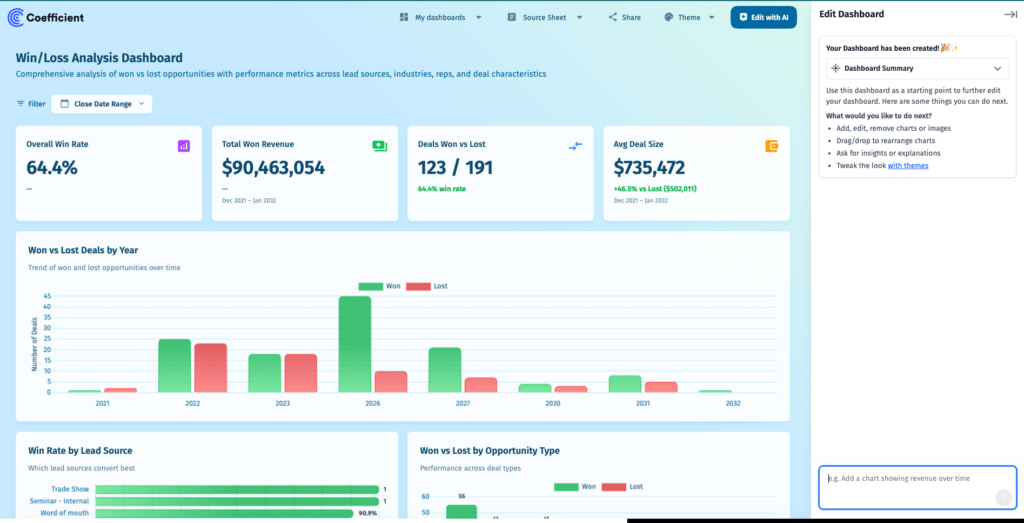
No blend editor. No 5-source cap. No silent join failures. No rebuild-per-report. Describe what you want — revenue vs spend by channel, pipeline by stage, campaign attribution by week — and Coefficient builds it. The dashboard updates automatically on your refresh schedule and shares via link with anyone inside or outside your organisation.
For teams already using Coefficient to pull data into Sheets, this removes Looker Studio from the stack entirely for standard reporting — without losing the live data or the shareable output.
| Pull your data sources into Sheets with Coefficient, describe your dashboard in plain English and publish it as a live web report. See Coefficient in action. |
The Bottom Line
Data blending in Looker Studio is useful but fragile. Left source order controls which rows appear. Mismatched join keys produce inflated numbers with no warning. Filters need to go inside the blend editor, not at chart level. The 5-source cap and the non-reusable blend structure both push complex joins upstream into Google Sheets where the logic is visible and maintainable. When the complexity grows past what Looker Studio handles cleanly, Coefficient does the data layer work and Vibe Reporting handles the output. Get started free.


