Data has become the lifeblood of modern business, driving decisions and shaping strategies across industries. Yet, many organizations struggle to harness its full potential. Enter automated reporting – a game-changing approach that’s revolutionizing how businesses extract value from their data.
With companies reporting up to 80% time savings and adoption rates soaring past 60%, automated reporting is rapidly becoming an essential tool for data-driven decision-making. This transformation is fueled by advancements in AI, no-code tools, and cloud computing, enabling even non-technical users to create sophisticated reporting solutions.
What is Report Automation?
Report automation is the process of generating data reports without manual intervention, using pre-defined rules and schedules. This system typically involves:
- Data Collection: Automated systems can pull data from various sources, including databases, APIs, web services, and file systems.
- Data Processing: This involves cleaning, transforming, and aggregating data to ensure it’s in a usable format for reporting.
- Analysis and Visualization: Automated systems can apply predefined analytical models and create visual representations of data.
- Report Generation: The system compiles processed data into structured reports, often using customizable templates.
- Distribution: Reports are automatically sent to relevant stakeholders via email, shared drives, or integrated platforms like Slack.
Best Practices for Automated Reporting
To fully leverage the potential of automated reporting, organizations should adhere to these best practices:
Ensure Data Quality and Governance
The adage “garbage in, garbage out” is particularly relevant in automated reporting. Implementing robust data quality measures is crucial:
- Data Profiling: Regularly analyze your data to identify inconsistencies, missing values, and outliers.
- Data Cleansing: Implement automated processes to standardize formats, correct errors, and handle missing data.
- Data Validation: Use rule-based systems to verify data accuracy and flag potential issues.
Establish clear data governance policies that define:
- Data ownership and stewardship
- Data quality standards
- Data access and security protocols
- Metadata management practices
By prioritizing data quality and governance, you ensure that your automated reports are based on reliable, consistent information, fostering trust in the insights generated.
Define Clear Goals and KPIs
Before implementing automated reporting, it’s crucial to:
- Align reporting goals with business objectives
- Identify specific, measurable KPIs that reflect these goals
- Ensure KPIs are actionable and relevant to decision-makers
For example, a sales team might focus on KPIs like:
- Conversion rate
- average deal size
- Sales cycle length
- Customer acquisition cost
By clearly defining these metrics, you can design automated reports that deliver targeted, actionable insights to drive performance improvements.
Always Backup Data
Data loss can be catastrophic for businesses. Implement a robust backup strategy:
- Regular Backups: Schedule frequent backups of both raw data and processed reports.
- Multiple Backup Locations: Use a combination of on-site and cloud-based backup solutions.
- Version Control: Maintain multiple versions of reports to track changes over time.
- Disaster Recovery Plan: Develop and regularly test a plan for quickly restoring data and reporting capabilities in case of system failures.
Implement Proof of Concept (PoC)
Before full-scale implementation, conduct a PoC to:
- Test the feasibility of your automated reporting solution
- Identify potential challenges and limitations
- Gather user feedback and refine the system
- Estimate the resources required for full implementation
A well-executed PoC can save significant time and resources by catching issues early and ensuring the final solution meets user needs.
Build Only What You Need
Avoid the temptation to automate every possible report. Instead:
- Start with high-impact, frequently used reports
- Prioritize reports that are time-consuming to produce manually
- Focus on reports directly tied to key business decisions
- Gradually expand your automated reporting capabilities based on proven value and user feedback
This approach ensures that your automated reporting initiative delivers tangible value quickly and evolves in alignment with business needs.
Promote Data Literacy and User Adoption
The success of automated reporting depends on users’ ability to interpret and act on the data. To promote data literacy:
- Provide training on data interpretation and statistical concepts
- Create user guides and documentation for your reporting tools
- Offer ongoing support and resources for users
- Encourage a data-driven culture across the organization
To drive user adoption:
- Involve end-users in the design process
- Highlight early wins and success stories
- Continuously gather and act on user feedback
- Recognize and reward data-driven decision making
The 5 Building Blocks of Automated Reports
1. Data Integration and Preparation
Data integration and preparation form the foundation of any automated reporting system. This stage is critical because the quality and reliability of your reports depend entirely on the data that feeds them.
Data Sources
In today’s data-rich environment, organizations typically deal with a variety of data sources. These can include:
- Relational databases (e.g., MySQL, PostgreSQL)
- NoSQL databases (e.g., MongoDB, Cassandra)
- APIs from internal and external systems
- Flat files (CSV, JSON, XML)
- Streaming data sources (e.g., IoT devices, social media feeds)
The challenge lies in not just connecting to these sources, but also in understanding the nature of the data they provide. Are the data structures consistent? How frequently is the data updated? Are there any known quality issues? Answering these questions helps in designing a robust integration strategy.
Data Integration
Data integration involves bringing together data from various sources into a unified view. This process can be complex, especially when dealing with disparate data formats and update frequencies.
- ETL (Extract, Transform, Load) processes are traditionally used when data needs to be transformed before loading into the target system.
- ELT (Extract, Load, Transform) is becoming more popular with the advent of powerful data warehousing solutions that can handle transformations on the fly.
Tools like Apache NiFi, Talend, or Informatica can be invaluable in designing and managing these data flows. The key is to create processes that are not only efficient but also maintainable and scalable as data volumes grow.
Data Cleanup and Preparation
Raw data is rarely in a state that’s immediately usable for reporting. Data cleanup and preparation involve several key steps:
- Data Cleaning: This involves handling missing values, identifying and addressing outliers, and ensuring consistency across datasets. For instance, ensuring that date formats are standardized across all sources.
- Data Aggregation: Often, raw data needs to be summarized or aggregated for reporting purposes. This might involve creating daily or monthly summaries from granular data, or calculating key metrics that will be used in reports.
- Data Enrichment: This step involves adding value to your existing data. For example, you might enrich transaction data with geographic information, or add industry classifications to company data.
The goal of this stage is to create a clean, consistent, and enriched dataset that forms a solid foundation for your reports.
2. Data Storage and Management
Once data is integrated and prepared, it needs to be stored in a way that facilitates efficient reporting and analysis.
Data Storage
The choice of data storage solution depends on various factors including data volume, query patterns, and reporting requirements.
- Databases: Relational databases like PostgreSQL or MySQL are great for structured data and complex queries. For large-scale analytics, columnar databases like Amazon Redshift or Google BigQuery can offer significant performance benefits.
- Cloud Storage: Solutions like AWS S3 or Google Cloud Storage offer scalable and cost-effective options for storing large volumes of data. These are particularly useful for data lakes or for storing raw data that doesn’t require frequent querying.
- Data Lakes: For organizations dealing with large volumes of diverse data, a data lake architecture (often built on technologies like Hadoop) can provide a flexible solution. Data lakes allow storage of both structured and unstructured data, which can be particularly useful for advanced analytics and machine learning projects.
The key is to design a storage solution that balances performance, cost, and flexibility to meet both current and future reporting needs.
Data Security and Compliance
With data breaches regularly making headlines, security cannot be an afterthought in automated reporting systems.
- Access Control: Implement the principle of least privilege, ensuring that users only have access to the data they need. This might involve setting up role-based access control (RBAC) systems.
- Encryption: Ensure that sensitive data is encrypted both at rest and in transit. This is particularly important when dealing with personal or financial information.
- Compliance: Depending on your industry and location, you may need to adhere to regulations like GDPR, HIPAA, or PCI-DSS. This might involve implementing data retention policies, ensuring the right to be forgotten, or maintaining detailed audit logs.
Remember, data security is not just about technology – it also involves creating and enforcing policies and procedures around data handling.
3. Reporting and Visualization Tools
This is where data starts to transform into actionable insights.
Reporting Tools
The choice of reporting tools can significantly impact the effectiveness of your automated reporting system.
- BI Platforms: Tools like Tableau, Power BI, Looker, and Mode offer powerful capabilities for creating interactive dashboards and reports. They often provide features like drag-and-drop interfaces, which can empower business users to create their own reports.
- Custom Reports: For more complex requirements, custom reporting solutions might be necessary. These could be built using programming languages like R or Python, which offer extensive libraries for data manipulation and visualization. Alteryx can also be used for custom reporting, providing a platform that combines data preparation, blending, and advanced analytics.
- Spreadsheet Tools: Despite the advent of sophisticated BI tools, spreadsheets like Excel or Google Sheets remain popular for ad-hoc analysis and reporting. Modern spreadsheet tools offer features like Power Query or Google Apps Script, which can be leveraged for creating automated reports. Coefficient can enhance Excel and Google Sheets by integrating live data from various data sources and automating data updates and reporting.
The key is to choose tools that balance ease of use with the ability to meet complex reporting requirements.
Report Creation Tools
These are the specific features within your chosen reporting platform that facilitate the creation of reports:
- Drag-and-drop interfaces for creating visualizations
- Query builders for non-technical users
- Scripting capabilities for advanced users
- Templates and themes for consistent report design
The goal is to empower users to create the reports they need, while maintaining consistency and accuracy across the organization.
4. Automation and System Management
Automation is what transforms regular reporting into automated reporting.
Automation Framework
This involves setting up systems to automatically refresh data, update reports, and distribute them to the right people at the right time.
- Scheduling Tools: Tools like Apache Airflow or simple cron jobs can be used to schedule regular data updates and report generation.
- Workflow Automation: For more complex reporting processes, workflow management tools can help in orchestrating various steps, handling dependencies, and managing errors.
- Notification Systems: These ensure that stakeholders are informed when new reports are available, or when there are issues in the reporting process.
The key is to create a robust system that can operate with minimal manual intervention, while still providing visibility and control when needed.
Maintenance and Monitoring
Even the best-designed automated reporting systems require ongoing maintenance and monitoring.
- Performance Monitoring: Regularly monitor system performance to identify and address bottlenecks. This might involve tracking query execution times, data refresh durations, or user load on reporting servers.
- Error Handling: Implement comprehensive error logging and alerting mechanisms. The goal is to catch and address issues before they impact end-users.
- Updates: As business requirements evolve and new data sources become available, your reporting system will need to adapt. Having a clear process for managing updates and changes is crucial.
Remember, an automated reporting system is not a “set it and forget it” solution – it requires ongoing attention to ensure it continues to meet business needs.
5. Insight Generation and User Experience
The ultimate goal of any reporting system is to generate insights that drive business decisions.
Insight Generation
This goes beyond simple data presentation to actually deriving meaningful insights from the data.
- Advanced Analytics: Incorporate predictive modeling or machine learning algorithms to identify trends or anomalies automatically.
- Natural Language Generation: Consider implementing NLG capabilities to automatically generate narrative insights alongside visualizations.
- Anomaly Detection: Set up systems to automatically flag unusual patterns or deviations from expected trends.
The key is to move from descriptive analytics (what happened) to predictive and prescriptive analytics (what will happen and what should we do about it).
User Interface and Experience
The best insights are useless if users can’t easily access and understand them.
- Dashboards: Design intuitive, interactive dashboards that allow users to explore data and find the insights they need.
- Customization: Allow users to customize their views and save their preferences.
- Mobile Access: In today’s mobile-first world, ensure that critical reports and dashboards are accessible on mobile devices.
Feedback and Iteration
Finally, remember that an automated reporting system should continuously evolve based on user needs and feedback.
- User Feedback: Implement mechanisms to collect and act on user feedback.
- Continuous Improvement: Regularly review and refine your reports and dashboards. Are they still providing value? Are there new data sources or metrics that should be incorporated?
Building Automated Reports in Spreadsheet with Live Data and Notifications
Create powerful, self-updating reports that keep your team informed with real-time data. This guide will show you how to build an automated “Win Rate” report using Coefficient, but the principles apply to various metrics and data sources.
Create powerful, self-updating reports that keep your team informed with real-time data. This guide will show you how to build an automated “Win Rate” report using Coefficient, but the principles apply to various metrics and data sources.
Step 1: Set Up Data Connection
- Open your spreadsheet and launch the Coefficient add-on.
- Click “Import Data” and select your data source (e.g., Salesforce, HubSpot).
- Authenticate and connect your account.
Step 2: Import Live Data
- Choose “From Objects & Fields” in Coefficient.
- Select relevant fields (e.g., deal status, value, close dates).
- Set up filters or use custom queries to refine your data import.
Step 3: Design Your Report
- Use spreadsheet functions to calculate key metrics (e.g., win rate = won deals / total deals).
- Create pivot tables to analyze data by different dimensions (time periods, sales reps, etc.).
- Add charts and graphs to visualize trends.
Step 4: Automate Data Refresh
- In Coefficient, set up scheduled data refreshes (e.g., daily, hourly).
- Configure refresh settings to update specific ranges or entire sheets.
Step 5: Implement Notifications
- Use Coefficient’s alert feature to set up notifications.
- Configure alerts based on data changes or specific thresholds.
- Choose notification channels (email, Slack) for different team members.
Watch Our Video Tutorial: See how Mutiny leverages Coefficient for their marketing analytics. Learn to build a powerful demand generation dashboard that tracks lead progression and open opportunities.
https://www.youtube.com/watch?v=y1xsc2fAKRI
Benefits of Automated Reporting
Automated reporting offers a wealth of advantages that can transform how organizations handle data and make decisions. Let’s explore these benefits in detail:
Time and Cost Savings
Automated reporting significantly reduces the time and resources required for report creation and distribution:
- Eliminate manual data entry: Save hours of tedious work and reduce the risk of human error.
- Streamline report generation: What once took days can now be accomplished in minutes.
- Reduce IT dependence: Empower business users to create and modify reports without constant IT support.
Increased Productivity
By freeing up time previously spent on manual reporting tasks, teams can focus on analysis and strategic initiatives.
Improved Data Accuracy and Consistency
Automated reporting minimizes human error and ensures data integrity:
- Eliminate manual data entry errors: Reduce the risk of typos and incorrect calculations.
- Ensure consistent calculations: Apply standardized formulas across all reports.
- Maintain data lineage: Easily trace data back to its source for validation and auditing.
- Real-time updates: Always work with the most current data available.
Enhanced Real-Time Decision Making
Access to up-to-date information empowers quick, data-driven decisions:
- Instant access to critical metrics: Monitor KPIs in real-time to identify trends and issues.
- Rapid response to market changes: Adjust strategies based on the latest data.
- Improved forecasting: Use real-time data to make more accurate predictions.
- Data-driven culture: Foster an environment where decisions are backed by current, reliable data.
Better Collaboration and Accessibility
Automated reporting breaks down data silos and improves information sharing:

Stop exporting data manually. Sync data from your business systems into Google Sheets or Excel with Coefficient and set it on a refresh schedule.
Get Started
- Centralized reporting: Create a single source of truth for all stakeholders.
- Self-service capabilities: Allow team members to access and customize reports as needed.
- Cross-functional alignment: Ensure all departments work with the same, up-to-date information.
- Remote accessibility: Access reports from anywhere, supporting distributed teams.
Improved Compliance and Audit Trails
Automated reporting enhances regulatory compliance and simplifies auditing processes:
- Standardized reporting: Ensure consistent compliance with regulatory requirements.
- Detailed audit trails: Maintain logs of all report accesses, changes, and distributions.
- Version control: Track changes to reports over time for accountability.
- Data governance: Implement and enforce data access policies more effectively.
Free Automated Reporting Dashboards
To help you get started with automated reporting, we’ve created free dashboard templates for various business functions. These templates are designed to work seamlessly with Coefficient, allowing you to connect your data sources and create powerful, automated reports quickly.
Marketing
CMO Dashboard Template
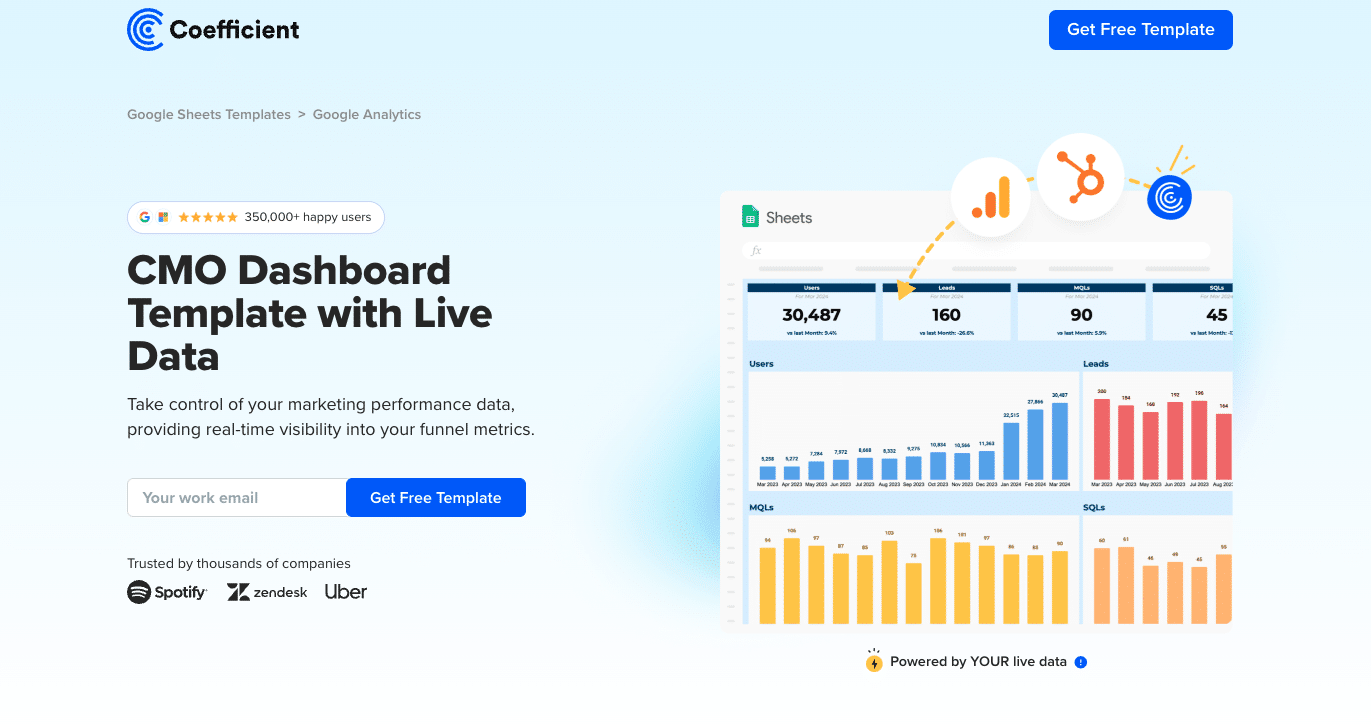
This template empowers you to take control of your marketing performance data, providing real-time visibility into your funnel and cost-efficiency metrics.Ready to elevate your marketing analytics? Download Coefficient’s free marketing dashboard template and start optimizing your campaigns today.
Finance
SaaS Financial Model
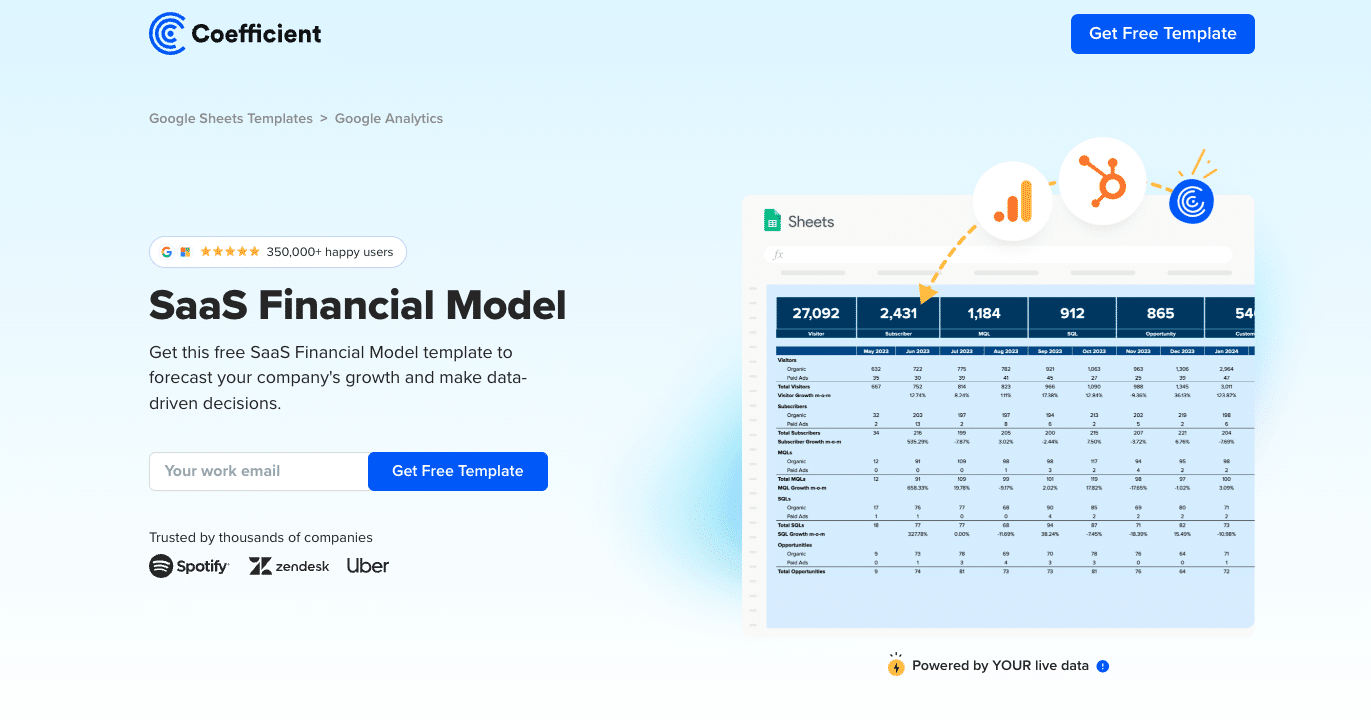
This template unifies key metrics from GA4, HubSpot, Chargebee/Stripe, and QuickBooks, providing a comprehensive view of your business’s performance. It helps you track growth, pinpoint bottlenecks, and forecast long-term financial health.
Consolidate your SaaS metrics into one Google Sheets dashboard.
Customer Success
Customer Health Dashboard

This dashboard integrates critical customer health metrics into your business strategy. Track customer engagement levels, satisfaction, and churn risk to enhance customer retention and satisfaction.
Download the Customer Health Dashboard to stay ahead of customer needs
For more dashboards, check out this article.
Sales
Outreach Sequence Performance
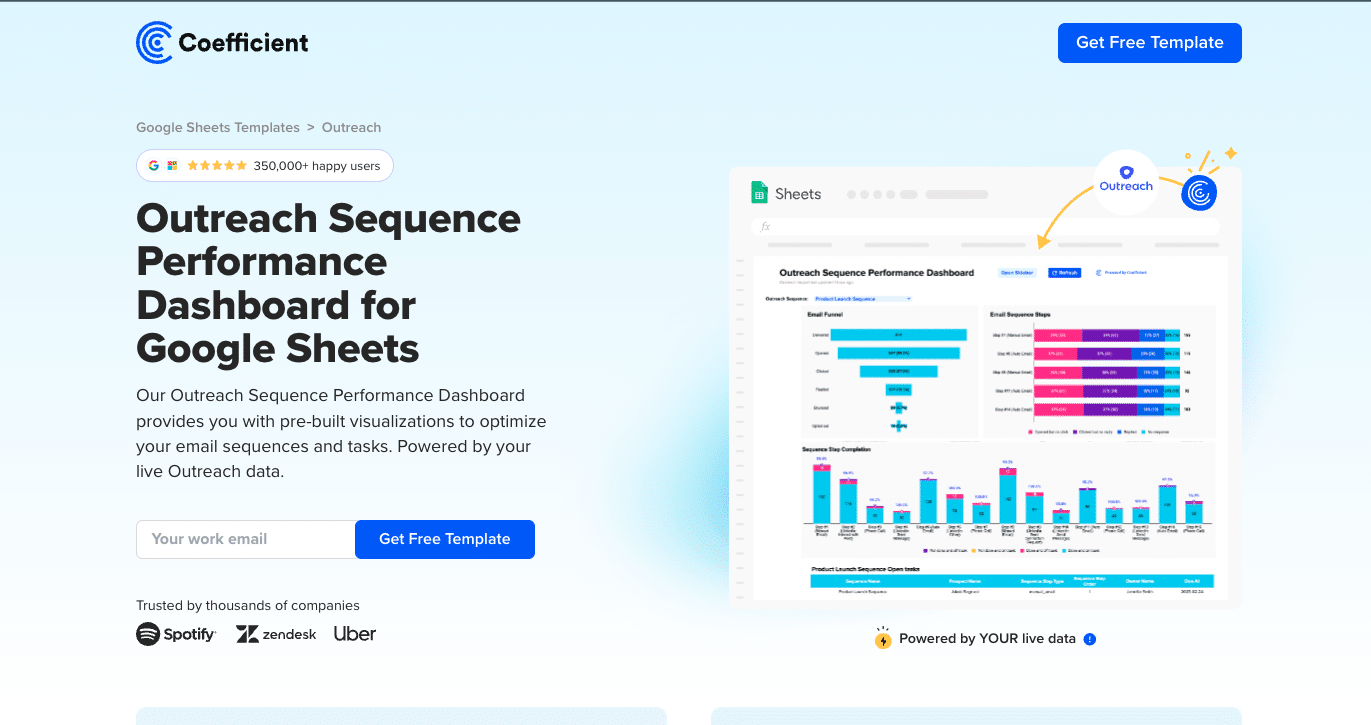
This dashboard helps you monitor and optimize your email sequences. It tracks high-level metrics for your email funnel, sequence steps, and open tasks directly within Google Sheets.
Download the Outreach Sequence Performance Calculator to enhance your email marketing efforts.
Social Media
Social Media Dashboard Template
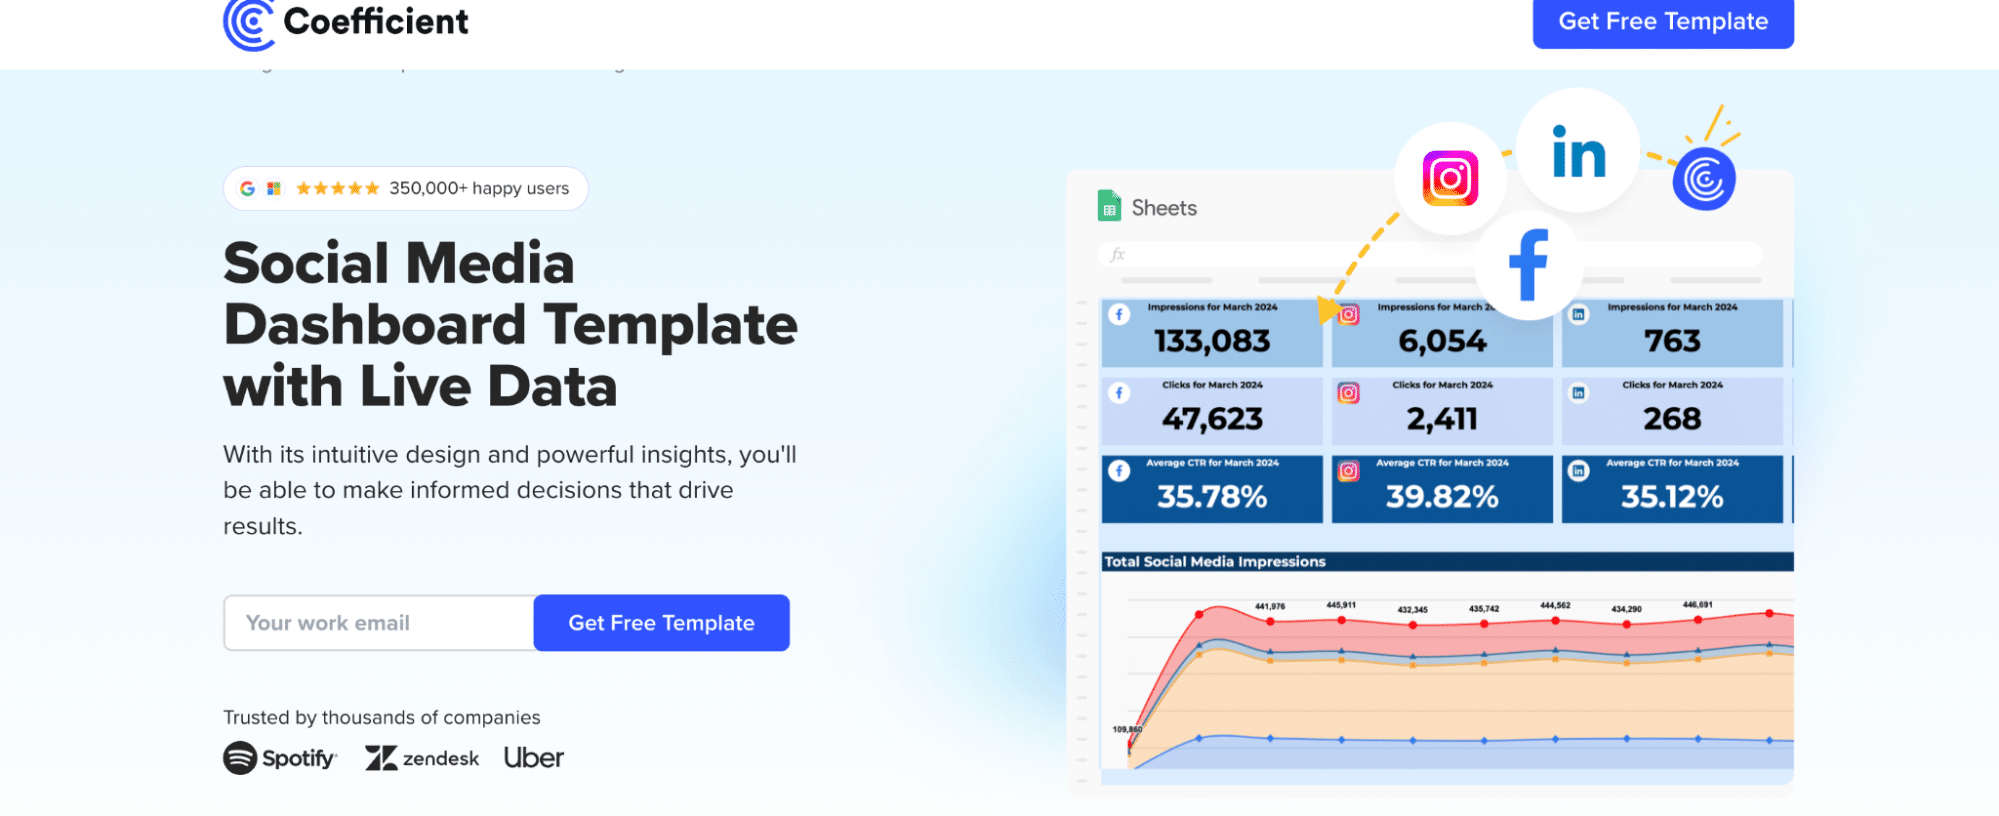
This template allows you to gain a comprehensive view of your social media performance. It helps you track essential metrics like page impressions, clicks, and CTR across various social platforms such as Facebook, YouTube, LinkedIn, and Instagram.
Start optimizing your social media strategy today!
Advanced Customization in Automated Reporting
To truly harness the power of automated reporting, it’s essential to go beyond basic templates and tailor your reports to your organization’s specific needs. Let’s explore advanced customization options that can take your reporting to the next level.
Custom Report Templates
Design templates that reflect your brand and meet your unique reporting requirements:
- Branded design elements: Incorporate your company’s color scheme, logos, and fonts for a professional, consistent look.
- Industry-specific metrics: Create custom calculations and KPIs relevant to your sector.
- Role-based layouts: Design different views for executives, managers, and operational staff.
Dynamic Data Sources
Leverage multiple data sources in real-time to create comprehensive, up-to-date reports:
- Multi-source integration: Combine data from various systems (e.g., CRM, ERP, marketing automation) for a holistic view.
- Real-time data refresh: Set up automated data pulls to ensure your reports always reflect the latest information.
- Data transformation rules: Implement custom logic to clean, normalize, and enrich your data as it’s imported.
User-Specific Dashboards
Tailor dashboards to individual users or roles for more relevant and actionable insights:
- Role-based access control: Ensure users only see data relevant to their position and permissions.
- Personalized KPIs: Allow users to select and prioritize the metrics most important to them.
- Customizable views: Enable users to adjust layout, timeframes, and visualization types.
Challenges of Automated Reporting
Data Security and Compliance
As automated reporting systems often consolidate and distribute sensitive information across an organization, they can become prime targets for data breaches. Moreover, with evolving data protection laws, ensuring compliance becomes increasingly complex.
The solution:
- Implement robust access controls, encryption protocols, and audit trails
- Stay updated on data protection regulations (GDPR, CCPA, etc.) and ensure compliance
- Use data masking and tokenization for sensitive information
- Implement multi-factor authentication for report access
Data Quality and Governance
Automated systems can propagate errors at scale if data quality is poor. This can result in flawed analyses and potentially costly business decisions based on inaccurate information.
The solution:
- Establish a comprehensive data governance framework
- Implement data quality checks and validation processes at each stage of the data pipeline
- Use data lineage tools to track data from source to report
- Develop a data dictionary and metadata management system
- Regular data audits and cleansing processes
User Adoption and Change Management
Introducing new automated reporting systems often requires significant changes in work processes. Resistance to change and lack of proper training can lead to low adoption rates, undermining the investment in automation.
The solution:
- Invest in user training and intuitive UI/UX design
- Implement a change management strategy for rolling out new reporting systems
- Gather and act on user feedback continuously
- Identify and nurture “power users” to champion the system
- Align automated reporting initiatives with broader organizational goals
Data Literacy and Interpretation
As data becomes more complex and abundant, the ability to correctly interpret and act on data-driven insights becomes crucial. Lack of data literacy across an organization can lead to missed opportunities or misguided strategies.
The solution:
- Develop data literacy programs across your organization
- Provide context and explanations alongside metrics and visualizations
- Offer in-app guidance and tooltips for complex analyses
- Create a centralized knowledge base for report interpretation and best practices
Role of AI and Machine Learning
While AI and ML can provide powerful insights, they can also introduce complexities that are difficult for non-technical users to understand. This can lead to blind trust in AI-generated reports or, conversely, skepticism and underutilization of potentially valuable insights.
The solution:
- Ensure transparency in AI-driven insights by providing clear explanations of methodologies used
- Implement “explainable AI” techniques to break down complex algorithms into understandable components
- Provide training on interpreting AI-generated reports, including understanding confidence levels and potential biases
- Balance automated insights with human expertise, encouraging critical thinking and domain knowledge application
- Develop a framework for regularly auditing AI-driven insights to ensure accuracy and relevance
Future Trends in Automated Reporting
Predictive Analytics
What to expect:
- Integration of forecasting models into standard reports, allowing users to see not just what happened, but what’s likely to happen next
- Real-time predictive insights based on current data, enabling proactive decision-making
- Scenario modeling capabilities that allow users to test “what-if” situations and their potential outcomes
How to prepare:
- Invest in data science capabilities, either by upskilling current team members or hiring specialists
- Identify key areas where predictive insights could drive value, such as sales forecasting, inventory management, or customer churn prediction
- Develop a strategy for integrating predictive models into decision-making processes, including change management plans
- Establish protocols for validating and updating predictive models to ensure ongoing accuracy
Natural Language Processing
What to expect:
- The ability to query your data using plain language, making data exploration accessible to non-technical users
- Automated generation of narrative insights from data, providing context and explanation alongside numbers
- Voice-activated reporting and analytics, enabling hands-free data interaction
How to prepare:
- Explore NLP-ready BI tools and evaluate their fit with your organization’s needs
- Train your team on effective query formulation to get the most out of NLP systems
- Develop a comprehensive taxonomy of business terms and metrics to ensure accurate NLP interactions
- Consider the implications for data governance and security when implementing conversational analytics
Augmented Analytics
What to expect:
- AI-driven insights that guide users to important findings, reducing the time spent on data exploration
- Automated data preparation and feature engineering, streamlining the analysis process
- Intelligent recommendations for data visualization and analysis techniques based on the data type and user goals
How to prepare:
- Look for BI tools with built-in augmented analytics capabilities and assess their alignment with your reporting needs
- Develop guidelines for blending human expertise with AI-generated insights to ensure critical thinking is still applied
- Train analysts on how to effectively use and validate augmented analytics outputs, including understanding the limitations
- Establish processes for continuously feeding back human insights to improve the AI’s recommendations over time
Automate Your Reporting Workflows with Coefficient
Automated reporting has become an essential tool for data-driven organizations. By streamlining the reporting process, improving data accuracy, and enabling real-time insights, automated reporting empowers businesses to make faster, more informed decisions.
Ready to revolutionize your reporting process? Experience the power of automated reporting with live data integration by trying Coefficient today. Get started with Coefficient and transform your data into actionable insights that drive business success.


