
The category called AI reporting tools covers a lot of ground in 2026. Marketing agency platforms that automate client dashboards sit in the same search results as warehouse-native BI tools, LLMs that generate a chart from a pasted CSV and desktop automation tools that run multi-step file workflows. They are not the same thing, and evaluating them as if they are is how teams waste two months on a tool that was never built for their problem.
This guide segments the category honestly. Four types of tools get the AI reporting label in 2026. Each solves a different problem for a different team. The right one depends on where your data lives, who consumes the output and whether you need the report to update itself or just look good once.
What AI Reporting Actually Means in 2026
Three capabilities separate tools that genuinely use AI for reporting from ones that badge it on without changing the workflow.
Live data connectivity. The tool pulls from source systems on a schedule, not from a file you uploaded last week or a paste you made into a chat window. From a connected source that refreshes automatically. If the data behind the report is only as current as the last time someone manually imported something, the AI label is doing a lot of work.
AI that builds the structure, not just suggests it. The AI writes the query, creates the chart, assembles the layout and names the metrics. You describe what you want and the output appears. If the AI’s contribution is a list of recommendations you then have to execute yourself in another tool, that is an AI assistant, not an AI reporting tool.
Output that survives the week. The report updates when the data changes without someone re-running a prompt or rebuilding a dashboard. Automated refresh on a server, not on someone’s laptop, is the difference between a reporting tool and a one-time output.
Four Types of AI Reporting Tools
General AI tools are where most teams start. Claude, ChatGPT and similar LLMs can take data you paste in and generate a chart or a summary. Fast to try, no setup required. The limitations are structural and not fixable with better prompting, which the tools section covers below. Anthropic’s Cowork desktop tool extends this further, letting non-technical users automate multi-step file and task workflows on their local machine. Still session-based for reporting, but useful for one-off data preparation tasks before feeding output into a connected tool.
Marketing reporting tools are built specifically for agencies and marketing teams. They connect to ad platforms, analytics tools and social channels, automate report generation and format output for client delivery. They are not designed for CRM data, ERP connectivity or finance workflows.
AI dashboard builders connect to live business systems and turn plain-English prompts into shareable web dashboards. The data refreshes automatically. The output is a live URL. This is the category closest to what most people mean when they say they want an AI reporting tool that actually works.
AI-assisted BI platforms are traditional BI tools with conversational AI features added. They are powerful for organizations with data engineering resources. They are not self-serve for a RevOps manager who needs a pipeline dashboard by Monday without filing a ticket.
General AI tools
This category comes first because it is where most people start, and because understanding why it is not a recurring reporting tool saves teams weeks of wasted effort.
Claude and ChatGPT
Both tools can take data you paste in, accept a plain-English description of what you want and return a chart or a summary. The first output is usually impressive enough that someone screenshots it and posts it in Slack. The problems are structural and arrive reliably within two to three weeks.
There is no data connection. Every session starts from scratch. When you want an updated report, you re-upload the data, re-explain the context and re-run the prompt. That is manual reporting with an AI aesthetic, not automation.
Numbers are derived, not queried. A language model predicts the next token. It does not run a SQL query against your Salesforce instance. The number it produces is the most statistically plausible given your context, which is different from the correct number pulled from a verified source. That gap matters when the output goes to a CRO or a CFO.
The dashboard has no refresh. When a deal closes in Salesforce, the LLM-generated pipeline chart does not update. It stays as it was when you last ran the prompt. That is a static report with no maintenance path.
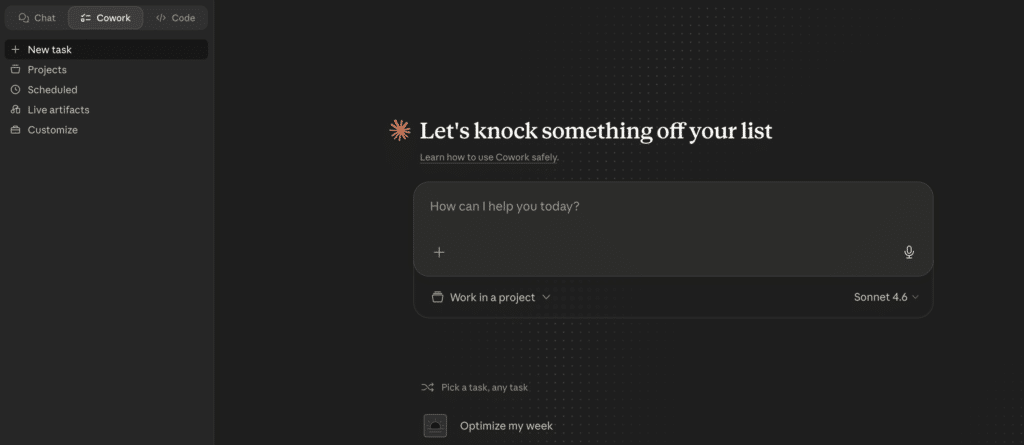
Anthropic’s Cowork desktop tool takes this a step further for non-technical users. Rather than a single chat session, Cowork can run multi-step agentic workflows on your local machine: organizing folders of exported reports, processing CSVs, compiling data from multiple files into a structured document. It is genuinely useful for data preparation before feeding output into a connected reporting tool. It does not solve the live data connection problem or the automatic refresh problem. Think of Cowork as a capable colleague who can organize and process files you hand them, not one who is subscribed to your Salesforce data.
If the use case is a one-time analysis or file preparation task, these tools are genuinely useful. If the use case is recurring reporting that leadership can trust week over week, the structural limits apply regardless of which model version you use.
Marketing reporting tools
These tools are purpose-built for marketing teams and agencies. They connect to ad platforms, analytics tools and social channels, automate report generation and handle client-facing delivery. They are the right answer for the specific problem they solve and the wrong answer for everything outside that scope.
Whatagraph
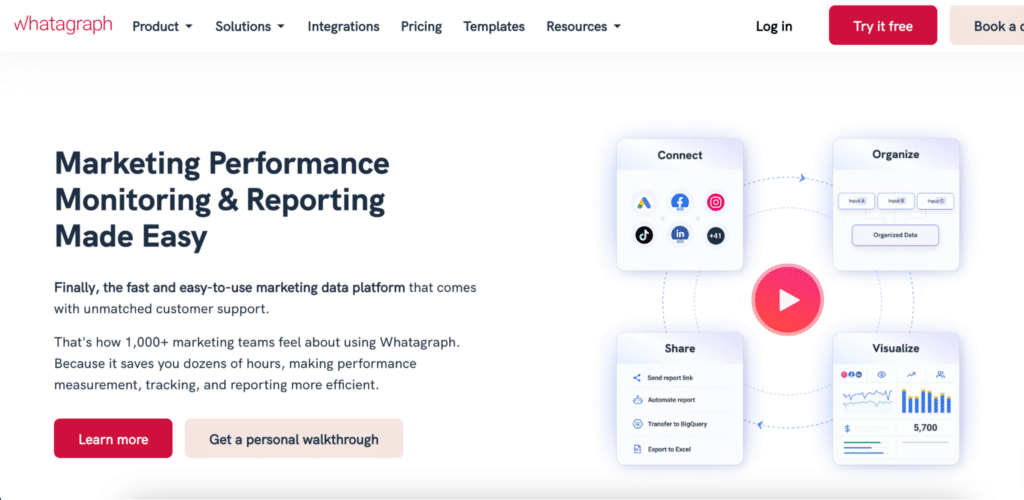
Whatagraph is a marketing reporting platform built for agencies managing multiple clients across multiple channels. It connects to 50+ marketing data sources, generates white-labeled reports automatically and sends them to clients on a schedule. AI features surface anomalies and generate plain-language summaries of performance changes. The design quality of the output is a genuine differentiator: reports look polished without manual formatting. Paid plans start at $229 per month on annual billing. Limitation: reporting only, no two-way sync, no ERP or CRM connectivity beyond marketing data. Best for: mid-to-large marketing agencies that need automated, white-labeled client reporting across ad and analytics platforms. Whatagraph pricing.
AgencyAnalytics
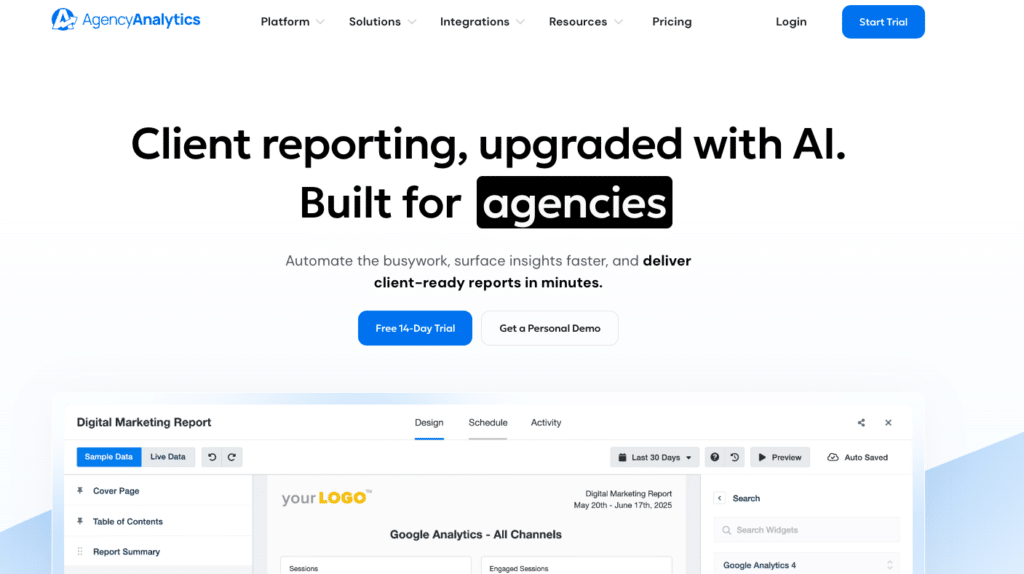
AgencyAnalytics is a client reporting platform for smaller agencies and freelancers. It connects to 80+ marketing integrations including Google Analytics, Meta Ads and SEO tools, and generates automated reports on a schedule. Pricing is based on the number of clients: the Freelancer plan starts at $59 per month for up to 5 clients. AI features assist with report generation and anomaly flagging. Limitation: scales expensively beyond 15 clients, no non-marketing data connectors, not designed for internal team reporting. Best for: small agencies and freelancers that need automated client reporting without a large platform investment. AgencyAnalytics pricing.
DashThis
DashThis is a straightforward marketing dashboard tool that connects to 34+ marketing platforms and presents KPIs visually. Setup is fast and the interface is simple enough for non-technical marketers. Pricing is based on the number of dashboards rather than users: plans start at $49 per month for 3 dashboards. Limitation: 34 connectors is a narrower set than competitors, no AI-generated insights or summaries. Best for: small marketing teams that need clean, shareable dashboards from a limited set of marketing sources without complex configuration. DashThis pricing.
Klipfolio
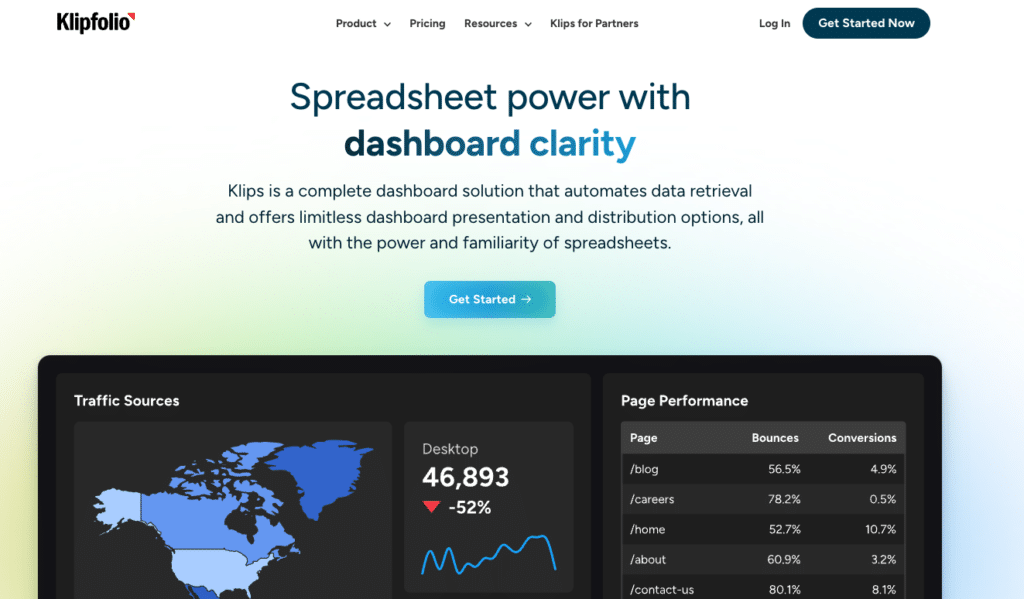
Klipfolio offers two distinct products. Klips is a dashboard builder with formula-level control over how metrics are calculated and displayed. PowerMetrics is a metric warehouse product that centralizes and standardizes KPI definitions across teams. AI Insights, added in 2026, automatically flags trend anomalies across connected metrics. Base plan for Klips starts at $90 per month on annual billing. PowerMetrics pricing is available on request. Limitation: steeper learning curve than other marketing tools in this category, less suited for one-click client report generation. Best for: data teams and marketing ops that want formula-level control over dashboards and a shared metric definitions layer. Klipfolio pricing.
AI dashboard builders
This is the category that closes the gap between what general AI tools demonstrate and what teams actually need for recurring, trusted reporting. The tools here connect to live data, build dashboards from plain-English prompts and produce shareable output that updates automatically.
Coefficient
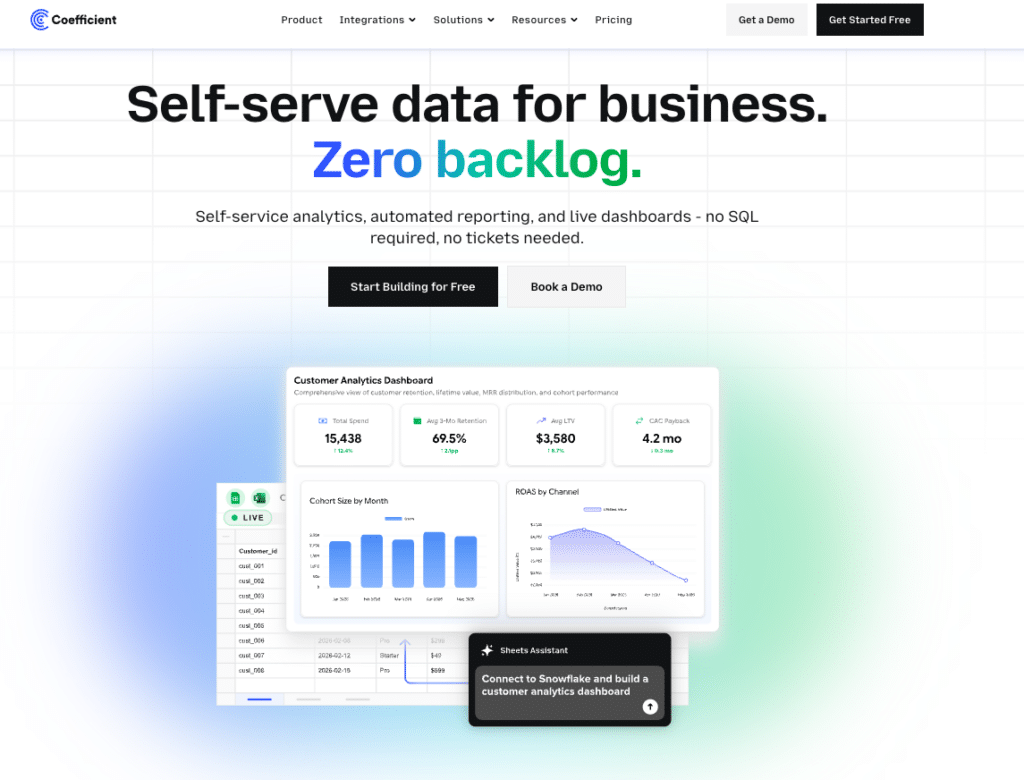
Coefficient connects 150+ data sources directly to Google Sheets or Excel, then builds live, shareable web dashboards from that data using plain English. The workflow: connect your source, Salesforce, HubSpot, NetSuite, Snowflake, QuickBooks and more, describe the dashboard, and AI builds it while writing the SQL query behind every metric. The Explain button shows which tabs and columns each figure comes from. No hallucinated numbers in front of leadership.
Server-side scheduled refresh means the dashboard is current every morning without anyone touching it. Viewers access a live URL for free with no per-seat licensing. Two-way sync means corrections push back to source systems from the spreadsheet. Slack and email previews distribute updates automatically when data changes.

Supercharge your spreadsheets with GPT-powered AI tools for building formulas, charts, pivots, SQL and more. Simple prompts for automatic generation.

For RevOps and finance teams that rebuilt the same report every week, this is the direct fix. See dashboard examples across finance, pipeline and marketing use cases.
Limitation: requires Google Sheets or Excel as the data layer. Not a standalone BI platform. Free plan available. Paid from $49 per month. No per-user fees.
“Our CEO couldn’t believe how clean it looked. He wants this for every department.” James Roland, Ready Education
“I never worry about reports being up-to-date and accurate anymore. At this point, after setting it up, Coefficient does most of the heavy lifting.” Brian Chalif, Head of BizOps, Mutiny
Equals
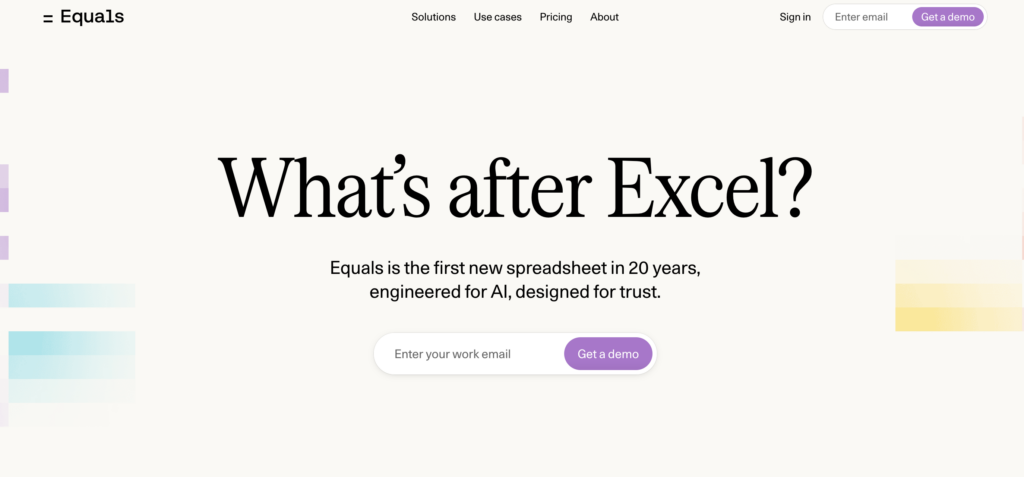
Equals is a browser-based spreadsheet platform that connects directly to Snowflake, BigQuery, Redshift, Salesforce and HubSpot, keeping every spreadsheet live as the underlying data updates. Any spreadsheet can be turned into a shareable dashboard, with scheduled Slack or email delivery each morning. The AI Assist feature generates formulas, summaries and chart recommendations from plain-English descriptions. Writeback capability lets you edit records in Equals and push changes back to Salesforce or HubSpot directly. Plans start at $18 per user per month. Limitation: works best for teams already on a warehouse like Snowflake or BigQuery. Less suited for teams whose data lives primarily in a CRM or ERP without a warehouse layer in between. Best for: RevOps and finance teams at fast-scaling companies that want spreadsheet-style analysis on top of live warehouse data, with automated dashboard distribution built in. Equals pricing.
AI-assisted BI platforms
These are traditional BI platforms with conversational AI features added. They are not self-serve reporting tools for business users without technical support. They are governed analytics platforms with AI features that reduce, but do not eliminate, the data engineering requirement. They belong in this list because many teams consider them when searching for AI reporting tools.
Power BI with Copilot
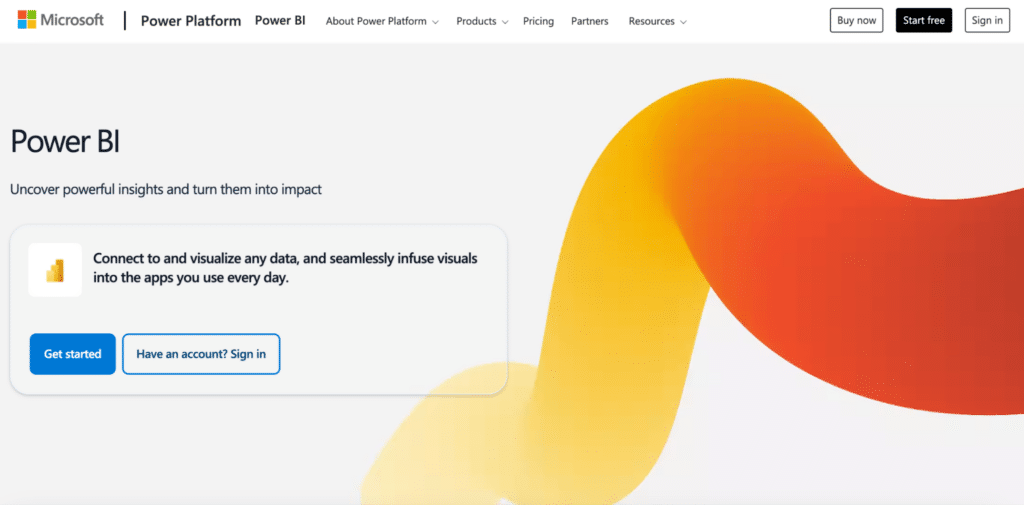
Power BI is the default BI choice for Microsoft-heavy organizations. The Copilot feature adds conversational report generation: describe a visual in plain English and Copilot generates it against your existing data model. Pro licensing runs $14 per user per month. The Copilot add-on costs $30 per user per month on top of that. For enterprise-scale analytics, Microsoft Fabric starts at around $8,000 per month for the F64 tier. Limitation: every viewer needs a paid seat, setup requires data modeling by an analytics team, and Copilot output quality depends on the cleanliness of the underlying data model. Best for: Microsoft-heavy organizations with analytics resources and an existing Power BI investment. Power BI pricing.
ThoughtSpot
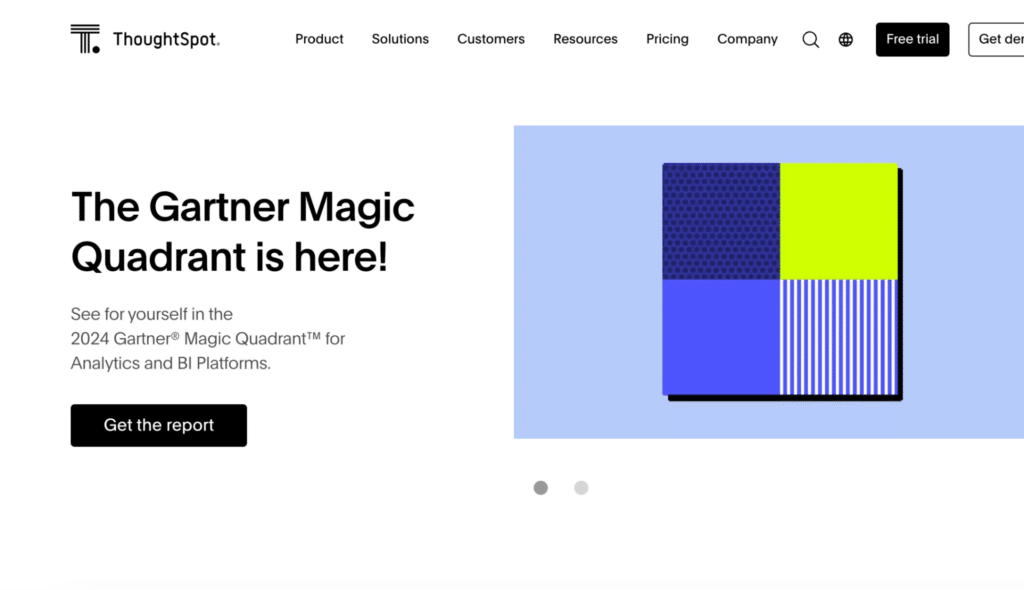
ThoughtSpot uses a search-driven model: type a business question and get a chart. The Spotter AI assistant extends this with conversational follow-ups and automated insight detection. It connects to Snowflake, BigQuery, Databricks and other warehouse sources. Essentials plan starts at $25 per user per month. Pro starts at $50 per user per month. Limitation: requires clean, well-modeled warehouse data and engineering resources to maintain. Messy schemas produce poor search results. Best for: enterprises with data engineering teams and well-governed warehouse data who want self-serve analytics at scale. ThoughtSpot pricing.
Tableau with AI
Tableau remains one of the strongest platforms for data visualization and exploration. Tableau Pulse and Tableau Agent add AI-generated insights and natural language dashboard generation on top of the existing platform. Creator licenses start at $75 per user per month, Explorer at $42 and Viewer at $15, all annual. Limitation: getting clean, connected data into Tableau requires upstream data preparation that most business users cannot own independently. Every viewer needs a paid seat. Best for: organizations with a dedicated data team that builds and maintains the pipelines, with business teams consuming the output. Tableau pricing.
Comparison Table
| Tool | Category | Live Data Connection | Built For | Starts At |
|---|---|---|---|---|
| Claude or ChatGPT | General AI | No, session-based | One-time analysis, not recurring reports | Free tier available |
| Cowork (Anthropic) | Desktop automation | No, local file access only | Non-technical users automating file and task workflows | Included with Claude Pro or Max |
| Whatagraph | Marketing reporting | Yes, 50+ marketing sources | Marketing agencies, client reporting | $229/month (annual) |
| AgencyAnalytics | Marketing reporting | Yes, 80+ marketing sources | Small agencies and freelancers | $59/month (5 clients) |
| DashThis | Marketing reporting | Yes, 34+ marketing sources | Small marketing teams | $49/month (3 dashboards) |
| Klipfolio | Marketing reporting and BI | Yes, multiple sources | Data-savvy marketing and ops teams | $90/month (Klips Base) |
| Coefficient | AI dashboard builder | Yes, 150+ business sources | RevOps and finance teams in Sheets or Excel | Free plan. Paid from $49/month. No per-user fees. |
| Equals | AI dashboard builder | Yes, warehouse and CRM sources | RevOps and finance teams on Snowflake or BigQuery | $18/user/month |
| Power BI with Copilot | AI-assisted BI | Yes, with data modeling | Microsoft-heavy orgs with analytics teams | $14/user/month Pro plus $30 Copilot add-on |
| ThoughtSpot | AI-assisted BI | Yes, warehouse-native | Enterprises with data engineering resources | From $25/user/month |
| Tableau with AI | AI-assisted BI | Yes, with data engineering | Orgs with dedicated data teams | $75/user/month (Creator, annual) |
How to Pick the Right One
The question is not which tool has the best AI features. It is which problem you are actually trying to solve.
You manage marketing clients and need automated reporting across ad and analytics platforms
AgencyAnalytics at $59 per month covers most small agencies. Whatagraph is worth the premium if report design quality matters to your clients. DashThis works for simple, clean dashboards from a smaller connector set.
Your team is in Google Sheets or Excel and needs live CRM, ERP or warehouse data in shareable dashboards
Coefficient is the direct answer. Connect your sources, describe the dashboard, share the URL. The spreadsheet stays as the data layer, the web dashboard is the distribution layer, and the refresh runs on a server. Free plan available.
Your organization has a data warehouse, an analytics team and governance requirements
ThoughtSpot or Tableau with AI are worth evaluating. Both require data engineering investment upfront. Budget for setup time, modeling work and per-viewer licensing at scale.
You want to try AI reporting before committing to a tool
Start with Claude or ChatGPT using data you already have. For preparing files and organizing exported data before connecting to a proper reporting tool, Cowork handles multi-step file automation tasks without any coding. Plan on moving to a connected tool when the manual re-running becomes the bottleneck, which typically happens within the first month.
AI reporting tools are not interchangeable. The one that works for a marketing agency tracking ad spend across 20 clients is not the one that works for a RevOps manager building a pipeline report for a CRO. The category is wide. The right tool for any given team is narrow. Start with the use case, match the category, then evaluate the tools within it.
If the use case is live connected data in shareable dashboards without a BI tool or a data team, Coefficient is free to start.


