

Almost every major BI platform now has AI features. Natural language queries, anomaly detection, AI-generated chart summaries, agentic analysis agents. The question in 2026 is not whether a tool has AI. It is whether the AI in that tool is actually useful for the team evaluating it.
The market pressure to add that AI label is real. The global BI market reached $41.16 billion in 2026 and is projected to climb to $62.38 billion by 2031. Self-service BI adoption has grown 31% year-over-year as business teams demand direct data access without routing every question through a data team. At the same time, only 32% of business leaders believe they can actually generate value from their enterprise data. The gap between buying BI and using it effectively is where most teams get stuck.
A RevOps manager who needs a pipeline dashboard by Monday and a data engineer building a governed semantic layer for 500 business users are not evaluating the same product. Selling them both the same tool is how vendor marketing works. This guide does not work that way.
The tools below are segmented by who they are actually built for, with honest trade-offs that vendor pages leave out. Pricing is verified as of May 2026.
What Separates Real AI BI from AI-Washed BI
Every BI platform added a chat interface in 2024 and 2025. Not all of them changed what the tool fundamentally does. Three things separate genuine AI BI from a natural language widget bolted onto a dashboard builder.
The AI writes the query, not just the title. In genuine AI BI, you ask a business question in plain English and the platform translates it into a SQL query that runs against your data. The query is transparent and inspectable. In AI-washed BI, the chat interface renames a dashboard or generates a text summary of a chart you already had to build manually.
The output is auditable. A metric generated by AI inference is not the same as a metric pulled from a verified query. For finance teams, RevOps teams and anyone putting numbers in front of a board, every figure needs a traceable source. Tools that cannot show you where a number came from are not enterprise-grade BI regardless of how many AI features they list.
Business users can self-serve without engineering support. If getting value from the AI requires a data engineer to first build and maintain a semantic layer, define business terms and clean the schema, the AI is an enhancement for technical teams, not a democratization tool for business users. Both have value, but they are different products for different buyers.
The Real Split in AI BI in 2026
The BI market in 2026 has two genuinely different categories that both get called AI BI. Understanding which one you need is more useful than evaluating features.
Warehouse-native BI connects directly to Snowflake, BigQuery, Databricks or Redshift and runs live queries against governed data. It is built for data teams and organizations with engineering resources to model the data and manage the platform. The AI features are powerful because they sit on top of clean, governed data. The setup cost is real and the ongoing maintenance requires dedicated resources.
Operational BI connects to the business systems where data actually originates: CRMs, ERPs, marketing platforms and finance tools. It is built for the operators, analysts and team leads who need live data without writing SQL or waiting for a data team ticket. The AI features focus on building reports and dashboards from plain-English descriptions rather than querying a warehouse. The setup is faster and the ongoing maintenance is lower, but the governance model is different.
Most teams end up with tools from both categories in their stack. Where it goes wrong is buying warehouse-native BI when the bottleneck is operational data access, or buying an operational tool when the requirement is enterprise-scale governed analytics.
General AI tools
ChatGPT & Claude
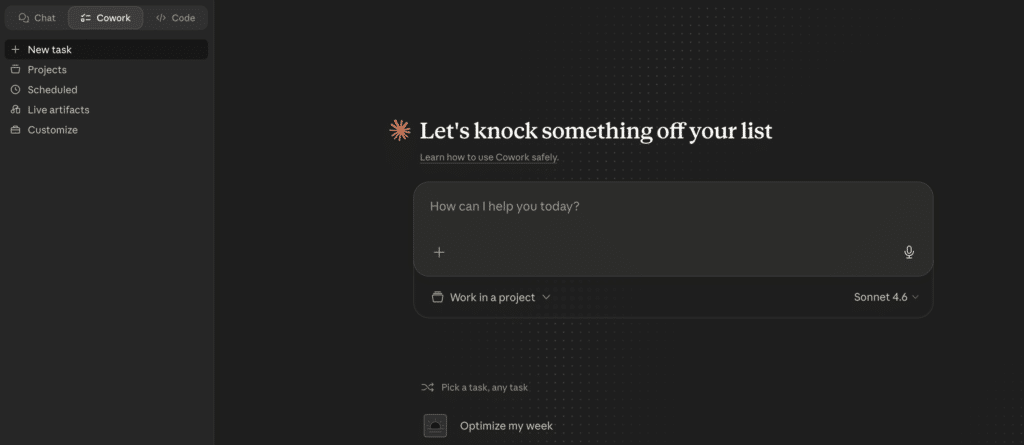
Before covering purpose-built BI tools, it is worth addressing where most teams actually start: asking Claude or ChatGPT to analyze a dataset. For one-time analysis of data you have on hand, these tools are genuinely capable. Paste in a CSV, ask a question and get a chart back in seconds. The conversation carries context across turns within the session.
The structural limits kick in at the point where BI actually begins: recurring analysis of live data. General AI tools have no persistent connection to your data sources, no scheduled refresh and no governed output that stakeholders can rely on week over week. They are a useful starting point for understanding what a report should look like, not a substitute for a connected BI tool. Most teams discover this within the first month of trying to use them for operational reporting.
Operational AI BI tools
These tools connect directly to the business systems where data originates and are built for operators, analysts and team leads who need live data without SQL or a data team ticket. The AI features focus on building and distributing reports from plain-English descriptions rather than querying a warehouse. Setup is faster, ongoing maintenance is lower and the primary user is the business operator, not the data engineer.
Zoho Analytics
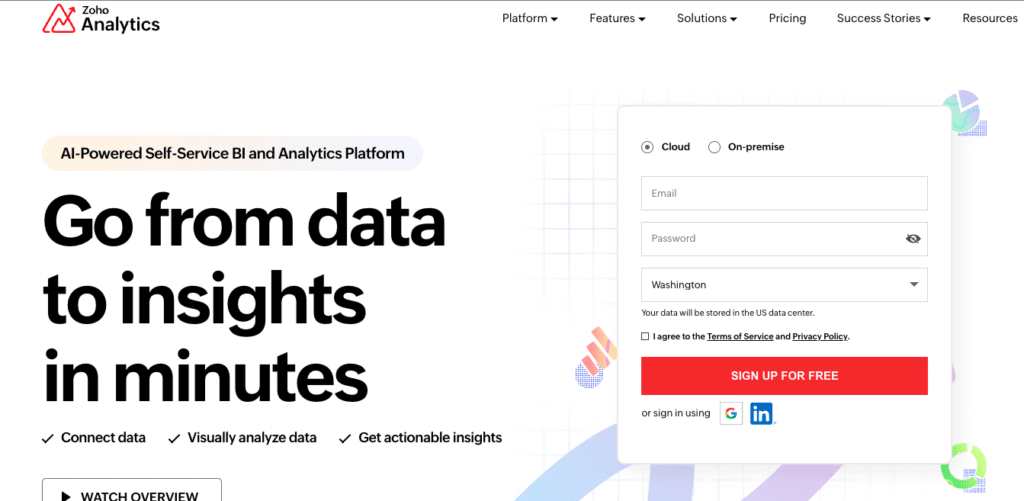
Zoho Analytics is the most accessible full-featured BI platform for small and mid-market teams. It connects to a wide range of data sources including CRMs, accounting tools and databases, and the Zia AI assistant answers natural language questions, generates insights automatically and flags anomalies without requiring a data model to be built first. Pricing starts at $30 per month for the Basic plan, with Standard at $60, Premium at $145 and Enterprise at $575 per month.
The user-friendly interface and affordable entry point make it a genuine option for teams that need BI capabilities without BI platform budgets. The main constraint is depth: for complex data modeling, custom semantic layers or embedded analytics at scale, teams tend to outgrow Zoho Analytics as they move upmarket.
Coefficient
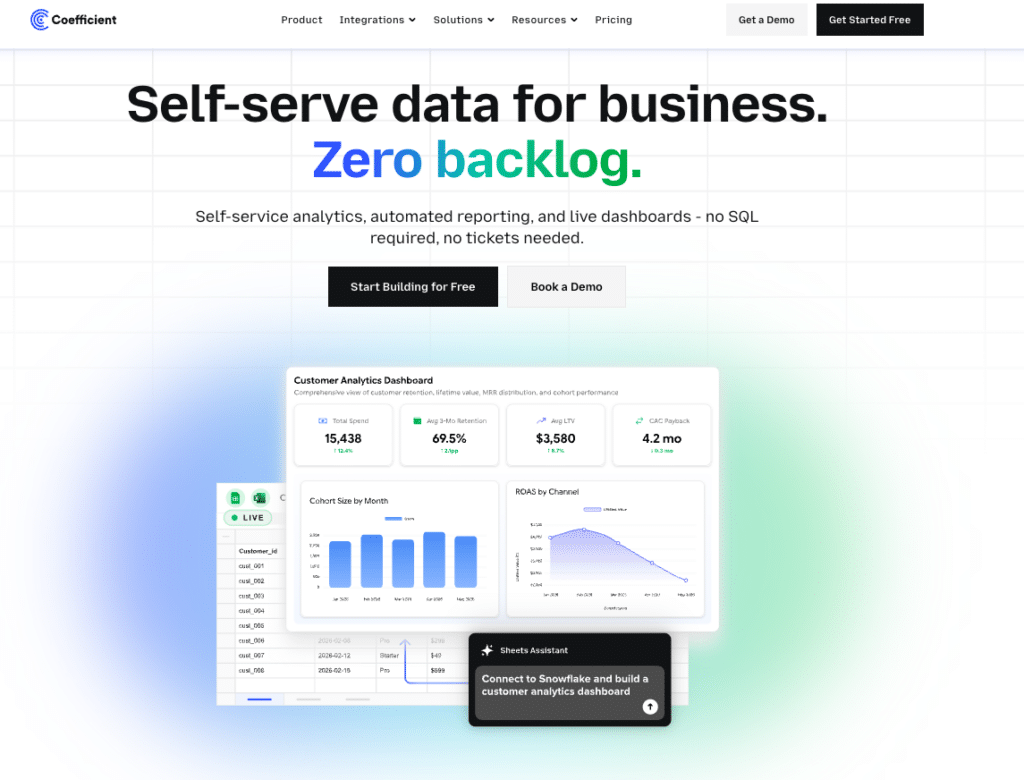
Coefficient takes a different approach from every other tool in this list. Rather than building a new analytics interface, it turns the spreadsheet your team already works in into a live, connected data layer. Connect 150+ data sources directly to Google Sheets or Excel, including Salesforce, HubSpot, NetSuite, QuickBooks and Snowflake, and the data refreshes automatically on a schedule without anyone touching it.
The AI layer works in two places. Sheets Assistant is built directly into Google Sheets and understands the actual columns and logic of your spreadsheet, building pivot tables, writing SQL and generating charts on request. On the distribution side, describing a dashboard in plain English produces a shareable web dashboard with SQL-backed numbers behind every metric.
The Explain button shows exactly which tabs and columns each figure comes from, which is what makes the output trustworthy enough to share with a CFO or a board. Viewers of the live dashboard URL get an Ask-AI sidebar to keep exploring the data conversationally without needing spreadsheet access, and server-side refresh means the dashboard is current every morning without anyone touching it.
Teams that have replaced their manual reporting cycles with Coefficient tend to describe the same outcome. The data is always current and the report builds itself.
“I never worry about reports being up-to-date and accurate anymore. At this point, after setting it up, Coefficient does most of the heavy lifting.” Brian Chalif, Head of BizOps, Mutiny
For data and analytics teams trying to make warehouse data accessible to non-technical users, the governance question is often the deciding factor. Coefficient’s SQL-backed output and source traceability address that directly.
“We had to move fast, iterate, and ensure data from Snowflake was accessible for non-technical users.” Evan Cover, Director of BI Engineering and Governance, Klaviyo
The constraint is: Coefficient is not a standalone BI platform and requires Google Sheets or Excel as the data layer. It is the right tool for RevOps and finance teams whose workflows already live in spreadsheets and who need live connected data, AI-built dashboards and shareable output without a BI stack or a data engineer. Free plan available. Paid from $49 per month with no per-user fees.
ThoughtSpot
ThoughtSpot is the most established name in search-driven analytics for business users. Type a question in plain English and get a chart back without touching SQL. The Spotter AI agent handles conversational follow-ups, automated anomaly detection and agentic analysis that surfaces insights proactively. Essentials plan starts at $25 per user per month and Pro at $50 per user per month, both billed annually.
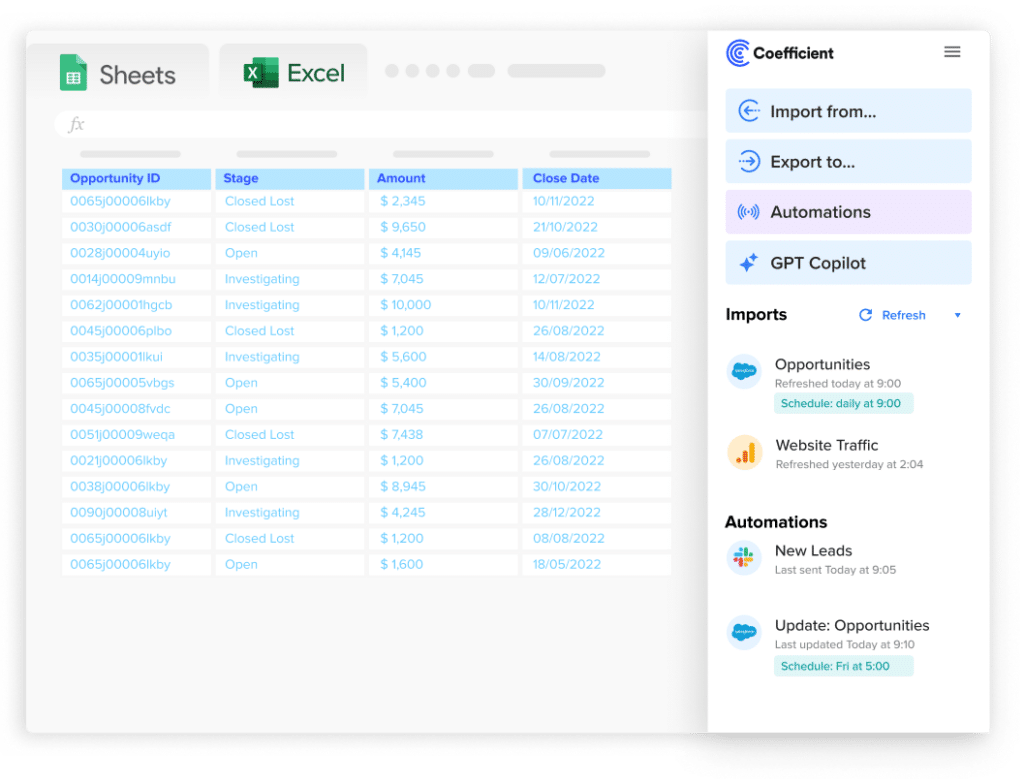
Stop exporting data manually. Sync data from your business systems into Google Sheets or Excel with Coefficient and set it on a refresh schedule.
Get Started
ThoughtSpot works best when the underlying data is clean and well-structured. It connects natively to Snowflake, BigQuery, Databricks, Redshift and Azure Synapse, which means a warehouse layer is still needed for most enterprise deployments. The self-serve experience for business users is genuinely strong when the data engineering foundation is in place.
Warehouse-native AI BI platforms
These platforms are built for organizations with a cloud data warehouse, a data engineering team and a need for governed, scalable analytics. They are the right choice when the primary problem is turning warehouse data into self-serve insights for large numbers of business users. They are not the right choice for teams that need live operational data from CRMs and ERPs without a warehouse layer in between.
Tableau with AI
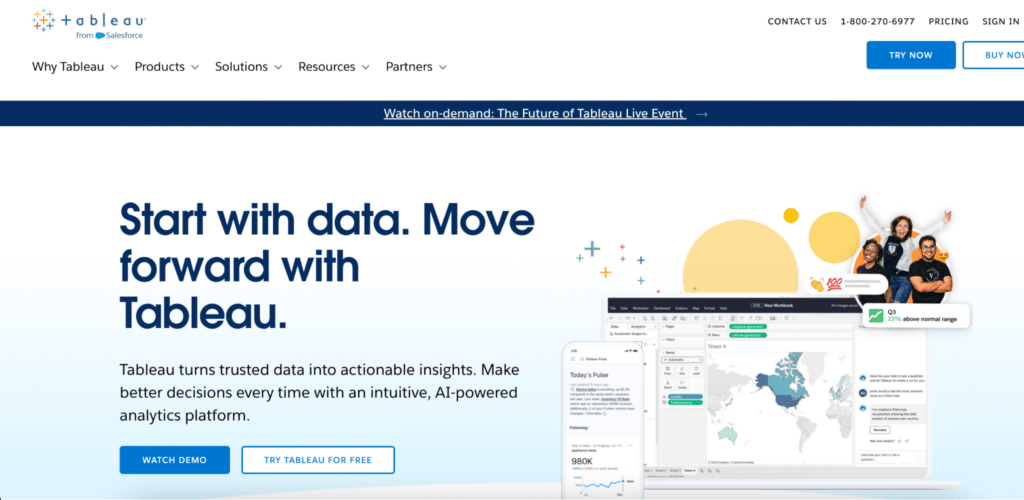
Tableau remains one of the strongest platforms for data visualization and exploration. Tableau Pulse delivers AI-generated insights and narrative summaries automatically, flagging anomalies and explaining metric changes without the analyst having to notice them first. Tableau Agent, now generally available in 2026, handles natural language dashboard generation on top of the existing platform. Creator licenses start at $75 per user per month, Explorer at $42 and Viewer at $15, all billed annually.
Tableau’s depth is also its constraint for teams without dedicated analytics resources. Getting clean, connected data into Tableau requires upstream data preparation that most business users cannot own independently. It is best suited to organizations with a data team that builds and maintains the pipelines, with business teams consuming the polished output.
Looker
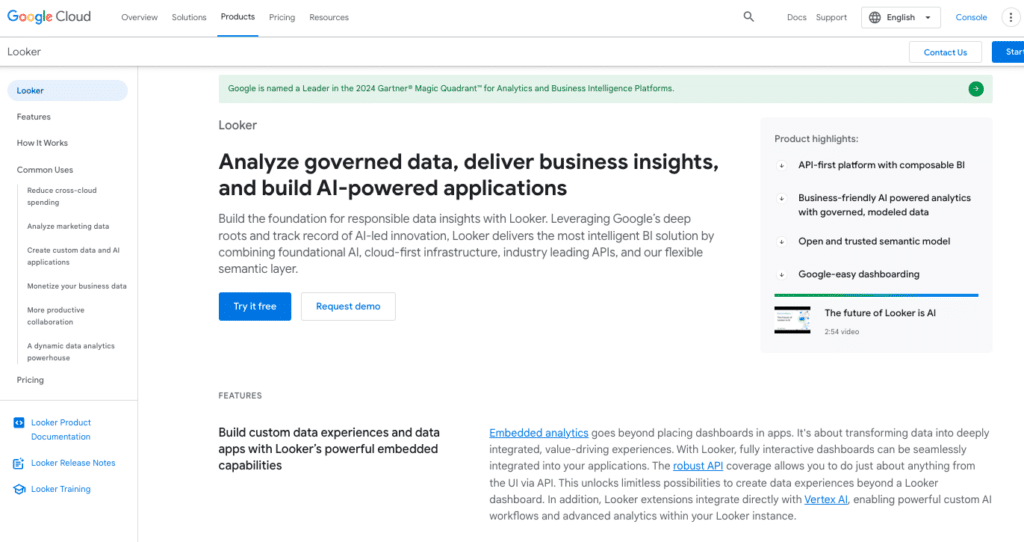
Looker is Google Cloud’s enterprise BI platform, built around LookML, a semantic modeling layer that defines business metrics once and reuses them across every dashboard, report and embedded analytics application. When a data team invests in the LookML layer, every business user queries from the same governed definitions. Pricing is enterprise and quote-based, typically starting around $5,000 per month for small deployments, with Viewer licenses at $30, Standard at $60 and Developer at $125 per user per month.
The LookML dependency is worth understanding before committing: Looker requires ongoing data engineering to build and maintain the semantic layer, and that staffing cost often runs 40 to 60 percent on top of the software license. Looker Studio, a separate free product, handles lightweight reporting without the LookML requirement, but without the governance either.
Sigma Computing
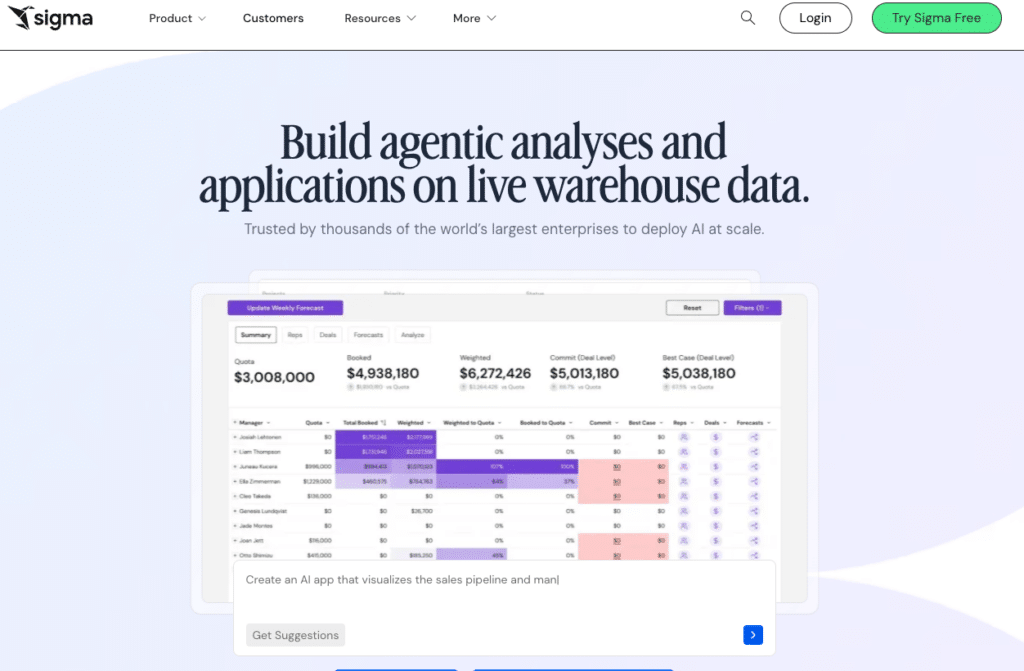
Sigma Computing takes a different approach to warehouse-native BI. Rather than building dashboards, Sigma presents data in a spreadsheet-like interface that runs live SQL queries against the warehouse. Finance and operations teams find the transition easier because the row-and-column format is familiar. AI features assist with formula generation, anomaly detection and insight summaries. Pricing is not publicly listed. Based on procurement data, median annual deployments run around $61,000, with a platform fee of approximately $30,000 and Creator licenses at $2,000 to $3,500 per user annually.
Every dashboard interaction queries the warehouse directly, which means compute costs add to the total bill as usage scales. It is best suited to data teams and finance organizations with existing warehouse infrastructure who want a more accessible front-end than traditional BI.
Qlik Cloud
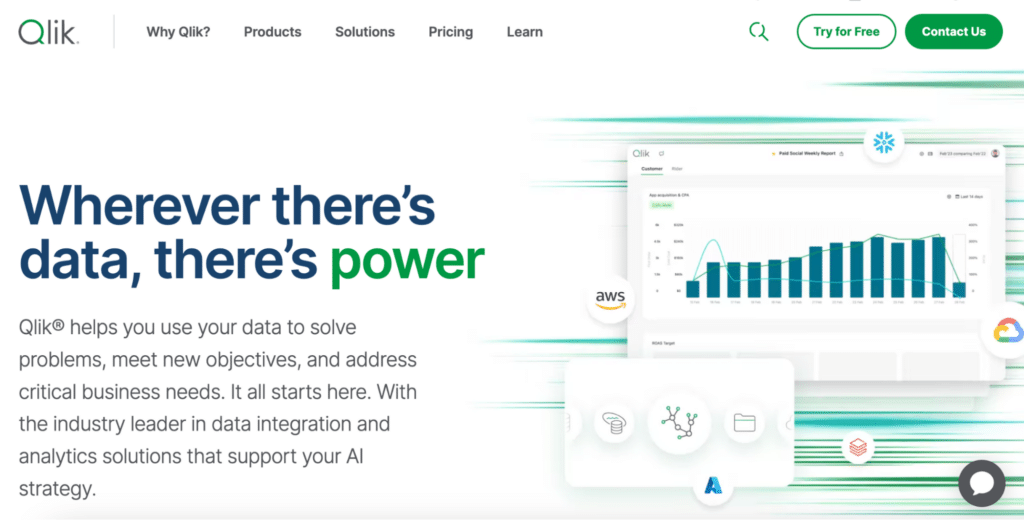
Qlik Cloud is built around an associative data model that lets users explore hidden relationships across data without being constrained by predefined query paths. This makes it particularly strong for use cases where the question is not yet known: finance teams investigating margin variance, supply chain teams tracing cost anomalies or operations teams looking for patterns across large datasets. AI features include automated insight generation and natural language queries. The Starter plan runs $825 per month for 20 users and the Standard plan $2,500 per month for 20 users.
Mid-market teams typically spend between $30,000 and $300,000 annually when implementation and data engineering are included. Best suited to industries like financial services, retail and manufacturing where complex data relationships are the norm.
Comparison Table
| Tool | Category | Best For | AI Features | Starts At |
|---|---|---|---|---|
| Claude or ChatGPT | General AI | One-time data analysis, not recurring BI | Conversational analysis, session-based | Free tier available |
| Tableau with AI | Warehouse-native BI | Orgs with data teams and strong visualization needs | Tableau Pulse, Tableau Agent, NLQ | $75/user/month Creator (annual) |
| Looker | Warehouse-native BI | Google Cloud orgs needing governed semantic layer | AI-assisted exploration on LookML | From $5,000/month platform |
| Sigma Computing | Warehouse-native BI | Data teams wanting spreadsheet-like warehouse querying | Formula generation, anomaly detection | Contact for pricing |
| Qlik Cloud | Warehouse-native BI | Finance and ops teams with complex data relationships | Associative AI, NLQ, insight generation | From $825/month (20 users) |
| Zoho Analytics | Operational BI | Small and mid-market teams needing accessible BI | Zia AI assistant, NLQ, anomaly detection | From $30/month |
| ThoughtSpot | Operational and warehouse BI | Business user self-serve on governed warehouse data | Spotter AI agent, NLQ, automated insights | From $25/user/month |
| Coefficient | Operational BI, AI dashboard builder | RevOps and finance teams in Google Sheets or Excel | Sheets Assistant, AI dashboard builder, Ask-AI sidebar | Free plan. Paid from $49/month. No per-user fees. |
How to Pick the Right AI BI Tool
Start with your data infrastructure, not the feature list. The tool that fits your team is determined more by where your data lives and who needs to access it than by which platform has the most impressive AI demo.
You have a cloud data warehouse and a data engineering team
Tableau, Looker, Sigma and Qlik are all worth evaluating. The differentiator is the interface model: Tableau for visualization depth, Looker for governed semantic layers on Google Cloud, Sigma for spreadsheet-like querying and Qlik for associative data exploration. Budget for implementation and ongoing data engineering regardless of which you choose.
You need self-serve analytics for business users without heavy engineering investment
ThoughtSpot is the strongest purpose-built option if you have clean warehouse data. Zoho Analytics is the most accessible entry point for smaller teams. For teams already working in Google Sheets or Excel, Coefficient connects live data from 150+ sources and adds AI dashboarding on top of the spreadsheet workflow they already have, without requiring a new platform or per-viewer licensing.
Your team tried building dashboards in Claude or ChatGPT and hit the limitations
The limitations are structural, not a prompt quality problem. No general AI tool maintains a persistent data connection, runs server-side refreshes or produces auditable output. The right next step depends on where your data lives. If it lives in CRMs and ERPs, Coefficient closes that gap inside the spreadsheet. If it lives in a warehouse, ThoughtSpot or Tableau are the more appropriate fit.
You need to share dashboards with leadership or a board without per-viewer costs
Most enterprise BI platforms charge for every viewer. Coefficient’s live dashboard URLs give viewers free access with no per-seat tax. Looker Studio is free for basic dashboards if the data is in Google’s ecosystem. Zoho Analytics has the most affordable viewer pricing among full-featured BI platforms.
AI BI in 2026 is not a single category. The tools that serve a data engineering team building a governed semantic layer for 500 business users are not the same tools that serve a RevOps manager who needs a pipeline dashboard by Monday without filing a ticket. The market has both, and the right choice is the one that fits the actual problem, not the one with the most impressive feature page.
For teams whose data lives in business systems rather than a warehouse, and whose analytics workflow runs in Google Sheets or Excel, Coefficient is free to start and connects to your first data source in minutes.