Financial KPIs are essential for business success.
This guide explores the top 5 financial KPIs, their importance, and how to use them effectively. We’ll also provide free templates to help you track these crucial metrics.
Financial KPIs 101: The Basics Every Business Leader Should Know
Financial Key Performance Indicators (KPIs) are quantifiable measures used to evaluate a company’s financial performance. These metrics provide valuable insights into various aspects of a business’s financial health, including profitability, efficiency, and growth.
Importance of tracking financial KPIs
Tracking financial KPIs is crucial for several reasons:
- Performance evaluation: KPIs provide an objective way to measure a company’s financial performance.
- Goal setting: They help establish clear, measurable financial objectives.
- Decision-making: KPIs inform strategic decisions by providing data-backed insights.
- Trend identification: Regular tracking allows businesses to spot trends and patterns in their financial data.
- Stakeholder communication: KPIs offer a standardized way to report financial performance to investors, board members, and other stakeholders.
How financial KPIs differ from other business metrics
While financial KPIs focus specifically on monetary aspects of a business, other business metrics may include non-financial factors such as customer satisfaction, employee engagement, or operational efficiency. Financial KPIs are typically more quantitative and directly tied to a company’s financial statements and performance.
The 5 Most Critical Financial KPIs for Business Success
1. Revenue Growth Rate: Measuring Your Business Expansion
Definition and formula
Revenue Growth Rate measures the percentage increase in a company’s revenue over a specific period. The formula is:
Revenue Growth Rate = (Current Period Revenue – Previous Period Revenue) / Previous Period Revenue x 100
Why it’s important
This KPI is crucial because it indicates a company’s ability to generate additional revenue through increased sales or market expansion. A positive growth rate suggests that the business is expanding, while a negative rate may indicate challenges in the market or with the company’s products or services.
How to interpret and improve
- Positive growth: Indicates successful strategies and market demand.
- Negative growth: May suggest market saturation, increased competition, or internal issues.
To improve Revenue Growth Rate:
- Expand your product or service offerings
- Enter new markets or geographic regions
- Implement effective marketing and sales strategies
- Focus on customer retention and upselling
Tracking revenue growth rate

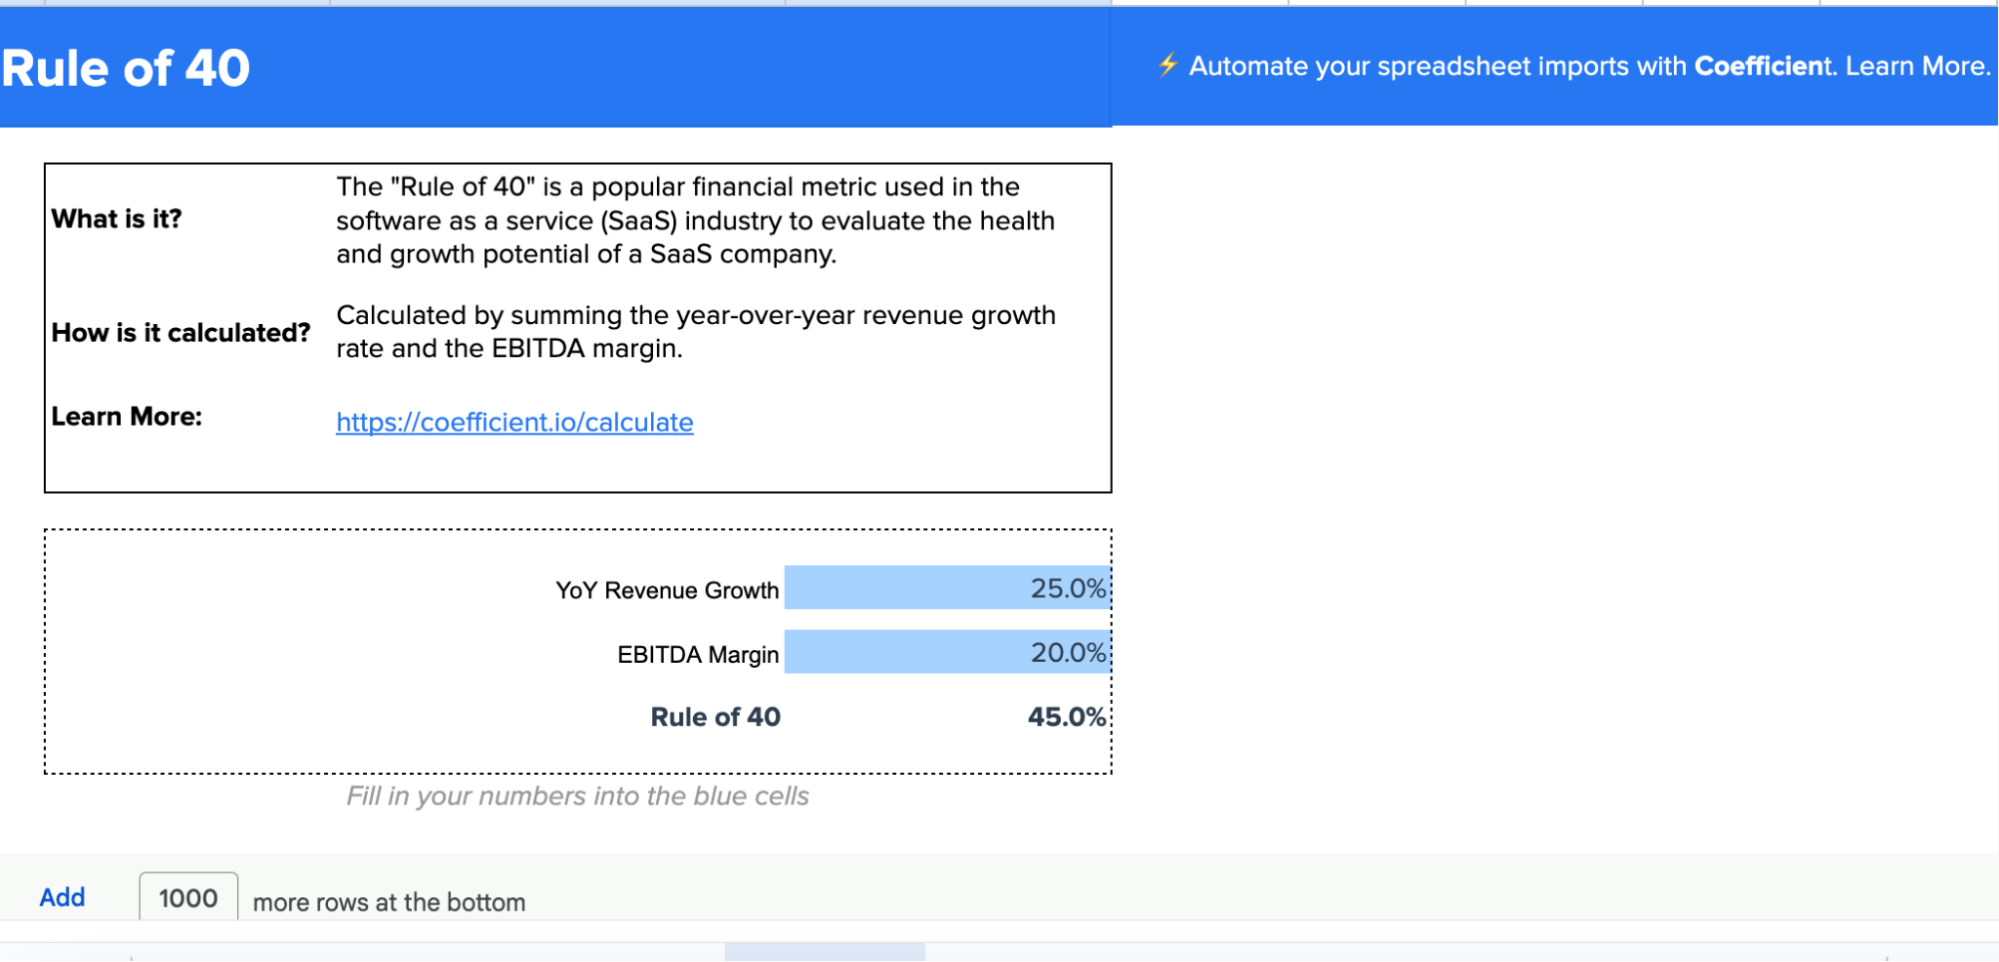
Coefficient’s Rule of 40 Calculator can help track and analyze your Revenue Growth Rate alongside other crucial metrics. This tool calculates the Rule of 40 score, which combines revenue growth and profitability, providing a comprehensive view of your business’s financial health.
2. Gross Profit Margin: Assessing Your Pricing Strategy and Production Efficiency
Definition and formula
Gross Profit Margin measures the percentage of revenue that exceeds the cost of goods sold (COGS). The formula is:
Gross Profit Margin = (Revenue – COGS) / Revenue x 100
Why it’s important
This KPI reflects a company’s ability to produce goods or services profitably. It indicates how well a business manages its production costs relative to its pricing strategy.
How to interpret and improve
- High margin: Suggests effective cost management and strong pricing power.
- Low margin: May indicate high production costs or pricing pressure from competitors.
To improve Gross Profit Margin:
- Optimize your pricing strategy
- Reduce production costs through efficiency improvements
- Negotiate better rates with suppliers
- Focus on selling high-margin products or services
3. Net Profit Margin: Evaluating Overall Financial Health
Definition and formula
Net Profit Margin measures the percentage of revenue that remains as profit after all expenses, including taxes and interest, have been deducted. The formula is:
Net Profit Margin = (Net Income / Revenue) x 100
Why it’s important
This KPI provides a comprehensive view of a company’s profitability, taking into account all costs associated with running the business. It’s a key indicator of overall financial health and operational efficiency.
How to interpret and improve
- High margin: Indicates strong profitability and effective cost management.
- Low margin: May suggest high operational costs or inefficiencies in the business model.
To improve Net Profit Margin:
- Reduce operating expenses
- Increase sales without proportionally increasing costs
- Improve operational efficiency
- Optimize your tax strategy
Analyzing net profit margin

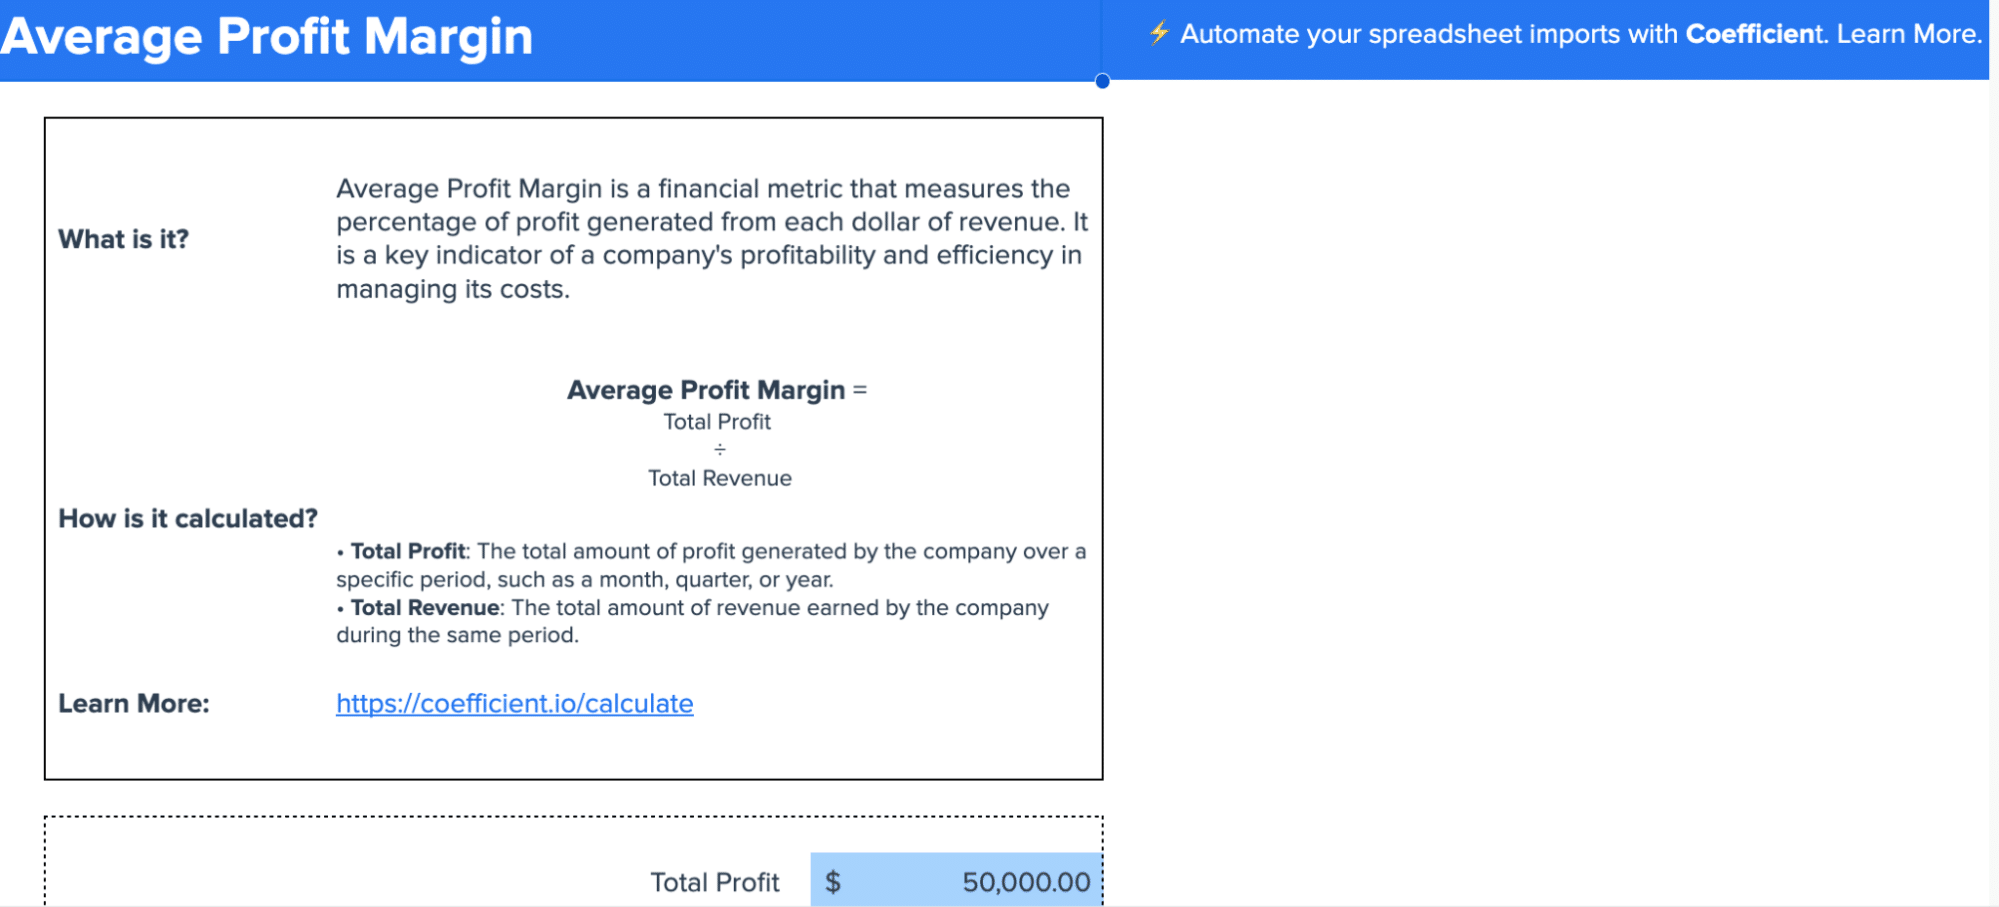
Coefficient’s Profit Margin Calculator helps businesses easily calculate and track their Net Profit Margin. This tool provides valuable insights into your company’s overall profitability, allowing you to make informed decisions about cost management and pricing strategies.
4. Operating Cash Flow: Understanding Your Company’s Liquidity
Definition and formula
Operating Cash Flow (OCF) measures the amount of cash generated by a company’s normal business operations. The formula is:

Stop exporting data manually. Sync data from your business systems into Google Sheets or Excel with Coefficient and set it on a refresh schedule.
Get Started
OCF = Net Income + Non-Cash Expenses – Increases in Working Capital
Why it’s important
OCF is crucial for assessing a company’s ability to generate cash to maintain and grow its operations, pay dividends, and service debt. It provides insight into the company’s liquidity and financial flexibility.
How to interpret and improve
- Positive OCF: Indicates the company can generate sufficient cash from its core business activities.
- Negative OCF: May suggest operational issues or the need for external financing.
To improve Operating Cash Flow:
- Improve accounts receivable collection
- Manage inventory more efficiently
- Negotiate better payment terms with suppliers
- Reduce unnecessary expenses
Tracking operating cash flow

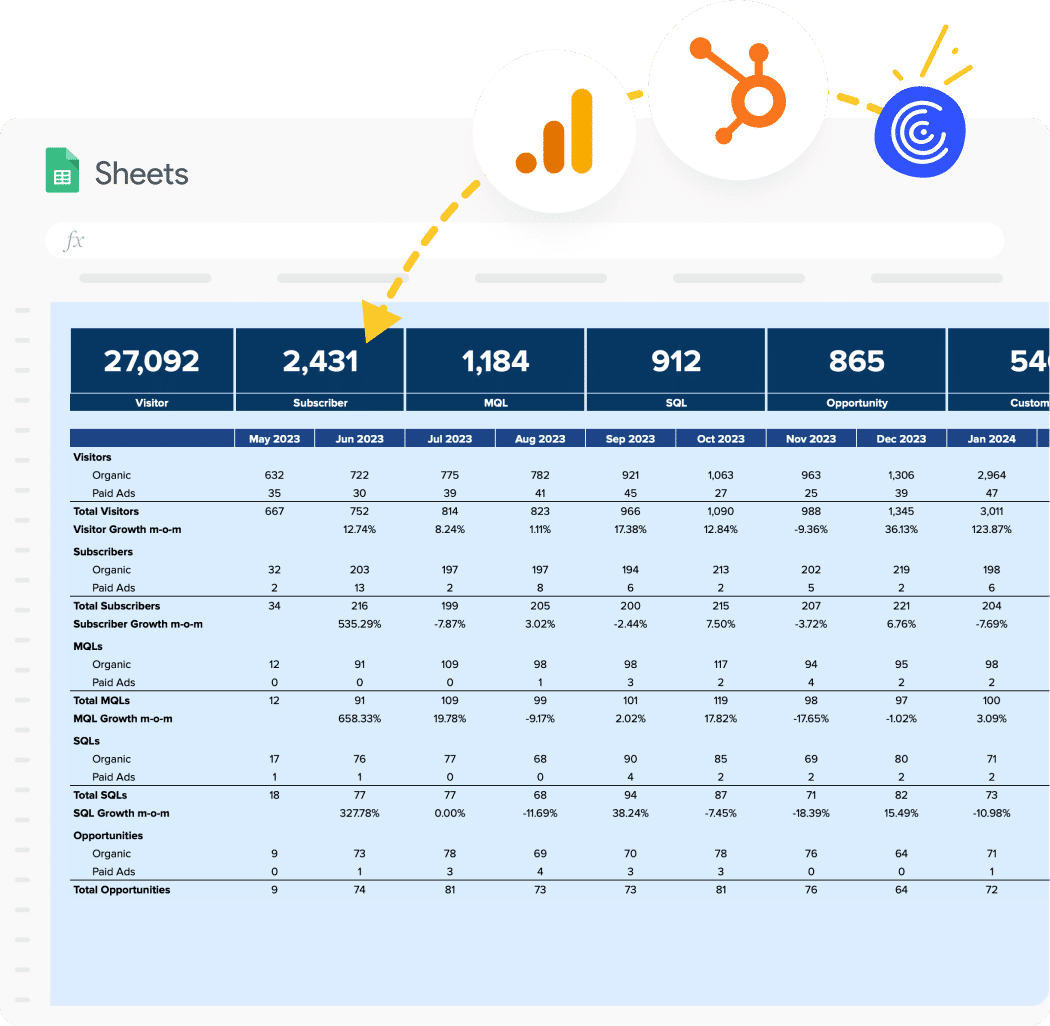
Coefficient’s SaaS Financial Model template connects key metrics from various sources, offering a comprehensive view of your business’s performance, including Operating Cash Flow. This tool allows you to track and analyze your cash flow alongside other crucial financial metrics.
5. Customer Acquisition Cost (CAC): Optimizing Your Marketing ROI
Definition and formula
Customer Acquisition Cost measures the total cost of acquiring a new customer. The formula is:
CAC = Total Sales and Marketing Expenses / Number of New Customers Acquired
Why it’s important
CAC helps businesses understand the efficiency of their marketing and sales efforts. It’s crucial for assessing the sustainability of a company’s growth strategy and determining the long-term value of customer relationships.
How to interpret and improve
- Low CAC: Indicates efficient marketing and sales processes.
- High CAC: May suggest ineffective marketing strategies or a highly competitive market.
To improve Customer Acquisition Cost:
- Optimize marketing channels and campaigns
- Improve sales processes and conversion rates
- Focus on customer retention to reduce the need for new acquisitions
- Implement referral programs to leverage existing customers
Calculating and monitoring CAC
Coefficient offers a Customer Acquisition Cost Analysis calculator that shows how to calculate and analyze CAC in Google Sheets using data from multiple sources. This approach allows you to visualize costs and deals over time, enabling better strategic planning and optimization of your marketing ROI.
Implementing Financial KPIs: Best Practices and Common Pitfalls
Selecting the right KPIs for your business
- Align KPIs with your business goals and strategy
- Consider your industry and business model
- Focus on a manageable number of KPIs (typically 5-7)
- Ensure KPIs are measurable and actionable
Setting realistic targets and benchmarks
- Use historical data as a starting point
- Research industry standards and benchmarks
- Consider your company’s growth stage and market conditions
- Set both short-term and long-term targets
Frequency of measurement and reporting
- Determine the appropriate frequency for each KPI (daily, weekly, monthly, quarterly)
- Establish a consistent reporting schedule
- Use real-time dashboards for critical metrics
- Conduct regular review meetings to discuss KPI performance
Avoiding common mistakes in KPI implementation
- Don’t focus solely on lagging indicators; include leading indicators as well
- Avoid vanity metrics that don’t provide actionable insights
- Don’t ignore external factors that may impact KPI performance
- Regularly review and update your KPIs as your business evolves
Mastering Financial KPIs for Long-Term Success
In today’s competitive business landscape, data-driven decision-making is no longer a luxury—it’s a necessity. By mastering the use of financial KPIs, you’ll be better equipped to navigate challenges, seize opportunities, and drive sustainable growth for your business.
Ready to take your financial KPI tracking to the next level? Get started with Coefficient today and experience the power of automated, real-time financial insights.
Meta Title: Top 5 Financial KPIs: Boost Your Business Performance Now
Meta Description: Master the top 5 financial KPIs with our comprehensive guide. Learn definitions, formulas, and best practices to drive your business success. Free templates included!


