Searching for the most effective Xero reports? This guide presents four essential dashboards that offer clear insights into your financial data, empowering you to make informed decisions and drive business growth in 2024.
#1 Xero Inventory Excel Template

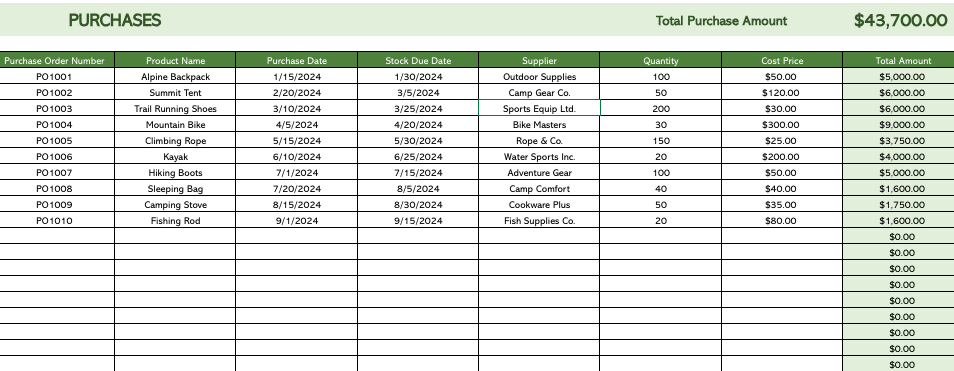
The Xero Inventory Excel Template streamlines your inventory management process. By integrating directly with your Xero account, this template provides real-time visibility into your stock levels, product performance, and inventory trends, all within Excel.
Use Case: Inventory Management and Optimization
This template helps businesses:
- Monitor current inventory across all products
- Identify top-selling items and slow-moving stock
- Set up alerts for when stock reaches reorder levels
- Manage and track purchase orders efficiently
Metrics Tracked
- SKU, Size, Colour
- Original Stock Level
- Reorder Point
- Cost Price and Markup
- Retail Price
- Total Orders
- Orders Waiting to be Fulfilled
- Stock Waiting to be Received
- Stock on Hand
Get the Xero Inventory Excel Template
#2 Xero 3-Year Finance Projections Template

The Xero Finance Projections Template is crucial for businesses aiming to forecast their financial future. This template connects directly to your Xero account, pulling in real-time financial data to create accurate and dynamic financial projections.
Use Case: Financial Forecasting and Planning
This template enables businesses to:
- Generate detailed financial projections based on historical data
- Develop multiple financial scenarios to prepare for different outcomes
- Use projections to inform budget decisions and resource allocation
- Create professional financial forecasts for stakeholders and potential investors
Metrics Tracked
- Net Income
- Changes in Working Capital
- Depreciation and Amortization
- Accounts Receivable
- Accounts Payable
- Deferred Taxes
- Cash From Sale Of Capital Assets
- Cash Paid for Purchase Of Capital Assets
- Increases in All Other Long-Term Assets
Access the Xero Finance Projections Template
#3 Xero Consolidated Reporting Dashboard

The Xero Consolidated Reporting Dashboard is essential for businesses managing multiple entities or subsidiaries. This dashboard automates the process of consolidating financial data from various Xero organizations, providing a comprehensive view of your overall business performance.
Use Case: Multi-entity Financial Consolidation
This template helps businesses:
- Automate the process of combining financial data from multiple Xero entities
- Gain a holistic view of your organization’s financial performance across all entities
- Reduce errors associated with manual consolidation processes
- Easily prepare consolidated financial statements for regulatory requirements
Metrics Tracked
- Gross profit (cash)
- Open invoices by customer
- Open invoices amount by customer
- Overdue invoices by customer
- Overdue invoices amount by customer
- Total expenses (cash) by category
- Paid invoices amount
- Paid invoices
- Income (cash) by category
Get Started with the Xero Consolidated Reporting Template
#4 Xero Finance Dashboard

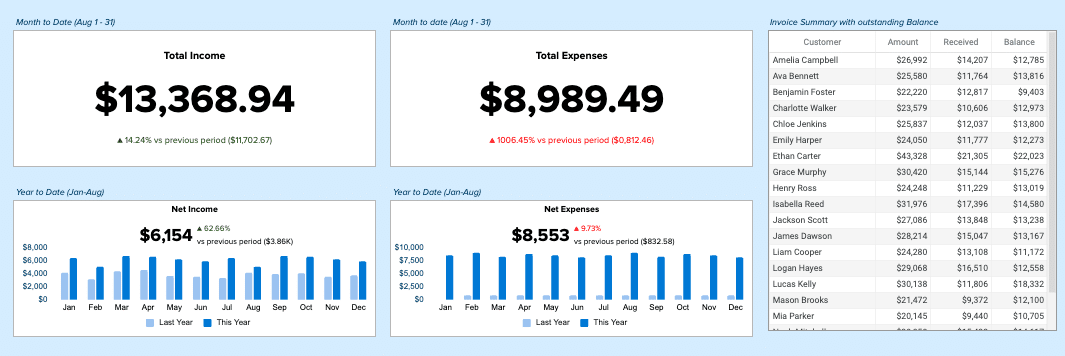
The Xero Finance Dashboard offers a comprehensive visual representation of your business’s financial health. By pulling real-time data directly from Xero, this dashboard provides an at-a-glance overview of key financial metrics, enabling quick and informed decision-making.
Use Case: Financial Performance Monitoring
This dashboard allows businesses to:
- Track critical financial KPIs in real-time
- Identify financial trends and patterns through intuitive charts and graphs
- Easily share financial insights with stakeholders and team members
- Make data-driven decisions based on up-to-date financial information
Metrics Tracked
- Income Overview (Total Income, Income by period)
- Expense Overview (Total Expenses, Expenses by period)
- Bank Summary (Account balances and received amounts)
- Profitability (Income, Gross Profit, Net Profit, Other Income, Profit/Loss)
- Cash Summary (Cash Received, Cash Spent, Cash Surplus/Deficit, Closing Bank Balance)
- Performance (Gross Profit Margin, Net Profit Margin, Return on Investment)
- Balance Sheet (Debtors, Creditors, Net Assets)
Explore the Xero Finance Dashboard
Conclusion
These four Xero reports offer valuable insights into various aspects of your business’s financial health, from inventory management to consolidated reporting and financial projections. By using these dashboards, you’ll be better equipped to make data-driven decisions and keep your business on the path to financial success in 2024 and beyond. Start using these Xero reports today to transform your financial reporting and decision-making processes.
Explore All Xero Connector Dashboards


