How to Import Google Analytics Conversions (Key Events) Data into Excel

using Coefficient excel Add-in (500k+ users)

Learn how to import Google Analytics Conversions (Key Events) data directly into Excel using Coefficient. Track and analyze conversion performance with automated data syncing.

“Supermetrics is a Bitter Experience! We can pull data from nearly any tool, schedule updates, manipulate data in Sheets, and push data back into our systems.”

5 star rating coeff g2 badge

Analyzing Conversions (Key Events) data from Google Analytics in Excel helps marketing and revenue teams understand which actions users are taking on your site and how effectively your funnels are performing.

Instead of manually exporting data that quickly becomes outdated, you can establish a live connection that refreshes automatically.

TLDR

  • Step 1:

    Install Coefficient from the Office Add-ins store

  • Step 2:

    Connect to your Google Analytics account

  • Step 3:

    Select Conversions (Key Events) as your primary metric

  • Step 4:

    Configure dimensions to segment your conversion data

  • Step 5:

    Import into Excel and set up auto-refresh

Step 1: Install Coefficient and Connect to Google Analytics

Begin by installing the Coefficient add-in and connecting it to your Google Analytics account:

  1. Open Excel and navigate to the Insert tab
  2. Click on Get Add-ins
  3. Search for “Coefficient” in the Office Add-ins store
  4. Click Add to install the Coefficient add-in
  5. Once installed, the Coefficient sidebar will appear
  6. Click “Import” to begin connecting data sources
  7. Select “Google Analytics” from the marketing integrations
  8. Log in with your Google account and authorize Coefficient to access your data
Coefficient sidebar menu with import, export, automations, and AI Sheet Assistant options.

Step 2: Select and Configure Conversions Data

After connecting your Google Analytics account, configure your Conversions data import:

  1. Choose your Google Analytics 4 property from the dropdown menu
  2. Set your desired date range (last 7 days, last 30 days, custom range, etc.)
  3. Select “Conversions” or specific conversion events as your primary metrics
    • By event name to track different conversion types
    • By date to monitor trends over time
    • By source/medium to identify which channels drive conversions
    • By user demographics to understand who converts best
    Add dimensions to segment your conversion data:
  4. Apply filters if you want to focus on specific segments of your conversion data
  5. Preview your selection to ensure it provides the insights you need
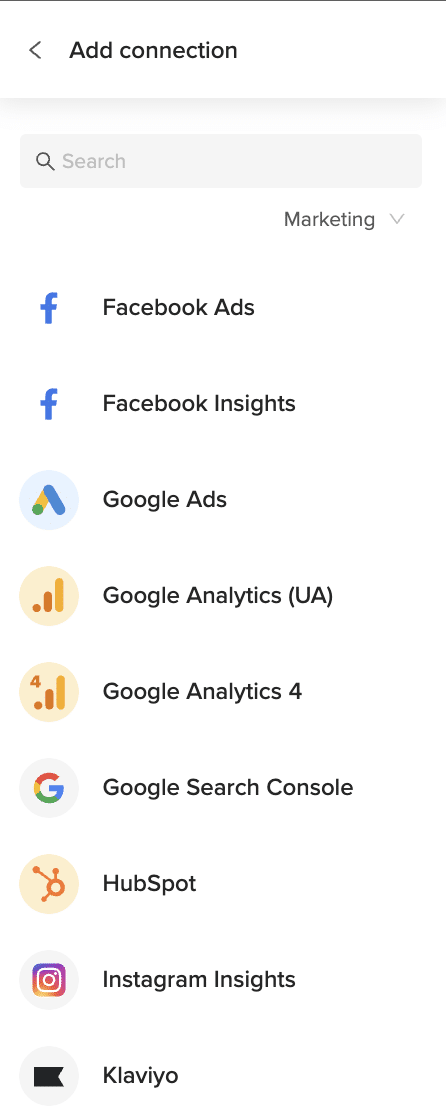
Marketing integrations such as Google Ads, Facebook Ads, HubSpot, and Klaviyo listed.

Step 3: Import and Set Up Auto-Refresh

Once you’ve configured your Conversions data selection, import it into Excel and set up automatic refreshes:

  1. Click “Import” to bring the Conversions data into your Excel worksheet
  2. Choose where you want the data to be placed in your spreadsheet
    • Navigate to the “Automations” tab in the Coefficient sidebar
    • Select “Schedule Refresh” for your imported Conversions data
    • Choose your preferred refresh frequency (hourly, daily, weekly)
    Set up auto-refresh to keep your Conversions data current:
  3. Optionally, set up alerts for significant changes in conversion metrics
Auto-refresh options for imported data with daily, hourly, and weekly scheduling.

Available Google Analytics Data

Metrics & Dimensions

  • Sessions
  • Pageviews
  • Conversions (Key Events)
  • Traffic Source / Medium
  • Engaged Sessions
  • Session Conversion Rate
  • Total Revenue
  • Landing Page
  • Event Count
  • Campaign
  • Device Category
  • New Users

Analyzing Conversions Data in Excel

With your Conversions data now in Excel, you can create valuable analyses like:

  • Conversion rate trends over time
  • Comparison of conversion performance across different channels
  • Correlation between marketing campaigns and conversion spikes
  • Custom visualizations that show conversion funnels and drop-off points
  • ROI calculations based on conversion value and marketing spend

Related Resources

For more information about working with Google Analytics data in your spreadsheets:

Start importing your Google Analytics Conversions data into Excel today with Coefficient and transform how your team tracks and optimizes conversion performance.

Frequently Asked Questions

  • How to get Conversions data from Google Analytics?

    down-chevron

    To access Conversions data in Google Analytics traditionally:

    • Log into your Google Analytics account
    • Navigate to Reports > Engagement > Events or Conversions
    • View your conversion events and their metrics
    • Export the data manually as a CSV file

    With Coefficient, you can import Conversions data directly into Excel with just a few clicks, eliminating manual exports and keeping data fresh.

  • How do I get a list of Conversions in Google Analytics?

    down-chevron

    To view all conversion events in Google Analytics:

    1. Go to Admin > Events > Configure
    2. Look for events marked as conversions
    3. Or go to Reports > Engagement > Conversions
    4. View the list of conversion events with metrics

    Alternatively, Coefficient lets you easily import all conversion events with their metrics directly into Excel for more flexible analysis and reporting.

  • How do I download Conversions data from Google Analytics?

    down-chevron

    The traditional download process requires:

    • Finding your Conversions report in Google Analytics
    • Clicking the download button
    • Selecting your preferred format (CSV, Excel)
    • Repeating this process whenever you need updated data

    With Coefficient, you can import live Conversions data into Excel that refreshes automatically on your schedule, eliminating repetitive manual downloads.

  • How to automate importing Google Analytics Conversions to Excel daily?

    down-chevron

    To automate daily Conversions data imports:

    1. Install the Coefficient add-in for Excel
    2. Connect to Google Analytics and import Conversions data
    3. Go to the Automations tab in Coefficient
    4. Set up a daily refresh schedule
    5. Optionally, configure email notifications

    This ensures your Excel reports always contain the latest conversion metrics without any manual updates required.

  • How to send email alerts about Conversions data from Google Analytics?

    down-chevron

    To set up alerts for significant Conversions changes:

    1. Import your Conversions data to Excel using Coefficient
    2. Go to Automations in the Coefficient sidebar
    3. Select “Set up Notifications”
    4. Configure conditions (e.g., conversion rate drops below target)
    5. Add recipients and customize your alert message

    This automatically notifies your team about important conversion performance changes without constant monitoring.

500,000+ happy users
Get Started Now
Connect any system to Google Sheets in just seconds.
Get Started

Trusted By Over 50,000 Companies