Time tracking is essential for effective project management, providing insights into work progress and resource allocation.
However, while tools like Jira are excellent for task management, spreadsheets offer more flexibility and customization regarding data analysis.
In this blog, we’ll walk through how to use Coefficient to import Jira time-tracking data into Google Sheets to give you a comprehensive view of project progress, resource utilization, and productivity levels for each team member.
Step-by-Step Guide: Jira Time Tracking Analysis
Coefficient is a free Google Sheets add-on that syncs Google Sheets to your favorite business analytics solutions, allowing you to pull real-time data into your spreadsheet.
To install Coefficient, open Google Sheets.
Click Extensions in the top menu -> ‘Add-ons’ -> ‘Get add-ons.’
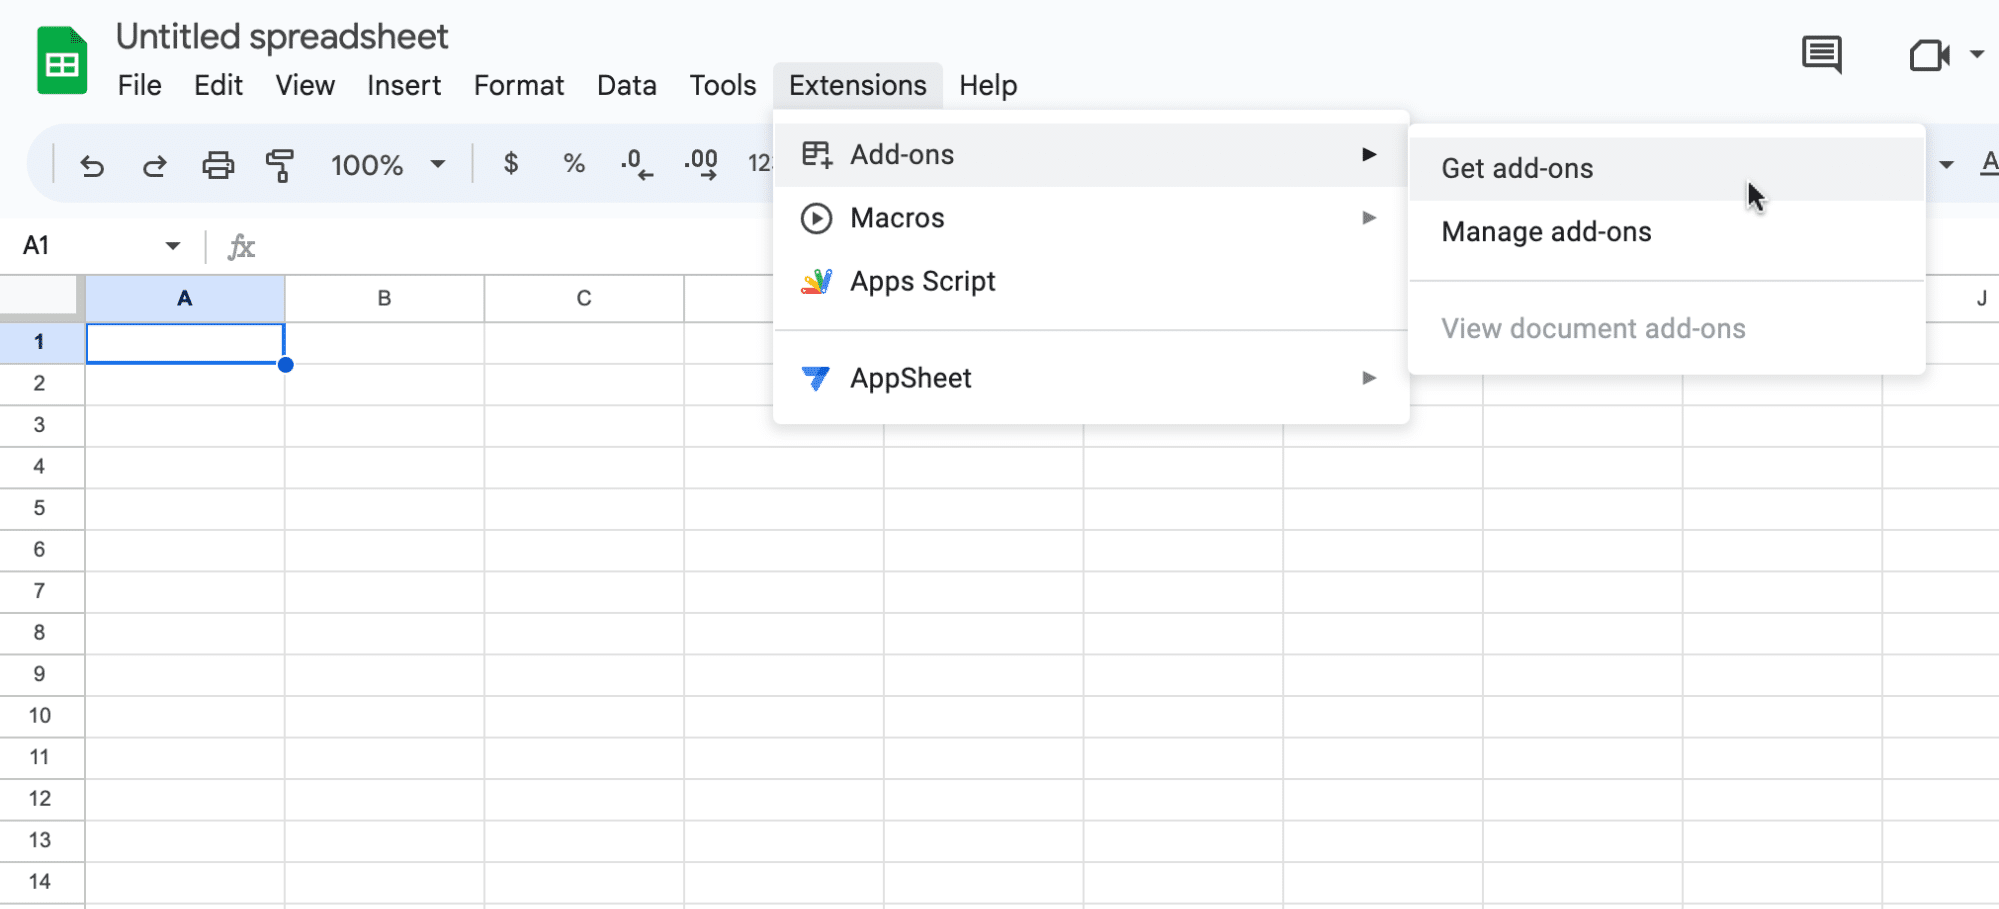
Type “Coefficient” in the Google Workspace Marketplace search menu and select the Coefficient app.

Click ‘Allow’ to grant Coefficient access to your Google account.

Wait a few moments for the install to complete, then return to your spreadsheet menu.
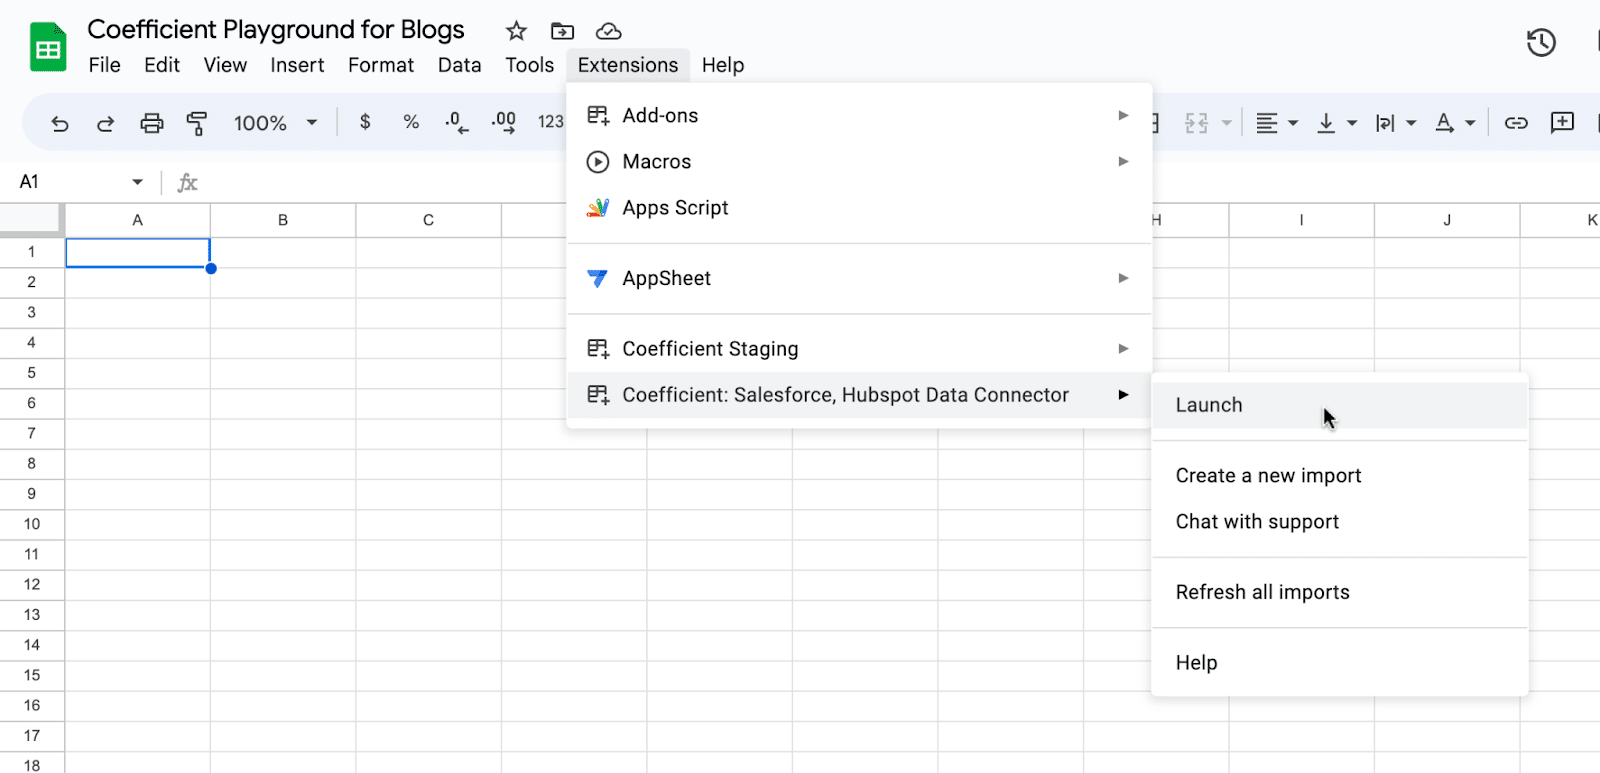
Click on Extensions -> Coefficient -> Launch.
Coefficient will open on the right side of your spreadsheet.
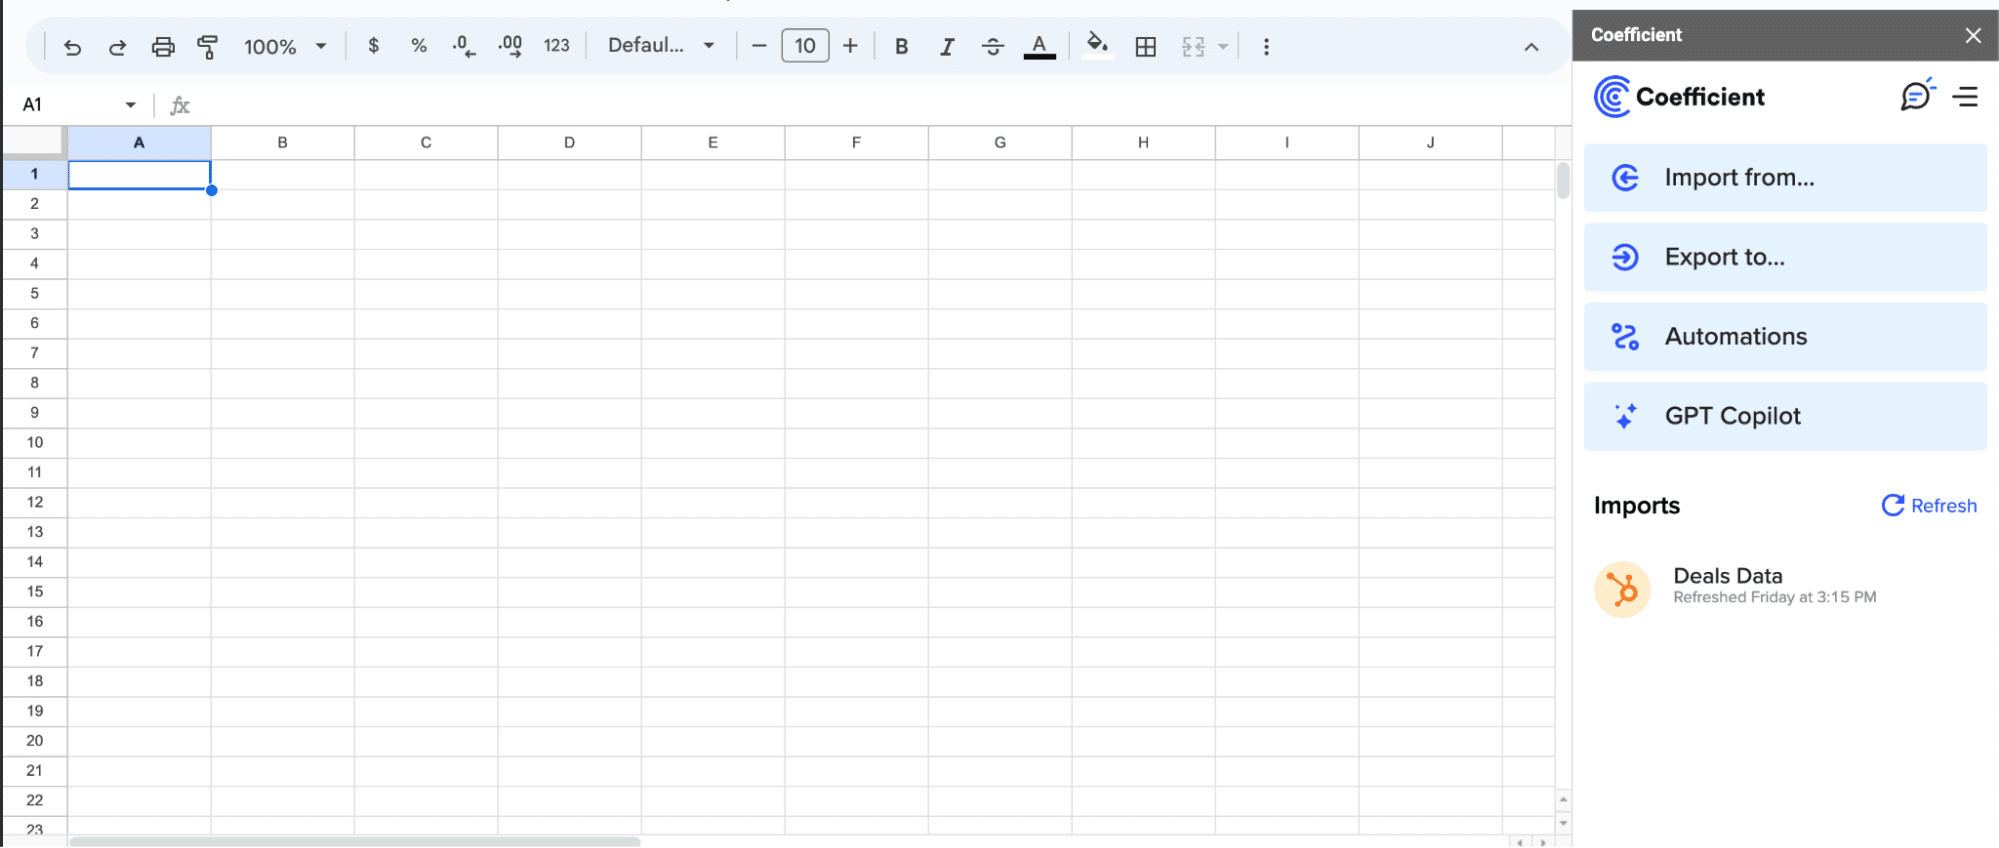
Once installed, you can import your data from Jira directly into your spreadsheet.
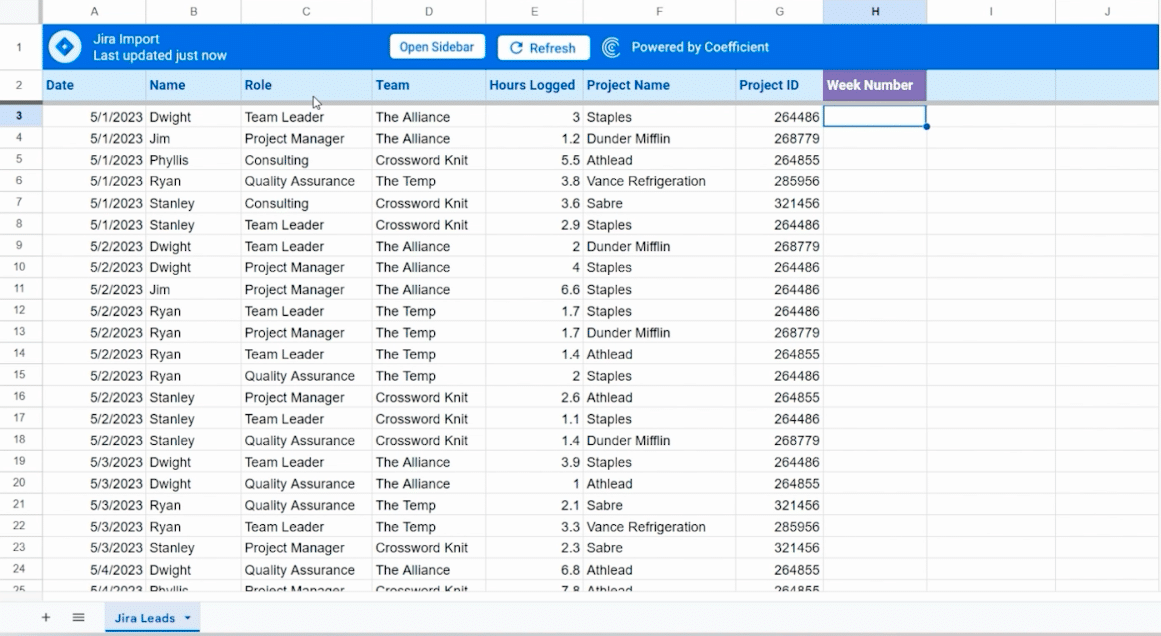
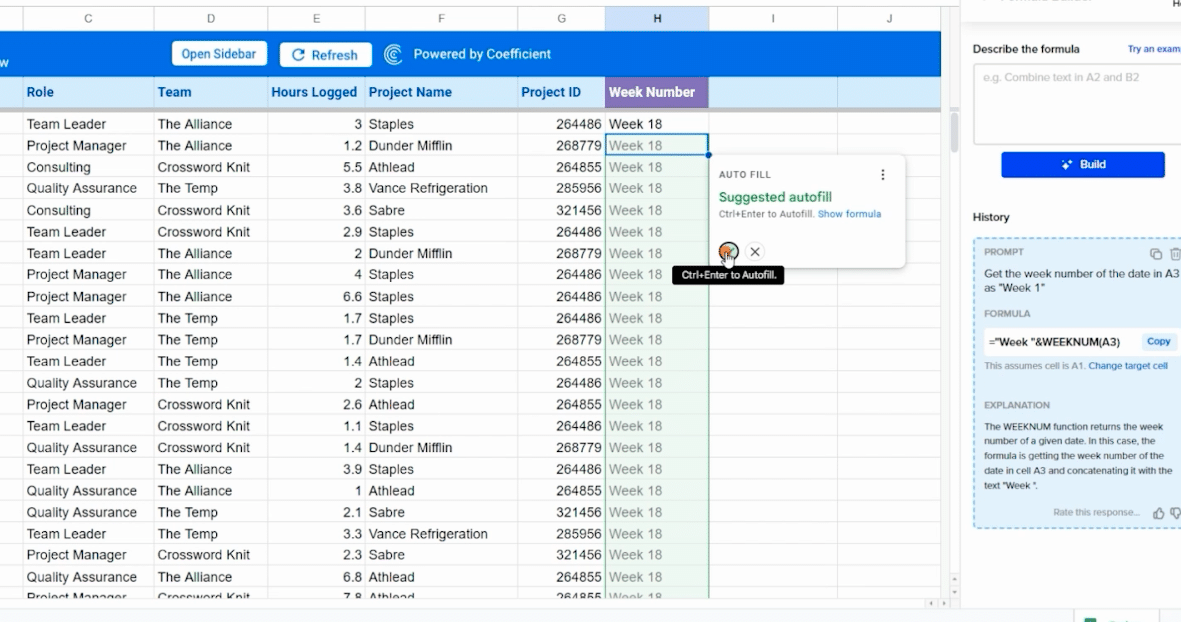
In this example, we’ll walkthrough how to assign a ‘Week Number’ to each row, which will allow you to analyze your data on a weekly basis. You can write your own formula or use AI to write your formula for you. Let’s use AI in this scenario.
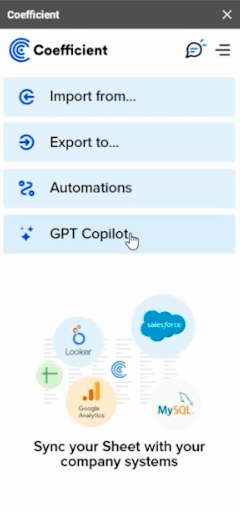
First, select ‘GPT Copilot’ from the Coefficient Menu.
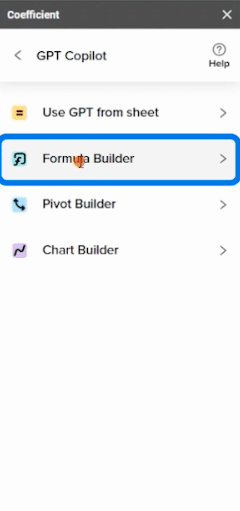
Choose ‘Formula Builder’ from the menu.
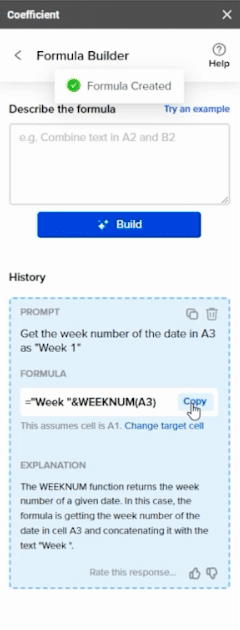
Describe the formula you want to build and click ‘Build.’ In this example, “Get the week number of the date in A3 as Week 1.”

Copy the output.
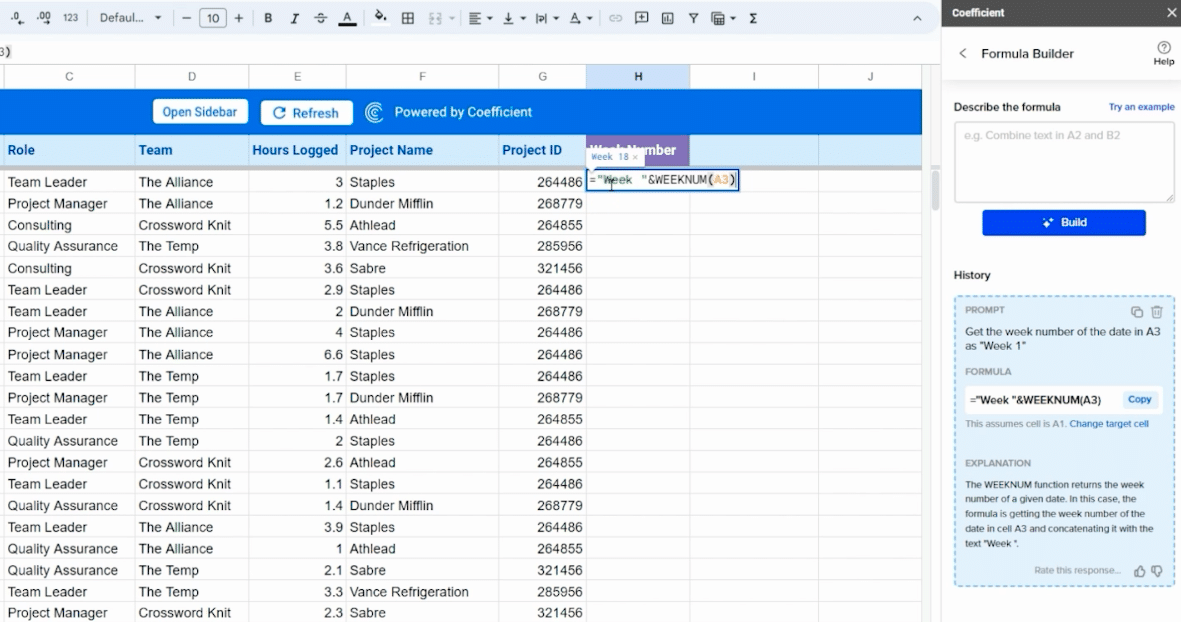
Paste the formula into the empty cell.
You’ll be prompted to apply the formula to your entire column. Click the checkmark to autofill.
Now let’s build a pivot table with this data.

Stop exporting data manually. Sync data from your business systems into Google Sheets or Excel with Coefficient and set it on a refresh schedule.

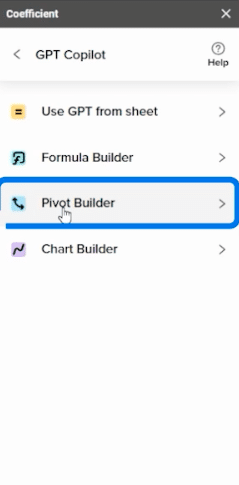
Return to the GPT Copilot menu and select ‘Pivot Builder.’
Select the data range.
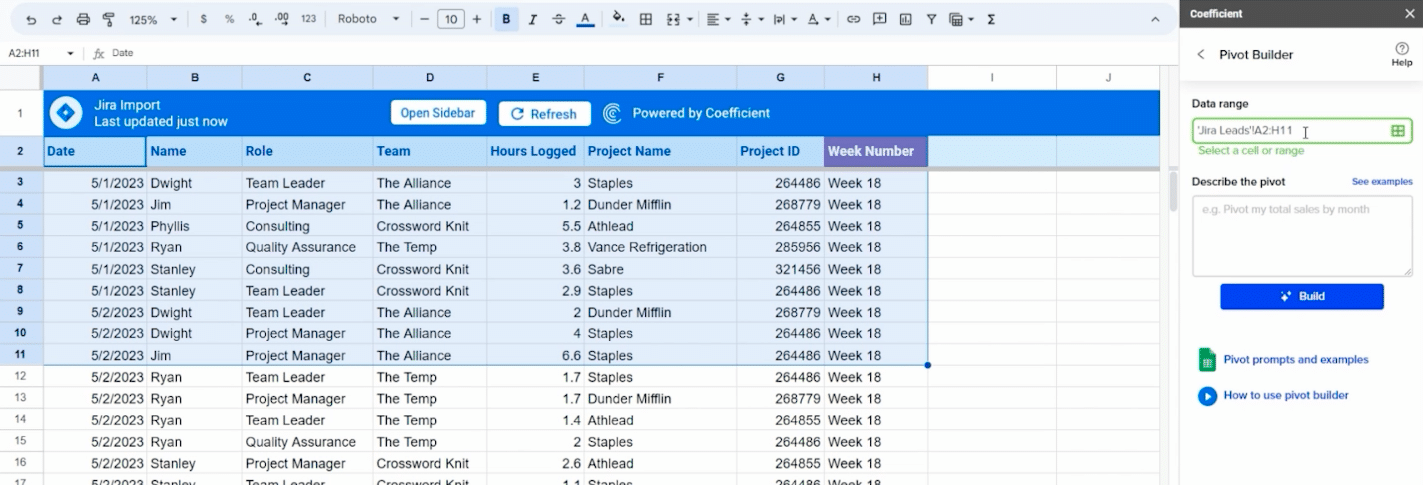
Note: Delete the ‘11’ after the ‘H’ to automatically select the entire table.
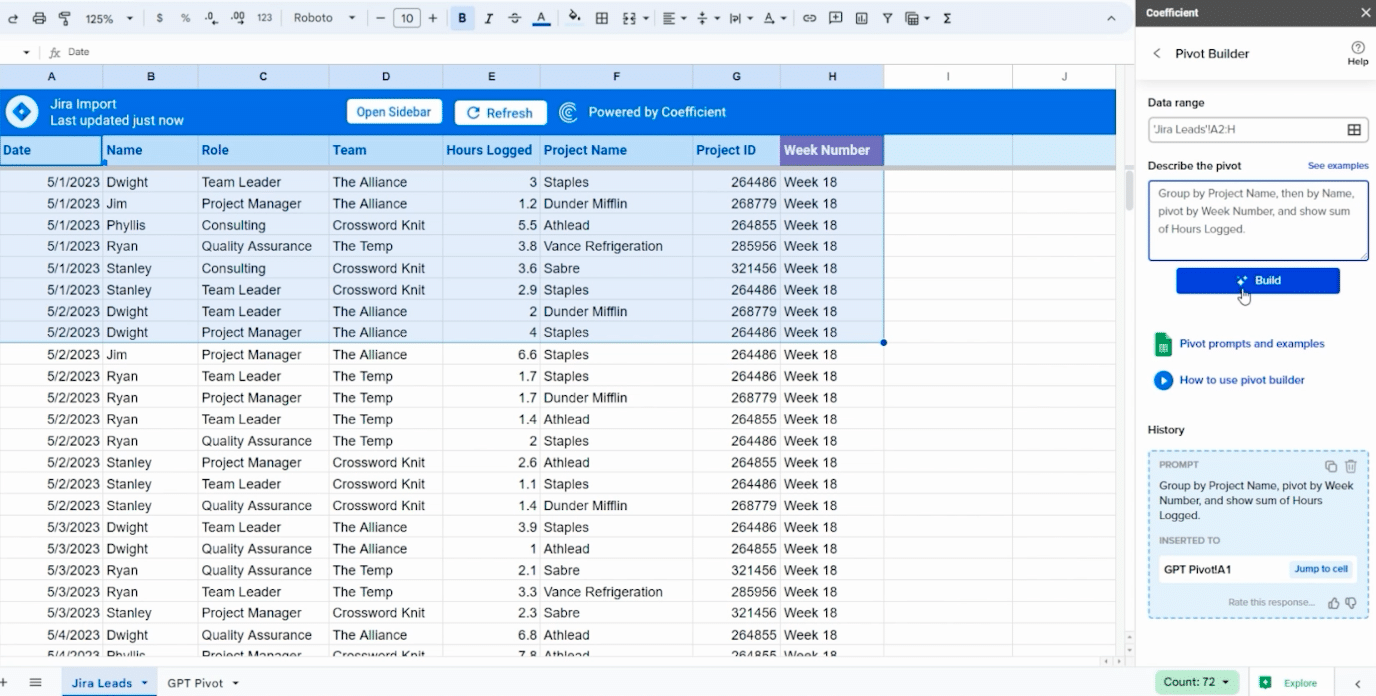
Now, describe the pivot you want to build and click ‘Build:’ “Group by project Name, pivot by Week Number, and show sum of Hours Logged.”
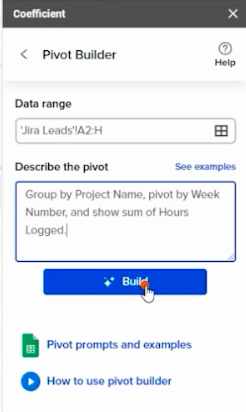
Insert your pivot table into a new sheet.
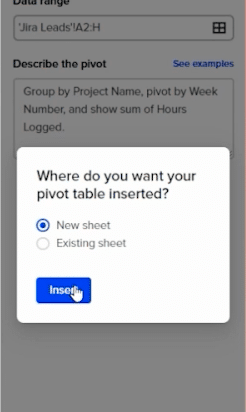
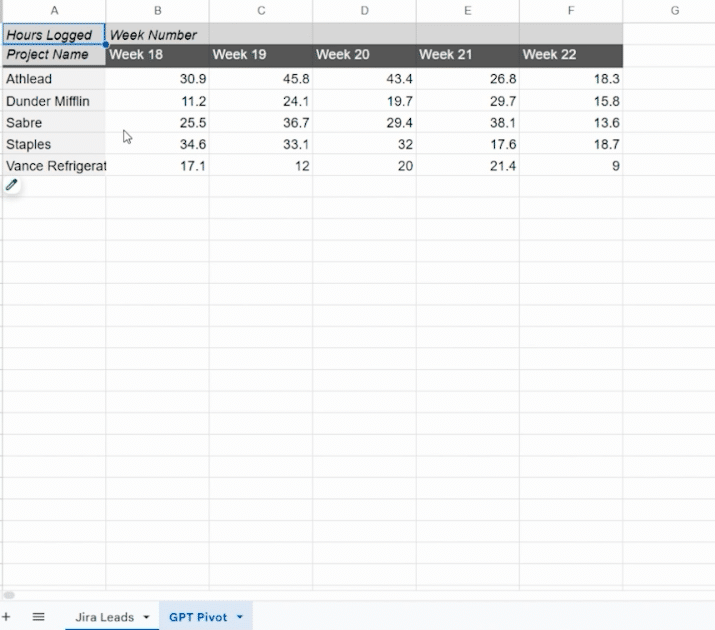
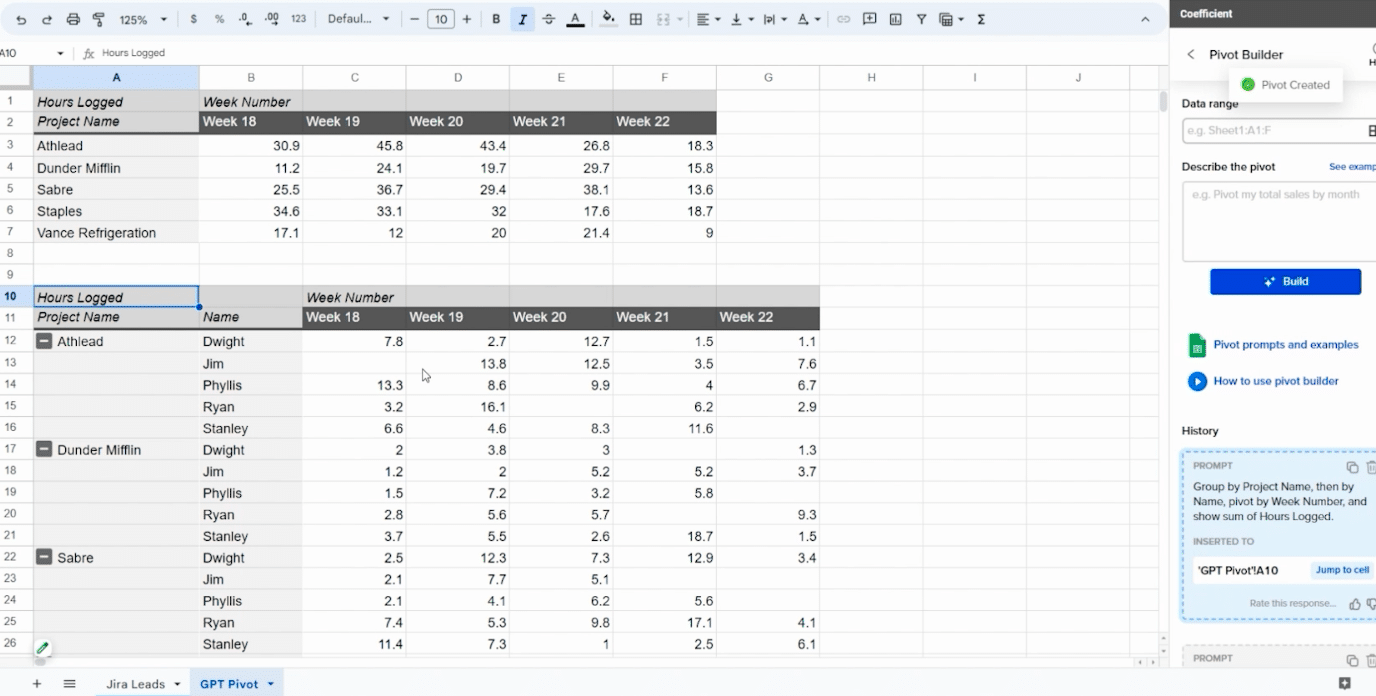
Your data will automatically populate a new sheet. This table will give you a clear overview of how time is being spent on each project each week.
For a more detailed breakdown, you can create a second pivot table grouping by project, then by name, to see how each person’s time is distributed.
Repeat the same steps as above by returning to the GPT Copilot menu -> Pivot Builder -> select your data range -> describe the formula you wish to build -> click ‘Build.’ In this example, “Group by Project Name, pivot by Week Number, and show sum of Hours Logged.”
This time, however, we’ll insert the pivot table into an existing sheet with the previous table.
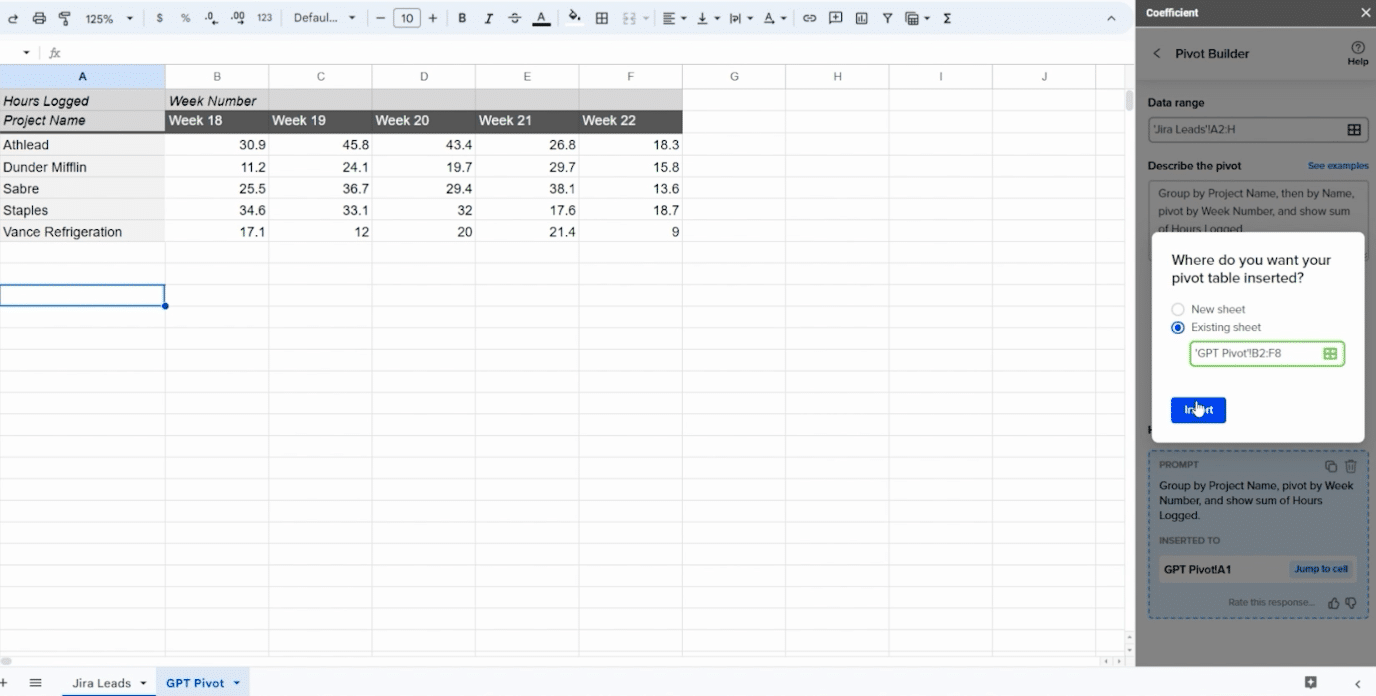
Now you can see a breakdown of time spent on each project by each individual.
Optimize Time Tracking and Resource Allocation in Google Sheets with Coefficient
Coefficient seamlessly integrates time-tracking data from Jira into Google Sheets so you can easily visualize time allotments on projects and so much more.
Install Coefficient for free today and discover how it can streamline your project management and analysis.


