
Struggling with making your Tableau visualizations communicate more effectively?
This blog swiftly guides you through mastering tableau annotations for clearer, more impactful data storytelling. Get ready to discover how annotations can highlight key points and guide your audience through your data insights.
What are Tableau Annotations?
At its core, tableau annotations are textual or graphical markers that add context, clarification, or additional information to specific points, marks, or areas within a Tableau visualization.
Tableau offers several types of annotations, each designed to cater to different storytelling needs:
- Point Annotations: These are tied to specific data points, allowing you to add detailed commentary right where it’s needed most.
- Area Annotations: When you need to discuss a broader trend or a significant swath of your visualization, area annotations come in handy. They enable you to encapsulate larger areas within your visual, providing a macro-level commentary.
- Mark Annotations: Ideal for drawing attention to specific marks within your visual, mark annotations help in detailing or emphasizing particular aspects of your data.
Updating and managing your data, especially when it’s constantly changing, can be tough. That’s where Coefficient comes in, making things easier by directly connecting your spreadsheets to Tableau. This makes your work more efficient and keeps your data insights fresh and relevant.
Step-by-Step Guide to Creating Annotations in Tableau
Before you dive into creating engaging annotations in Tableau, ensuring your data is primed and ready is key. Let’s start from the ground up: accurate and up-to-date data.
- Ensure Data Integrity: Begin by cleaning your data—remove any duplicates and fix inconsistencies. This step is crucial for maintaining the accuracy of your analysis.
- Structure for Success: Organize your data thoughtfully. Split it into dimensions (like categories) and measures (like numbers) to help Tableau process it smoothly.
- Efficiency through Aggregation: When you don’t need to dive deep into every little detail, aggregate your data. This means grouping it together, which can make your system run faster and your insights easier to manage.
Pro Tip: Keeping data updated can be a chore. With Coefficient, it’s a breeze. It links all your business systems to Google Sheets or Excel, making sure your data is always fresh and ready for Tableau.
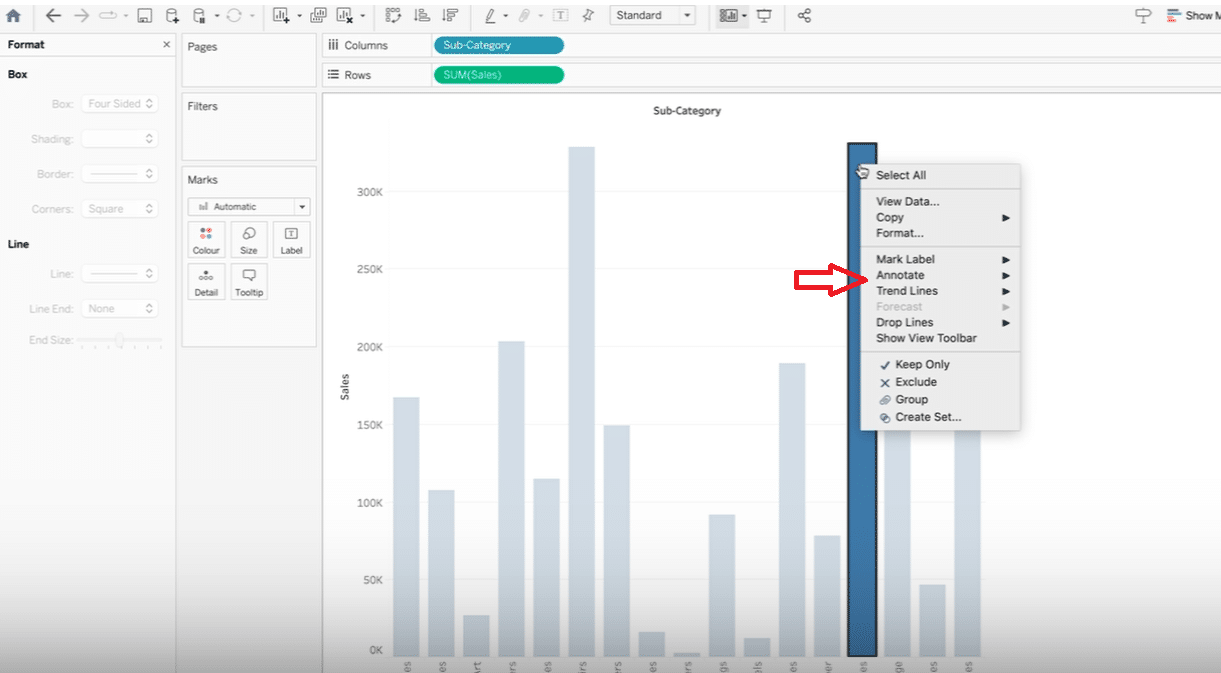
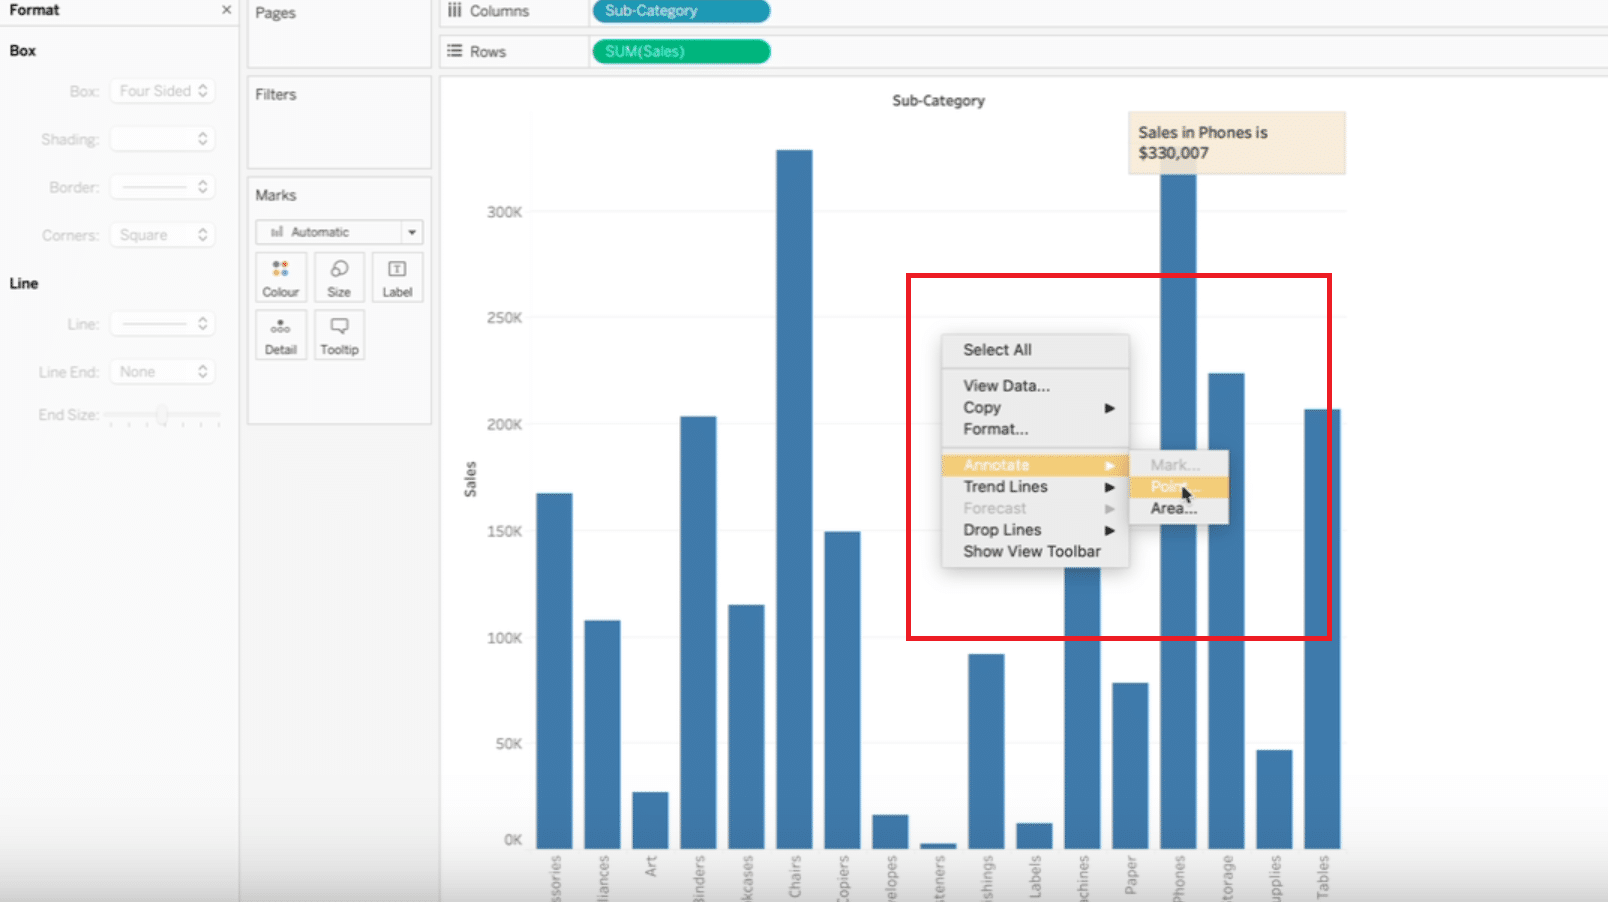
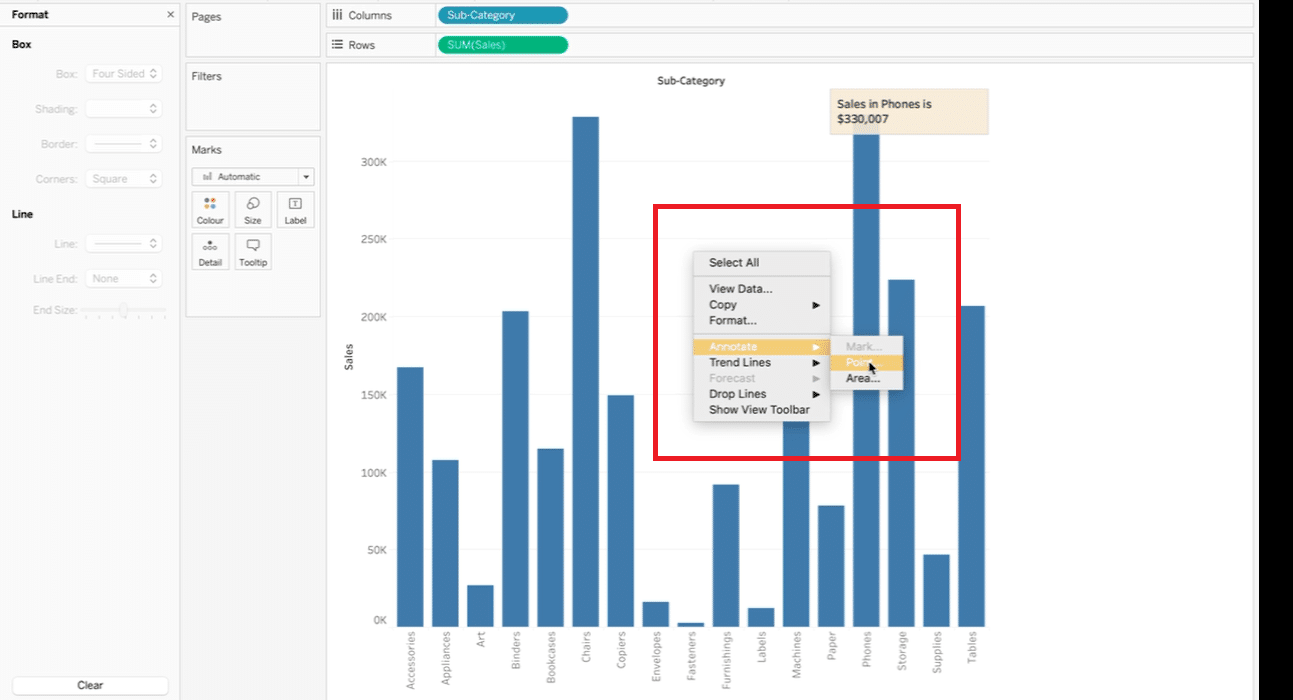
Step 1: Start with Point Annotations
Initiate the process of annotation by selecting a specific data point on your visual. Right-click and navigate to “Annotations” to highlight a data point that you intend to explain or emphasize.
Step 2: Customize Your Annotation
Customize the annotation’s text to suit your narrative. For example, enter a description like “Sales in Subcategory List: $X” to provide explicit insights on what the data point represents.
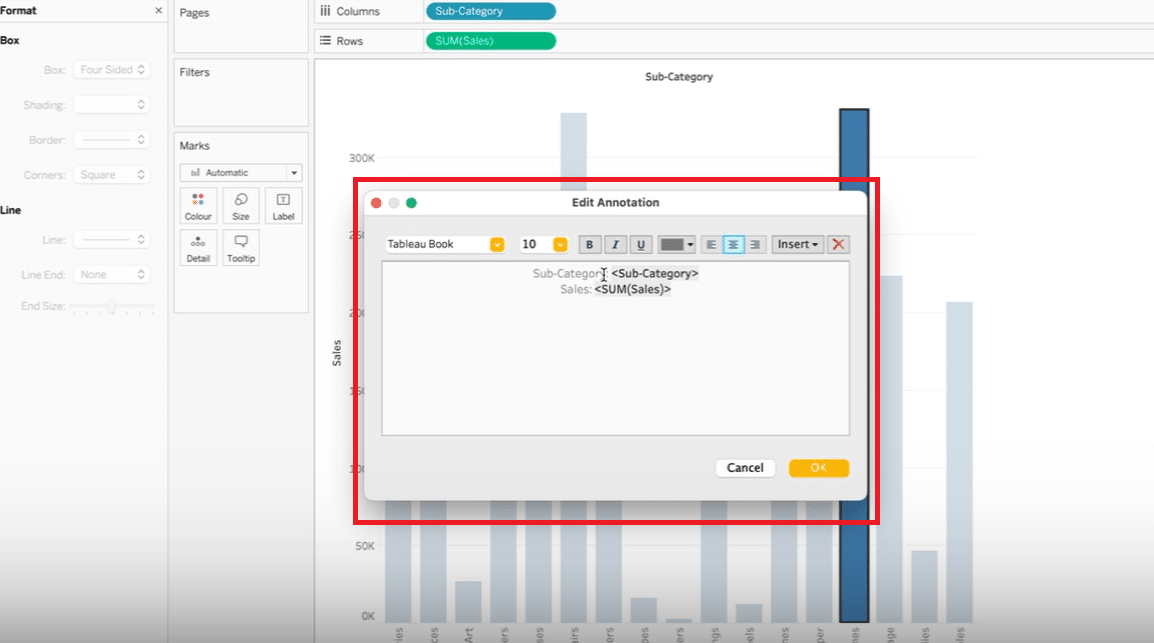
Viewers
Viewers can see the customization interface with example text entered, showing how to make annotations meaningful and relevant.
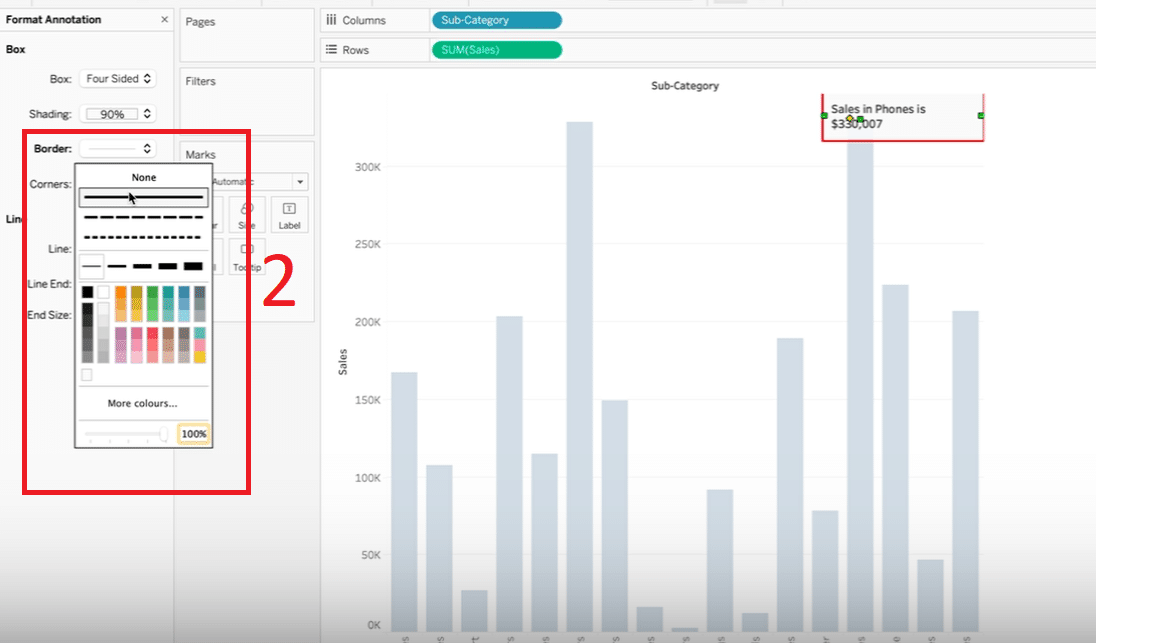
Step 3: Format Annotation for Clarity
Alter the annotation’s box aesthetics such as borders and color to make it visually appealing by clicking on your chart, then ‘Edit.’
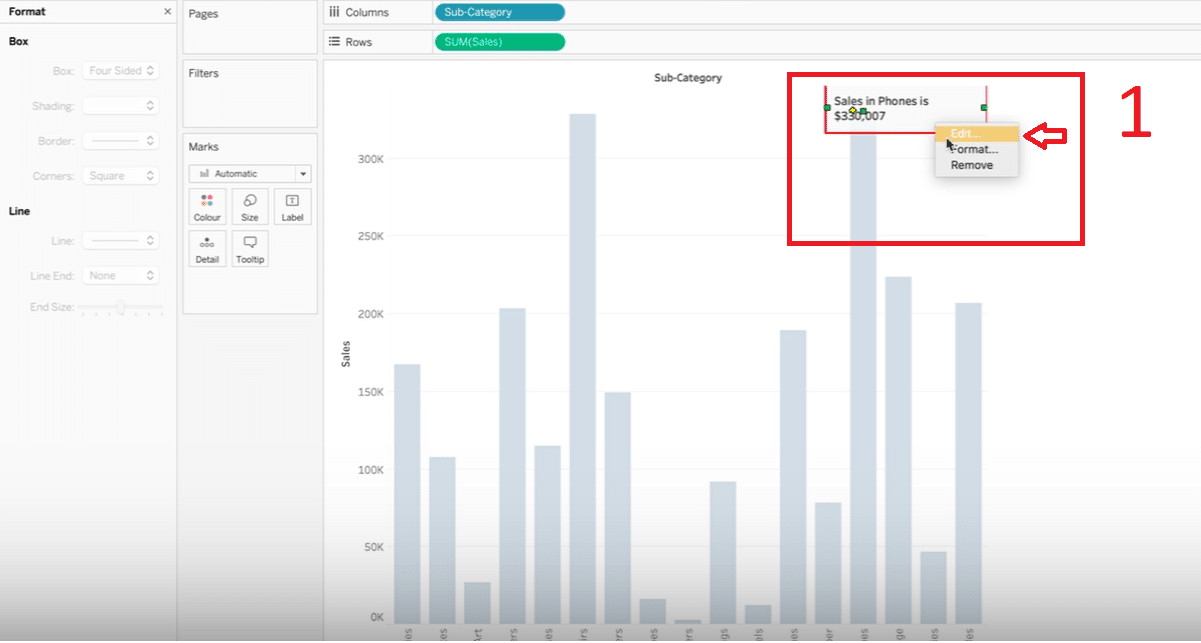
This opens the formatting options for your annotation box.

Stop exporting data manually. Sync data from your business systems into Google Sheets or Excel with Coefficient and set it on a refresh schedule.
Get Started
Step 4: Incorporate Mark Annotations
Utilize mark annotations to spotlight areas or features within your visualization by selecting the ‘Mark’ option under ‘Annotate.’ providing versatility in how you can annotate beyond single points.
Step 5: Dynamically Position Point Annotations
Dynamically move point annotations to desired positions within your visual, enabling you to show the value of a specific point more effectively and ensure that information is clearly conveyed.
Timestamp: 1:02 – 1:21
Screenshot:
Alt Text: “Dragging a Point Annotation in Tableau”
This captures the flexibility of point annotations in Tableau, providing a real-time example of dragging an annotation to a new position.
Step 6: Utilize Area Annotations for Broad Insights
Expand your annotations to encompass areas by choosing ‘Annotate Area’, allowing you to comment on broader trends or categories within your visualization.
Tips and Best Practices for Using Tableau Annotations
- Prioritize Key Insights: Before adding an annotation, ask yourself if this information is crucial for understanding the visual. Prioritize annotations that offer the most significant insights, ensuring they draw attention to the pivotal parts of your data story.
- Maintain Visual Balance: Annotations should enhance, not overpower, your visualization. Place them in a way that maintains the visual’s balance. It’s often effective to place annotations at the periphery of key data points or trends, guiding the eye without obstructing the view.
- Use Arrows and Lines Sparingly: If pointing out specific areas or points, use arrows or linking lines minimally. While they can help direct attention, too many can create visual noise that distracts from the core message of your data.
- Be Clear: Your annotations must be clear and concise. Use simple language that can be easily understood at a glance. Avoid jargon unless you are sure your audience will understand it.
- Be Brief but Significant: Brevity is crucial. Aim for annotations that deliver maximum insight in the fewest words possible. If an annotation becomes a paragraph, it might be better suited as a note in your report or presentation rather than on the visual itself.
- Ensure Relevance: Every annotation should add value and be directly relevant to the visual or the data point it’s associated with. Non-essential commentary can detract from the data’s narrative, leading to confusion or misinterpretation.
- Contextualize Your Annotations: Consider the broader context of the data and the narrative. Annotations should not only explain what is happening in the data but also why it matters. This approach helps in transforming mere observations into insightful analyses.
Conclusion and CTA
Annotations make your data clearer and tell the story you want. With a few clicks, you highlight what’s key in your charts.
Want simple, up-to-date charts? Coefficient can help. Get started with Coefficient.


