Tableau is one of the best data visualization tools available. It is also one of the most expensive, and the pricing page does not tell the full cost story. Here is what Tableau actually costs in 2026, when it earns its price, and which alternatives make more sense for specific use cases.
Tableau Pricing: All Tiers
Tableau Cloud Standard
| Role | Monthly Price (annual billing) | What You Get |
| Creator | $75/user/mo | Tableau Desktop, Prep Builder, full authoring and Cloud publishing |
| Explorer | $42/user/mo | Web-based editing of existing views. Cannot connect to raw data. |
| Viewer | $15/user/mo | Read-only. Filtering and commenting only. |
Tableau Cloud Enterprise
| Role | Monthly Price (annual billing) | Added vs Standard |
| Creator | $115/user/mo | Advanced Management, Data Management add-on, enhanced governance |
| Explorer | $70/user/mo | Enterprise governance features added |
| Viewer | $35/user/mo | Enterprise governance features added |
Tableau+ Bundle (AI features): Requires a sales conversation. Adds Tableau Next, Tableau Agent, Agentforce analytics, Pulse premium, and Salesforce Data Cloud integration. Not on the public price list.
No monthly billing option. All plans require an annual contract. Single-year contracts run 20 to 30% more than multi-year deals.
Every deployment needs at least one Creator. You cannot run Tableau with only Explorers or Viewers. At $900/year minimum, that is the floor.
The Costs the Pricing Page Omits
- Training: $1,500 to $3,000 per Creator license for structured training. Without it, Creator licenses often go underutilised.
- Tableau Server infrastructure (self-hosted): $10,000 to $30,000 per year in hardware and maintenance, plus 0.5 to 1 FTE for administration.
- Annual price escalator: Salesforce contracts typically include a 5 to 7% annual increase. Model that into a 3-year TCO before signing.
A small team of 10 on Standard (2 Creators, 3 Explorers, 5 Viewers) costs $4,212/year in licenses alone. Scale to 50 Creators, 100 Explorers, 500 Viewers on Enterprise and you are looking at over $360,000/year before implementation and training.
When Tableau Is Worth the Price
Complex visualization requirements. No alternative fully matches Tableau’s chart library, spatial analysis, and deep customization. If your use case requires advanced custom visualizations, Tableau is the right choice.
Salesforce ecosystem alignment. If your organization is invested in Salesforce Sales Cloud, Service Cloud, or Data Cloud, bundled Tableau pricing through Salesforce often represents good value. The integration is native.
Enterprise governance at scale. For 500+ users with strict row-level security, centralized data policies, and compliance requirements, Tableau Enterprise’s governance layer justifies the cost.
When Tableau Is Not Worth the Price
- Teams whose primary need is live CRM or finance data in shareable dashboards, not advanced visualization.
- RevOps and finance teams who need fresh data, not visualization depth.
- Any team that needs to update source records from a dashboard (all BI tools are read-only).
- Organizations sharing dashboards with 50+ stakeholders who will not pay $15+ per month per viewer for read-only access.
Six Alternatives Worth Evaluating
Power BI
Microsoft’s BI platform. Pro: $14/user/month. Copilot AI add-on: $30/user/month. Fabric F64 capacity: approximately $8,000/month. Best for organizations already invested in Microsoft 365 and Azure. Limitation: DAX formula language has a steep learning curve, and real-time streaming is more limited than demos suggest.
Looker Studio
Google’s free BI tool. Pro version: $9/user/month. Best for small teams working with Google Analytics, BigQuery, and Google Ads. Easy to share dashboards publicly. Limitation: connector depth is narrower than paid tools and there is no write-back.
Coefficient
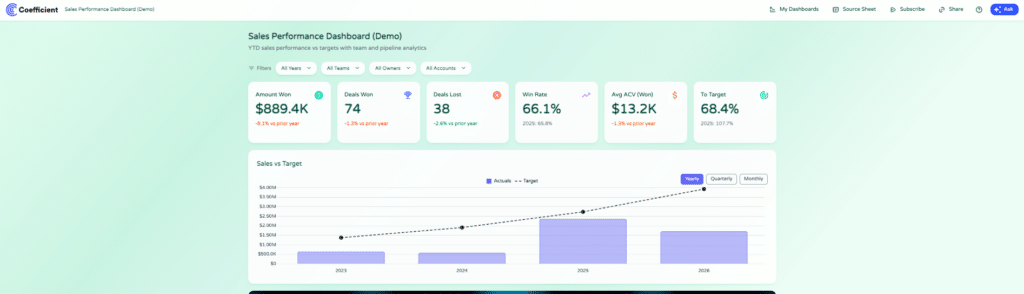
Coefficient connects 150+ data sources to Google Sheets and Excel with scheduled auto-refresh, AI-generated web dashboards, and free viewer seats. Best for RevOps, finance, and ops teams who live in spreadsheets and need live data from Salesforce, HubSpot, QuickBooks, Snowflake, or NetSuite without per-user licensing.

Stop exporting data manually. Sync data from your business systems into Google Sheets or Excel with Coefficient and set it on a refresh schedule.
Get Started
Two-way sync is available for Salesforce, HubSpot, NetSuite, QuickBooks, Snowflake, MySQL, MS SQL Server, PostgreSQL, BigQuery, and Redshift. Free plan available. Paid plans from $49/month, no per-user fees.
Looker (Enterprise)
Google’s enterprise BI platform with a governed semantic layer. Platform fee approximately $5,000/month plus $30 to $125/user/month depending on role. Best for large organizations needing standardized metric definitions across hundreds of users. Limitation: expensive for smaller organizations and implementation takes months.
Qlik Cloud
AI-assisted analytics platform. Starter: $825/month (20 users). Standard: $2,500/month (20 users). Best for organizations that need pattern discovery across complex datasets. Limitation: steeper learning curve than Power BI.
Metabase
Open-source BI tool, self-hosted or managed. Free for self-hosted. Pro: approximately $85/month. Best for technical teams who want SQL access alongside simple dashboards for less technical users. Limitation: requires some SQL knowledge for advanced reports.
Comparison Table
| Tool | Best For | Starting Price | Per-User Fee | Free Viewer Seats | Two-Way Sync |
| Tableau | Visualization depth, Salesforce orgs | $75/user/mo | Yes | No | No |
| Power BI | Microsoft orgs | $14/user/mo | Yes | No | No |
| Looker Studio | Small teams, free tier | Free | No | Yes (public) | No |
| Coefficient | Sheets/Excel + live data | Free / $49/mo | No | Yes | Yes |
| Looker | Enterprise semantic layer | ~$5K/mo+ | Yes | No | No |
| Qlik Cloud | AI-assisted analytics | $825/mo | No (seat tiers) | No | No |
Bottom Line
Buy Tableau if you need the deepest visualization library available, you are already in the Salesforce ecosystem, and you have 50+ users who need governed dashboards with strict access control.
If your primary need is live operational data in shareable dashboards without per-viewer licensing, evaluate the alternatives first. Coefficient is free to start.


