Every Sunday night, someone on the revenue team downloads a CSV from Salesforce, pastes it into a Google Sheet, reformats three columns, drops it into a slide, and sends it to leadership before Monday’s call. The report looks fine. The data is already 72 hours old.
This is the static trap, and it’s more common than anyone wants to admit. The uncomfortable part is not that static reports exist. It’s that most teams use them for use cases where the data is supposed to move.
The conversation around reporting tends to collapse into a binary: static versus dynamic. That framing misses a third mode that sits between them: live reporting. It also misses where AI is now changing the dynamic end of the spectrum. The three modes are distinct. They serve different purposes, require different infrastructure, and create different outcomes when applied to the wrong job.
This piece defines all three clearly, puts them side by side, and makes the case for when each one earns its place.
What Is Static Reporting?
A static report is a frozen snapshot. Data is captured at a specific moment, formatted into a document or file, and distributed. Once it leaves the source, it doesn’t update. The numbers on page three of that PDF you emailed last Friday are the numbers from last Friday, full stop.
The formats are familiar: PDF exports, formatted Excel files, Google Sheets tabs populated by a paste, PowerPoint slides with embedded charts. The defining characteristic is not the format. It’s the severed connection. Once the data leaves its source system, the report and the system are no longer talking.
Static reporting is not inherently broken. There are contexts where a frozen record is exactly what you need. Board presentations that get filed. Year-end financial statements. Regulatory submissions. Audit documentation. These are use cases where the data should be frozen, because changing numbers after distribution would create more problems than it solves.
The problem is when static becomes the default for everything. When the pipeline review runs on a CSV from three days ago. When the weekly marketing report is a deck rebuilt every Friday morning by someone who should be doing analysis instead. When “sending the numbers” means downloading, formatting, and distributing. On a loop, forever.
| The signal that static has outgrown its role: when the person who owns the report spends more time updating it than reading it. |
What Is Live Reporting?
Live reporting keeps the connection open. Instead of exporting data and cutting the cord, the report maintains a direct link to the source system. It refreshes automatically, hourly, daily or weekly, so when someone opens it, they see current data, not the state of things at export time.
The format can still be a spreadsheet or a dashboard. What changes is the plumbing underneath. A Salesforce pipeline report in Google Sheets that pulls fresh data every morning at 7am is a live report. Nobody touched it overnight. Nobody downloaded anything. Leadership opens it at 8am and sees yesterday’s activity, today.
This is where the practical value compounds. The report still looks like a spreadsheet. The audience doesn’t need new tools or training. But the maintenance burden drops to near zero, and the data is always current at the moment of decision.
Live reporting is the right model for recurring operational use cases: pipeline dashboards, weekly marketing performance, finance close tracking, sales scorecards. Anything that runs on a cadence and needs to reflect where things actually stand. Not where they stood when someone last had time to pull a CSV.
Tools like Coefficient handle this layer: 150+ connectors to source systems, scheduled auto-refresh, and two-way sync so data flows in both directions. The spreadsheet stays connected to the system of record without anyone managing the connection manually.
What Is Dynamic AI Reporting?
Dynamic AI reporting is live reporting with a conversational interface on top. The data is still connected and refreshing. What changes is how you interact with it.
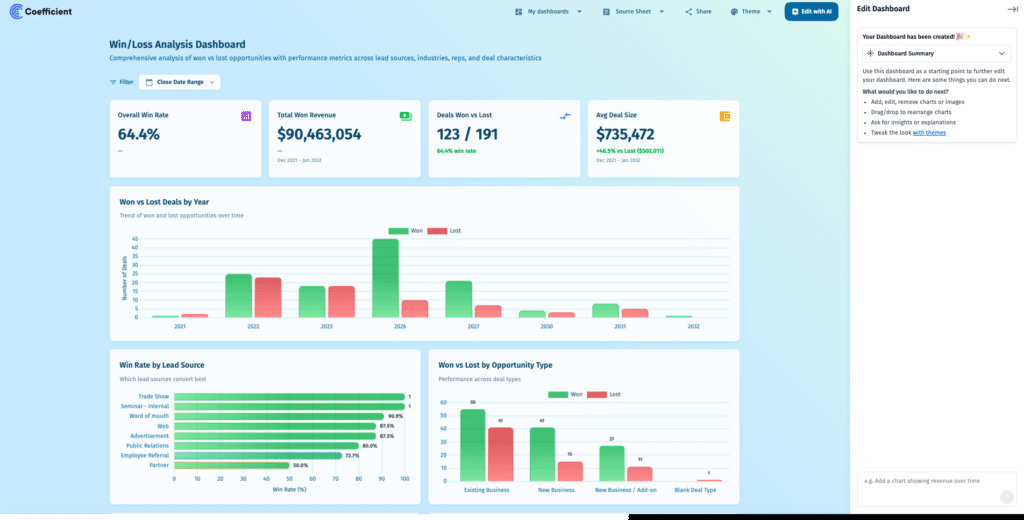
Instead of opening a pre-built dashboard and reading what’s there, you ask a question. “Show me win rate by deal size for Q1 versus Q2, Enterprise segment only.” The system queries live data, generates the chart, and returns an answer: no SQL, no configuration, no analyst in the middle. You follow up. “What changed in Q2?” The system pulls activity and stage data and surfaces the pattern.
MIT Sloan formally defined vibe analytics, the broader practice this sits within, in February 2026 as “an approach to data analysis that lets decision makers engage directly with data through AI-powered conversation.” The definition captures what makes this mode distinct: the interface is the conversation, not the chart template.
The output is also different. Dynamic AI reporting produces shareable live dashboards: not files, not slides. A URL that updates automatically as data refreshes. Stakeholders access it without needing tool access or a license. The dashboard stays current. Nobody maintains it between views.
What this mode is not: a replacement for data governance, or a way to get good answers from bad data. AI working on a stale CSV gives fast wrong answers with high confidence. The live data layer is the prerequisite. The AI is the interface on top of it, not a substitute for the foundation beneath it.
Coefficient’s Live Web Dashboards are the implementation of this: AI chat that builds BI-quality web dashboards from Google Sheets or Excel data connected to live source systems, in plain English.

Supercharge your spreadsheets with GPT-powered AI tools for building formulas, charts, pivots, SQL and more. Simple prompts for automatic generation.

Static vs Live vs Dynamic AI Reporting Comparison
Most teams operate across all three modes depending on context. The comparison below maps each to the dimensions that matter for actual decisions, not a theoretical framework, but the practical differences that determine which mode belongs where.
| Dimension | Static | Live | Dynamic AI |
|---|---|---|---|
| Data freshness | Point-in-time at export | Current as of last refresh | Real-time on demand |
| Manual work | Every update is manual | None after setup | None |
| Interactivity | None | Limited | Conversational |
| Skill required | Low | Low | None. Plain English only |
| Sharing model | File or attachment | Spreadsheet or dashboard link | URL. No tool access needed |
| Best for | Board packs, audits, filings | Recurring operational reports | Ad hoc analysis, self-serve BI |
The table makes one thing clear: no single mode wins across all dimensions. Static has a legitimate place. Live handles the operational middle. Dynamic AI handles the questions that don’t fit a preset template. The error is not using static. It’s using static where live or dynamic AI would cost a fraction of the maintenance effort and return better answers.
Which Mode Belongs Where
- Static earns its place when the data needs to be frozen and auditable. Board presentations, regulatory filings, year-end closes, compliance documentation: contexts where the numbers need to be signed off and unchanging. The report is a record, not a window.
- Live reporting is the right call for anything recurring and operational: pipeline reviews, campaign performance tracking, weekly finance dashboards, sales scorecards. The audience asks the same questions every week. The data changes. A static export answered yesterday’s version of those questions. A live report answers them today.
- Dynamic AI reporting handles the questions that don’t fit a pre-built template. Attribution analysis that changes shape depending on what a CMO is curious about this week. A revenue model that finance needs to stress-test against three different assumptions. An ad hoc deep dive that nobody anticipated when the dashboard was configured. These aren’t repeating reports. They’re conversations with data. The AI interface makes them accessible without an analyst in the loop.
The risk is not choosing the wrong mode occasionally. It’s defaulting to static for everything because it requires no setup, and then spending hundreds of collective hours per year on manual refresh work that could be eliminated.
Where AI Changes the Equation
AI doesn’t replace live reporting. It extends it. Scheduled refresh gives you current data. AI gives you the ability to interact with that data without a ticket, a query, or a wait.
The practical shift is who can analyze data. Live reporting requires someone to know what questions to ask in advance. The dashboard was built around those questions. Dynamic AI reporting lets the question come first. A marketing manager who has never written SQL can ask “what drove the spike in CPL in week three of last month” and get an answer from live ad platform data in minutes, not days.
This is what Klaviyo operationalized. Their BI team used Coefficient to extend Snowflake data to 50+ business users across the company, in finance, marketing and RevOps, without requiring SQL skills or BI tool licenses. Reports that previously took months to build were running in days. Evan Cover, Director of BI Engineering and Governance, framed the challenge plainly: “We had to move fast, iterate, and ensure data from Snowflake was accessible for non-technical users.” Live data connectivity was the foundation. AI-accessible reporting was the outcome.
The one thing AI does not solve: data quality at the source. A dynamic AI interface on top of inconsistent, stale, or ungoverned data produces confident wrong answers faster than any analyst could. The sequence matters: live data layer first, AI interface second. Skipping the first step and hoping AI covers it is how teams end up trusting numbers they shouldn’t.
For teams whose work lives in spreadsheets, the practical path is a live data connectivity layer: 150+ source system connectors, scheduled refresh, two-way sync, with AI dashboarding built on top. That’s the stack. The dashboard templates at Coefficient show what this looks like across common reporting use cases.
The Bottom Line
Static, live, and dynamic AI reporting are not competing philosophies. They’re tools for different jobs. Static belongs where data needs to be frozen. Live belongs where data needs to be current. Dynamic AI belongs where the questions are unpredictable.
The teams that get this right stop rebuilding the same report every week and start spending that time on the analysis that actually changes decisions. That shift starts with replacing one manual export with a live connection, and building from there.
Try Coefficient free and connect your first data source in minutes. Not a standalone BI platform. Works inside Google Sheets and Excel.


