SalesOps teams are always searching for ways to boost efficiency and productivity.
However, sales teams are often restricted due to the reporting and sharing capabilities of Salesforce. The limitations directly impact teams’ abilities to effectively track and analyze sales performance.
But Google Sheets filter views offer a way around this. Filter views are ideal for creating custom reports that spotlight individual sales performance, enabling easy sharing directly within Google Sheets.
An added advantage of Filter Views is that they allow each team member to filter data independently without disrupting others’ views.
Here’s how you can use Google Sheets filter views to create custom reports for your team, so you can track individual and overall sales performance.
Step 1: Install Coefficient
Coefficient is a free solution that lets you connect your business systems to Google Sheets and instantly pull live data into your spreadsheet.
Simply download the Coefficient app in the Google Marketplace, connect it with your data source of choice, and start pulling data instantly.
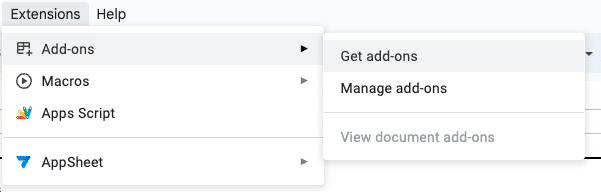
To install Coefficient, go to the top ribbon of your Google Sheet and click ‘Extensions’ -> ‘Add-ons’ -> ‘Get add-ons.’
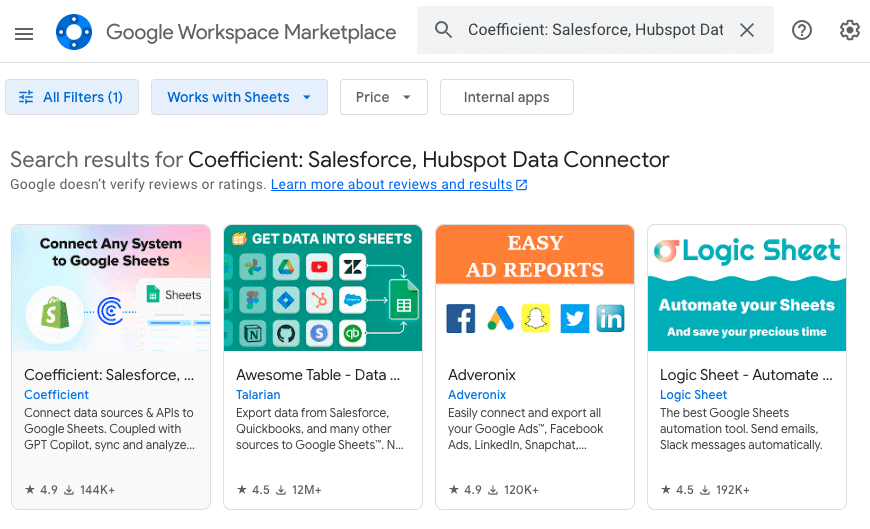
Search for ‘Coefficient’ in the Google Workspace Marketplace menu bar. The Coefficient app will be the first result on the left, like below.
Step 2: Import Live Salesforce Data
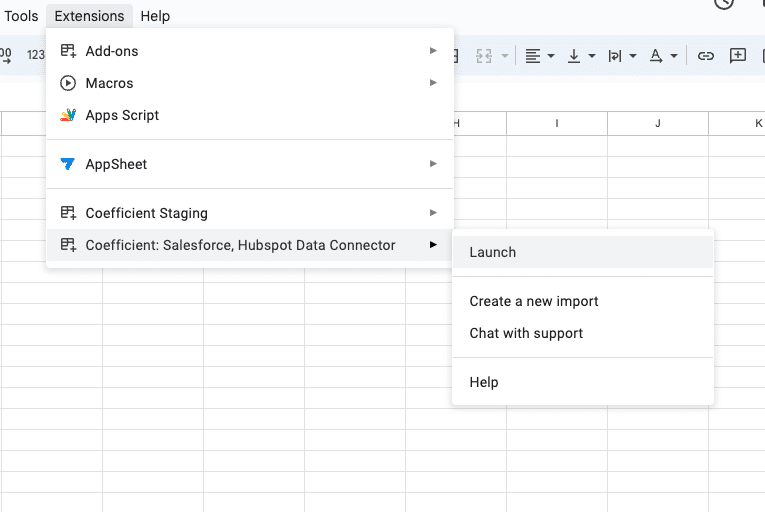
Now, let’s walk through how to import your live Salesforce data with Coefficient. Launch the Coefficient app from the extensions menu on the top ribbon.
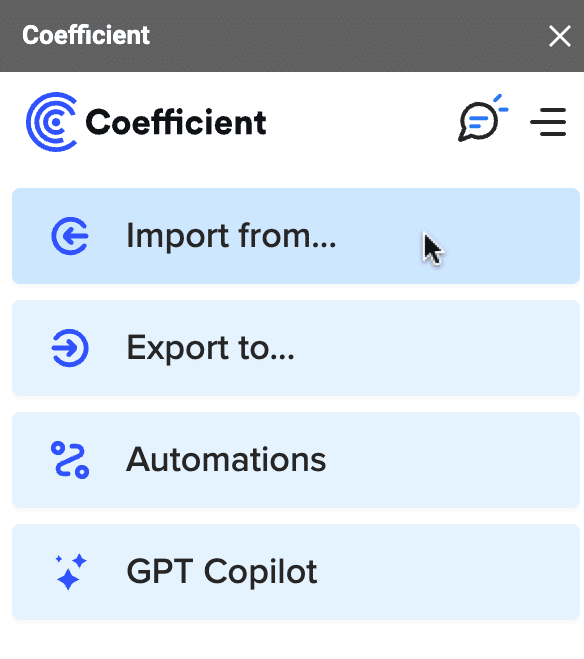
Coefficient will launch as a side panel. Choose ‘Import from…’
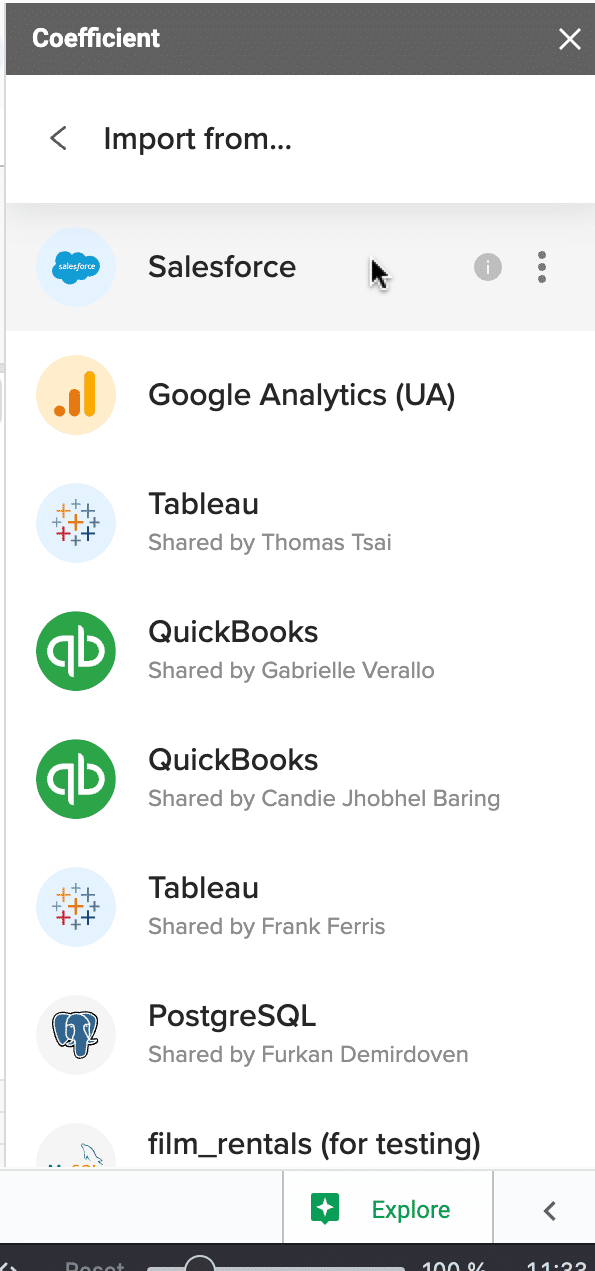
Select ‘Salesforce’ from the list of data sources.
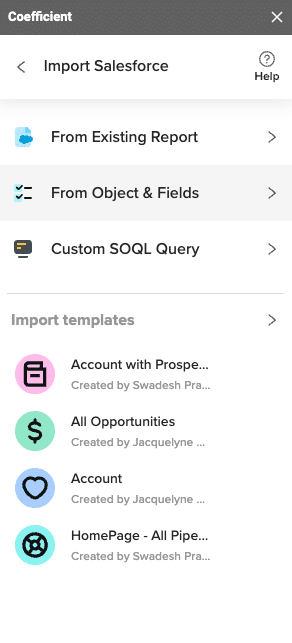
Click ‘From Objects & Fields.’
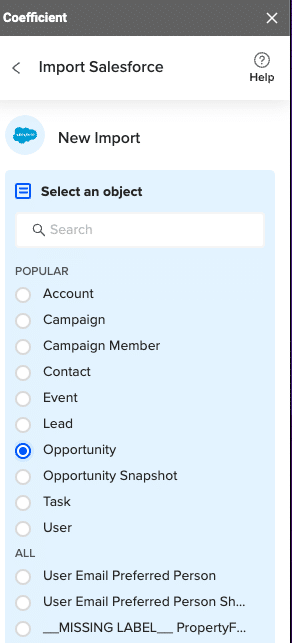
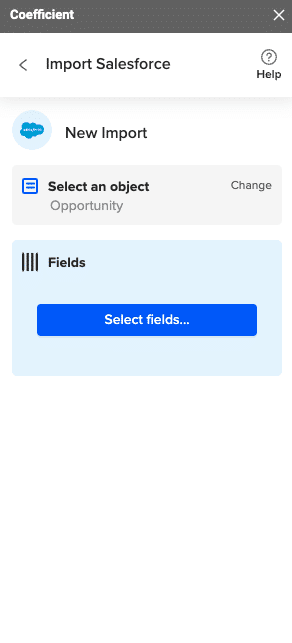
Select ‘Opportunity’ as your field.
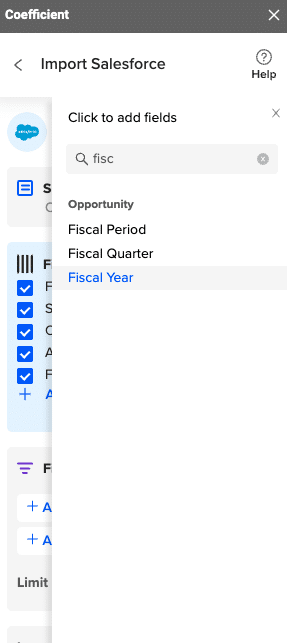
Choose Select fields…
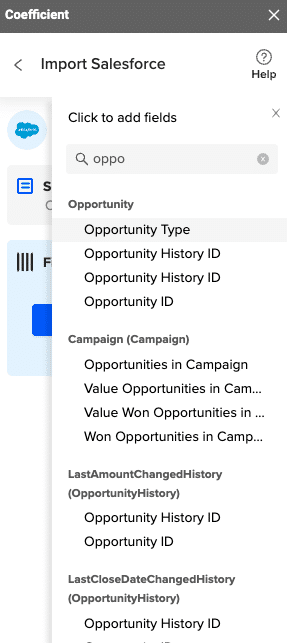
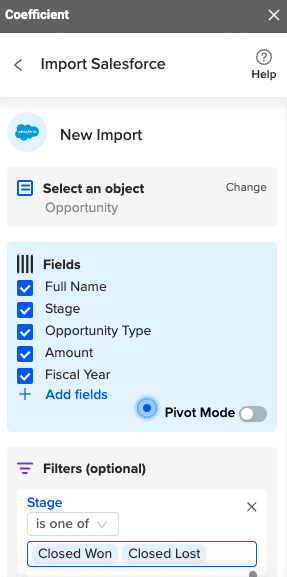
In this example, we will visualize year-over-year sales performance for a given rep. For this example, we’ll start by selecting ‘Opportunity Type.’
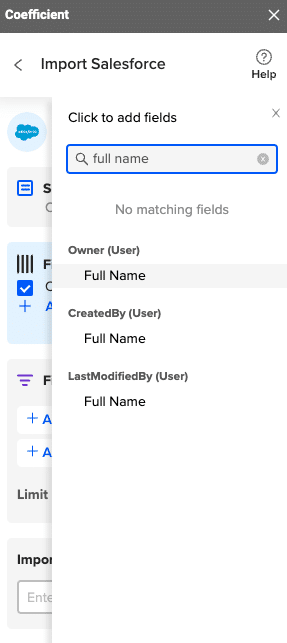
Now choose ‘Full Name’.
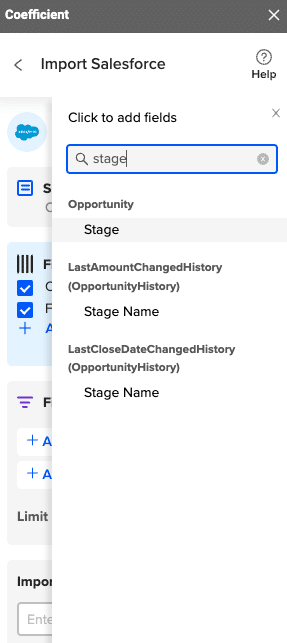
Select ‘Stage’.
Choose ‘Amount’.

And ‘Fiscal Year’.
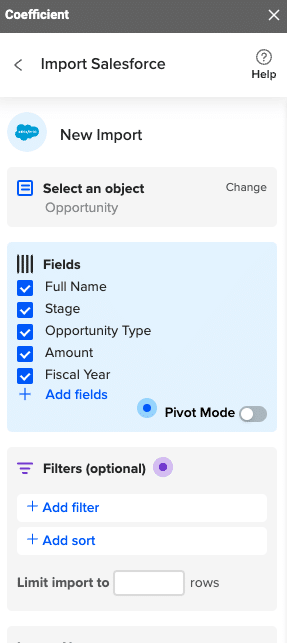
Your final list should look like this:
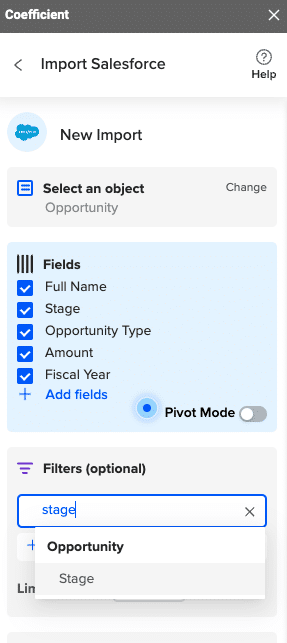
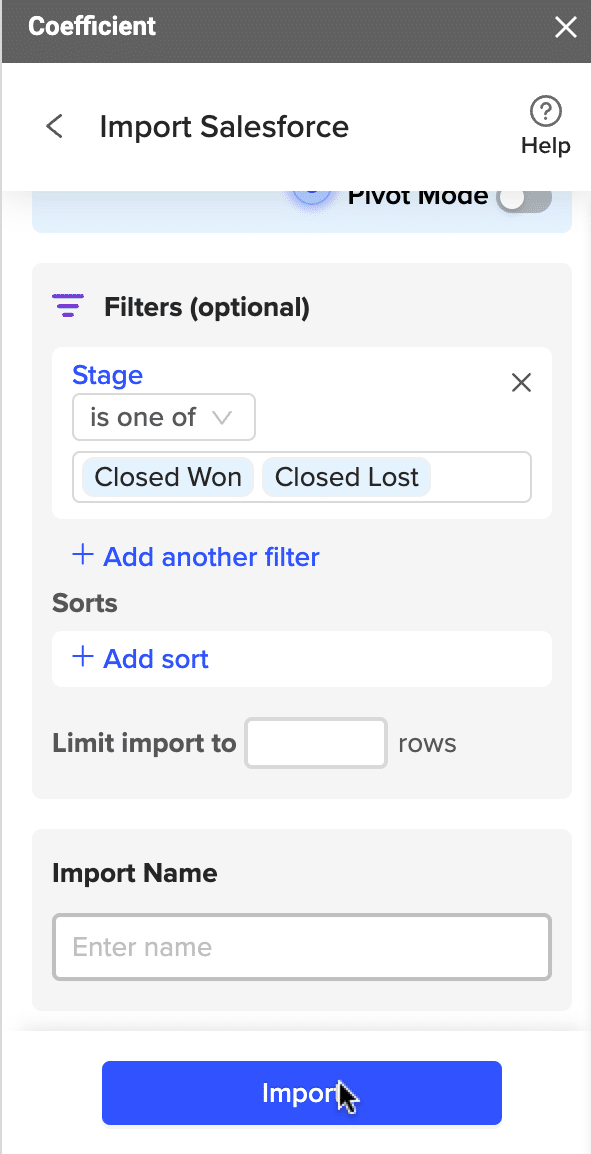
Now add a filter to display only ‘Closed Won’ and ‘Closed Lost’ deals.
Click ‘Add Filter’ and choose ‘Stage.’
Select ‘Is one of.’
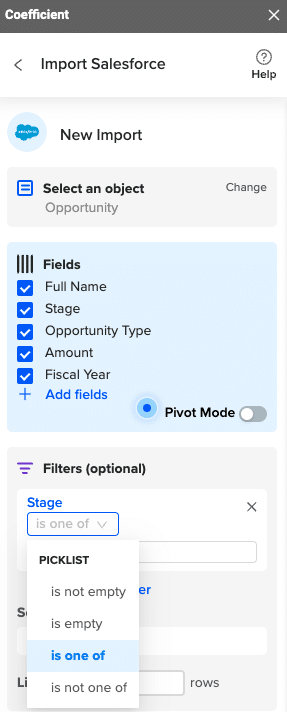
Choose ‘Closed won’ and ‘Closed lost’ as stages.
Name your import. Then click ‘Import.’
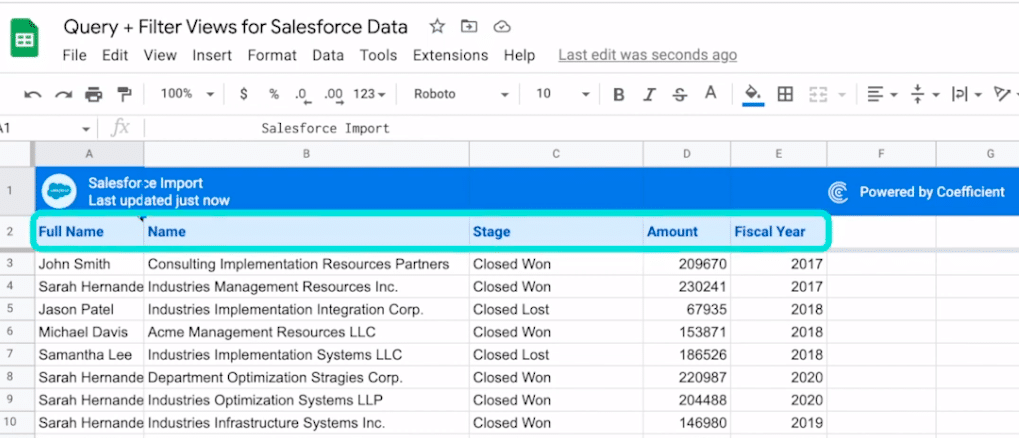
Your import will look something like this:
Now let’s use filter views in Google Sheets to view performance for individual sales reps.

Stop exporting data manually. Sync data from your business systems into Google Sheets or Excel with Coefficient and set it on a refresh schedule.

Step 3: View Performance by Sales Rep
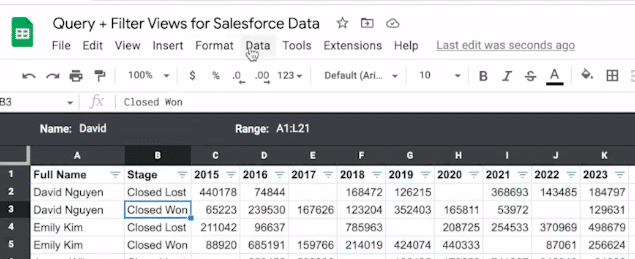
Open a new tab in Google Sheets. Insert this QUERY formula in cell A1:
=QUERY(‘⚡ Salesforce Import ‘!A2:E,”select A,C,sum(D) where A is not null group by A,C pivot E”,1)
Note: Replace ‘⚡ Salesforce Import’ with the name of your import.
A table of your sales reps will appear. Next, we’ll apply a filter to these columns so we can segment our reps by name.
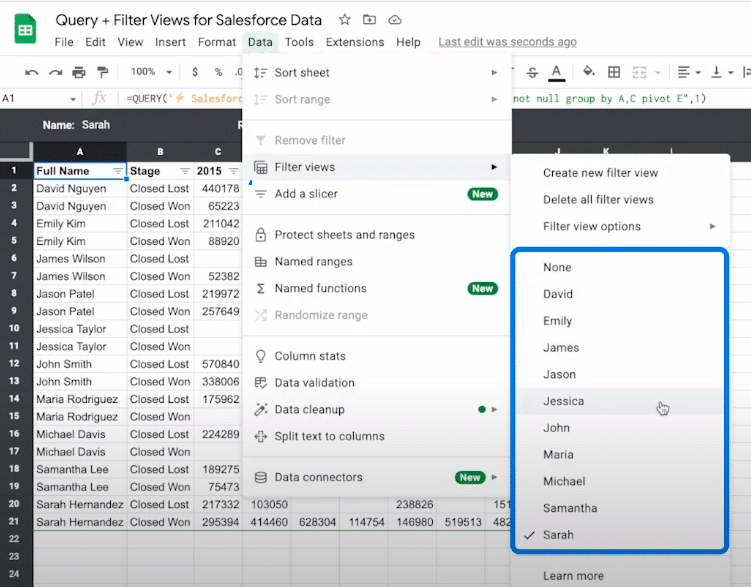
Highlight your table. Navigate to Data -> Filter views -> Create new filter view.
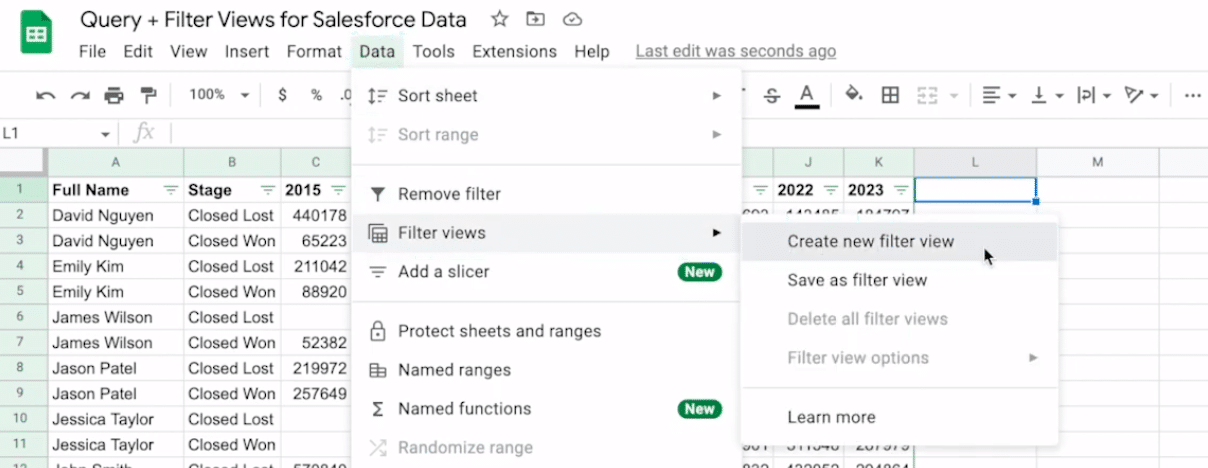
Name this filter view for each sales rep so they can filter on data that’s relevant to them.
Repeat this step for every member of your sales team.
And there you have it! You’ve now created custom filter views for each member of your sales team.
Simply share the Google Sheet with your team. Now they can filter their own data with point-and-click simplicity.
Now, each team member can create their own view and not affect their teammate’s viewing capabilities using a saved view in one of two ways.
The first is going to the top ribbon, selecting ’…’ in the top right corner, and click on the filter settings highlighted blue in the image below.
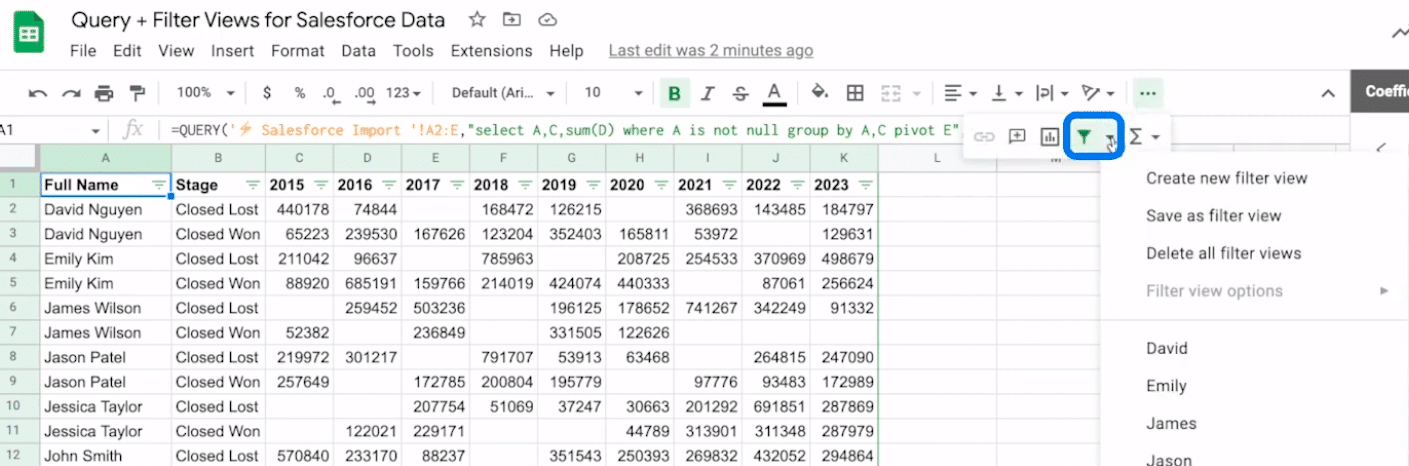
Click the dropdown and then click on your desired view.
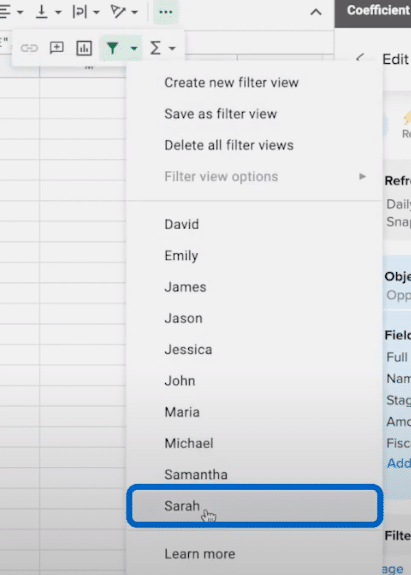
And that’s it! Now you can view sales performance for your reps and team in a shareable, filterable spreadsheet.
Use Google Sheets Filter Views to Track Individual Sales Performance
By leveraging your live Salesforce data in Google Sheets, you can create filtered views of your sales reps so your team can track individual performance over time.
And the best part? The entire process only requires a few, easy-to-follow steps, as outlined in this blog.
Coefficient allows you import your real-time Salesforce data into Google Sheets automatically, without any manual work.
Get started for free with Coefficient today to start importing live Salesforce data instantly.


