

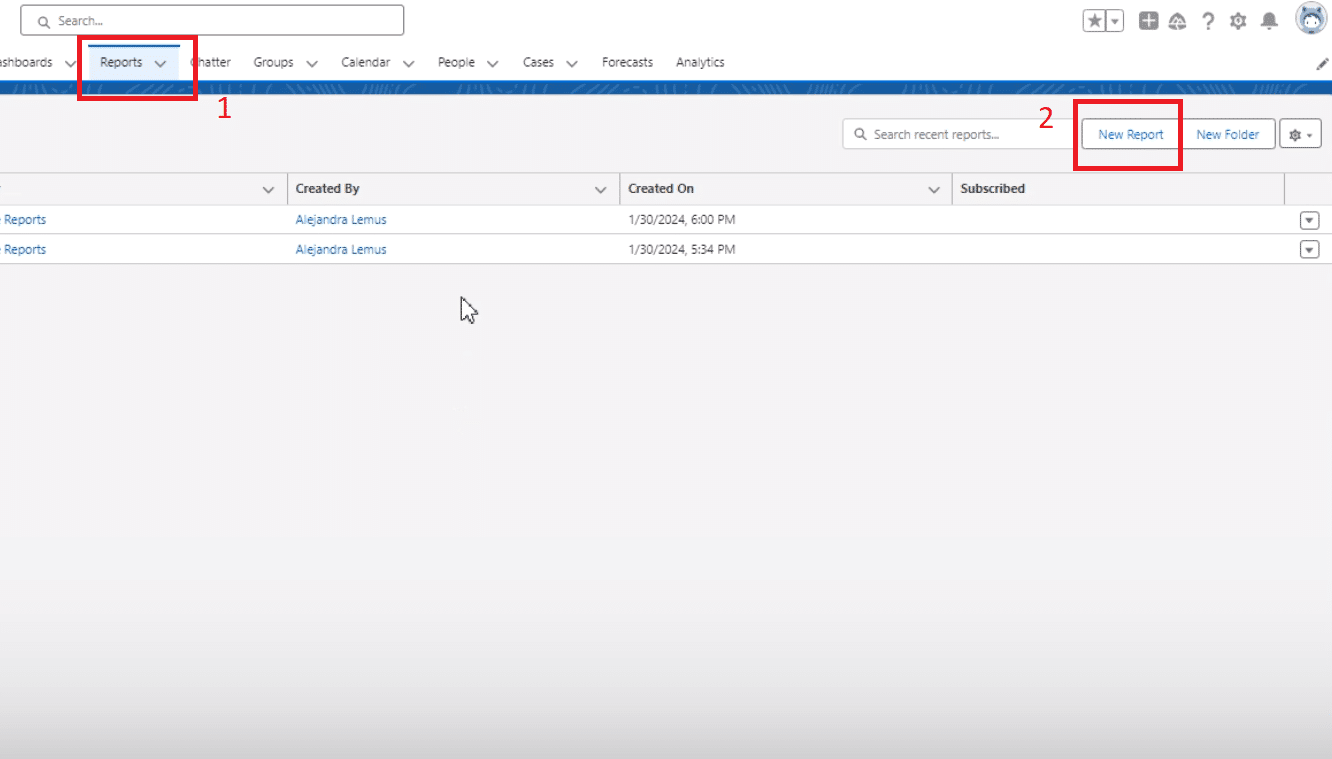
Log into Salesforce and navigate to the Report tab on the dashboard
Create a new opportunity report and select relevant fields: Opportunity Owner, Opportunity Name, Stage, Amount, Won, and Closed
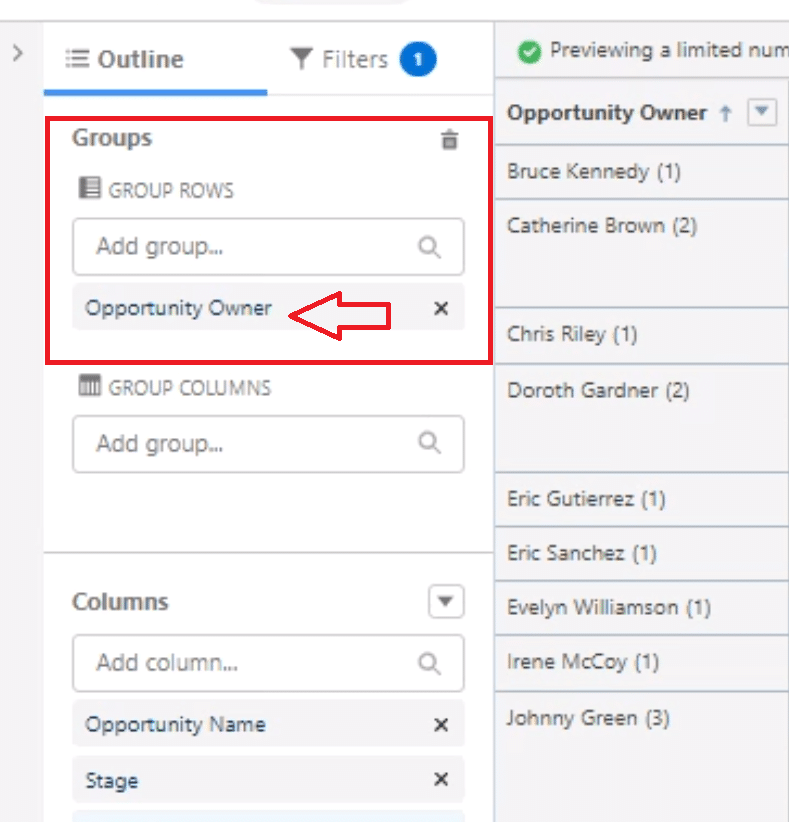
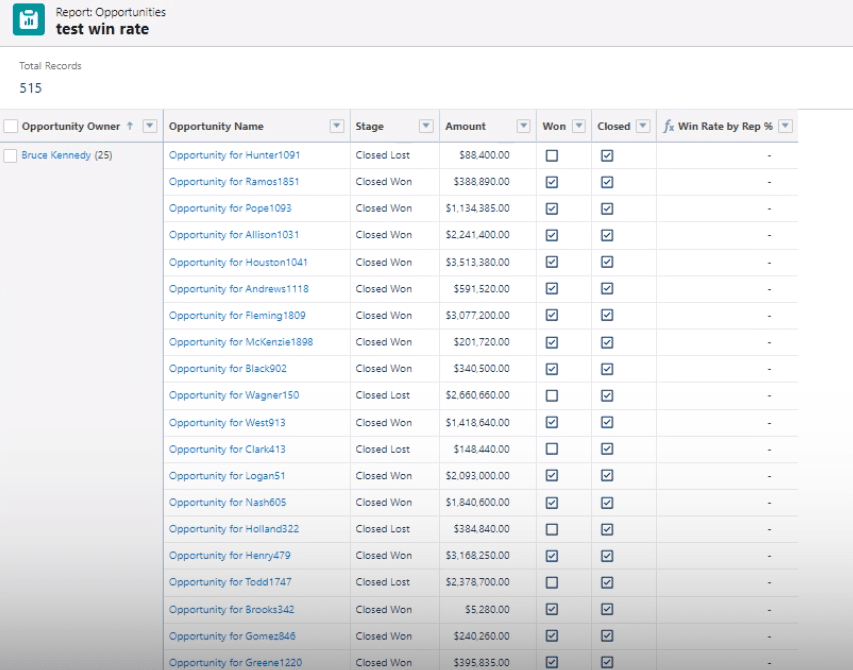
Group your report by Opportunity Owner to analyze win rate by each sales rep
Add a summary formula named “Win rate by rep percentage” with percent output
Build the formula: number of won opportunities divided by total opportunities for each sales rep
Adjust the close date filter to include all closed opportunities, not just closed-won
Save and run your report, then add detailed win rate data in the report rows
Understanding your win rate in Salesforce is crucial for improving sales outcomes.
This guide is designed to help anyone, from beginners to advanced users, learn how to calculate win rates by sales rep using Salesforce.
By using our pre-built template or alternatively, following these simple steps to build in Salesforce, you’ll gain valuable insights to make informed decisions for your sales strategies.
Leverage a Pre-Built Salesforce Win Rate Template
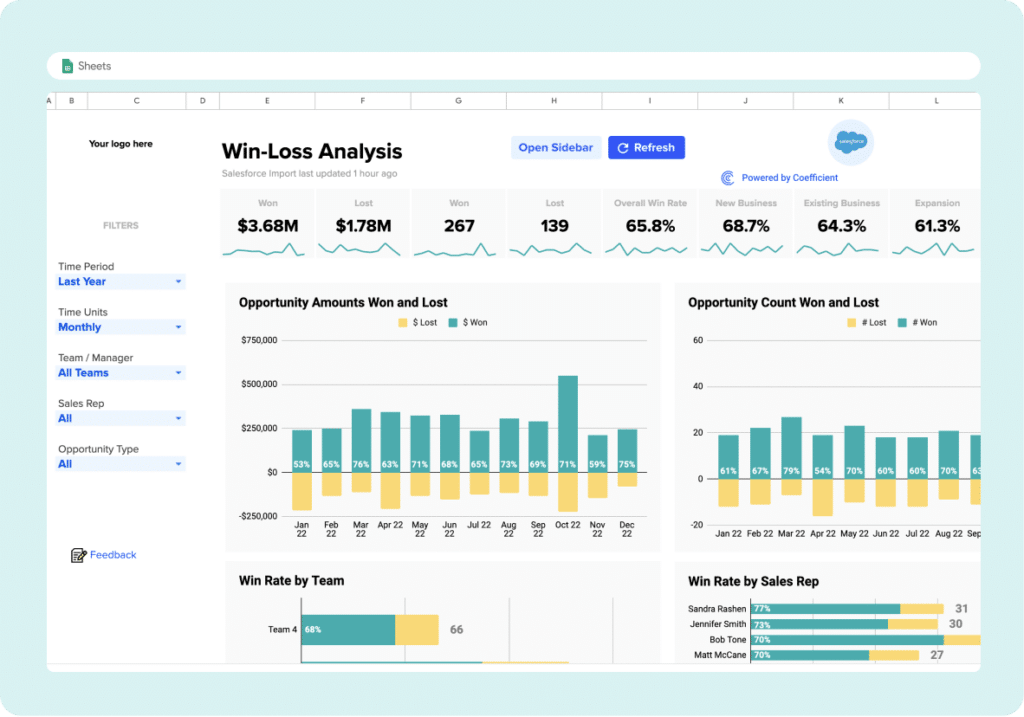
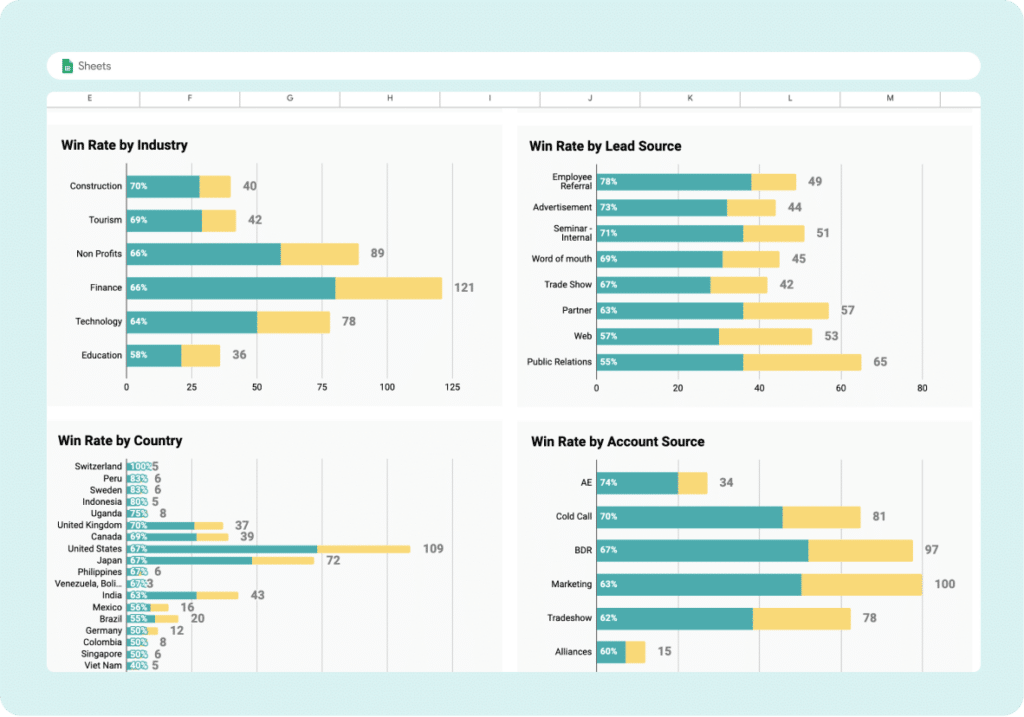
In this free, pre-built Salesforce Win Loss Analysis template, you can track win conversion rates by team, individual, industry, region, deal size, and more, within Google Sheets or Excel. In just a few clicks, you can powered this template with your live data.
Quickly boost revenue growth by reinvesting in successful strategies and swiftly eliminating ineffective ones.
- Monitor fluctuations in company, team, and individual win rates over time.
- Detect performance patterns early to capitalize on successes or refine your sales approach in areas with lower win rates.
- Compile a comprehensive list of recently lost opportunities along with insights into their failures.
- Receive real-time alerts via Slack or email whenever a new deal is lost.
Identify Sales Trends with Opportunity Tracking
Keep Track of All Your Win Rates
Now, let’s dive into the process of calculating win rates directly within Salesforce.
Calculate Win Rate in Salesforce: Step-by-Step Guide
Step 1: Accessing the Report Tab
First things first, log into your Salesforce account and navigate to the Report tab on the Salesforce dashboard.
For this guide, we’re starting with the opportunity report type, essential for win rate analysis.
Step 2: Selecting the Correct Fields
Upon creating a new report, you’ll encounter various fields.
Your goal here is to select the fields relevant to your win rate analysis: Opportunity Owner, Opportunity Name, Stage, Amount, Won, and Closed. Ensure you remove fields that aren’t necessary to declutter your report.
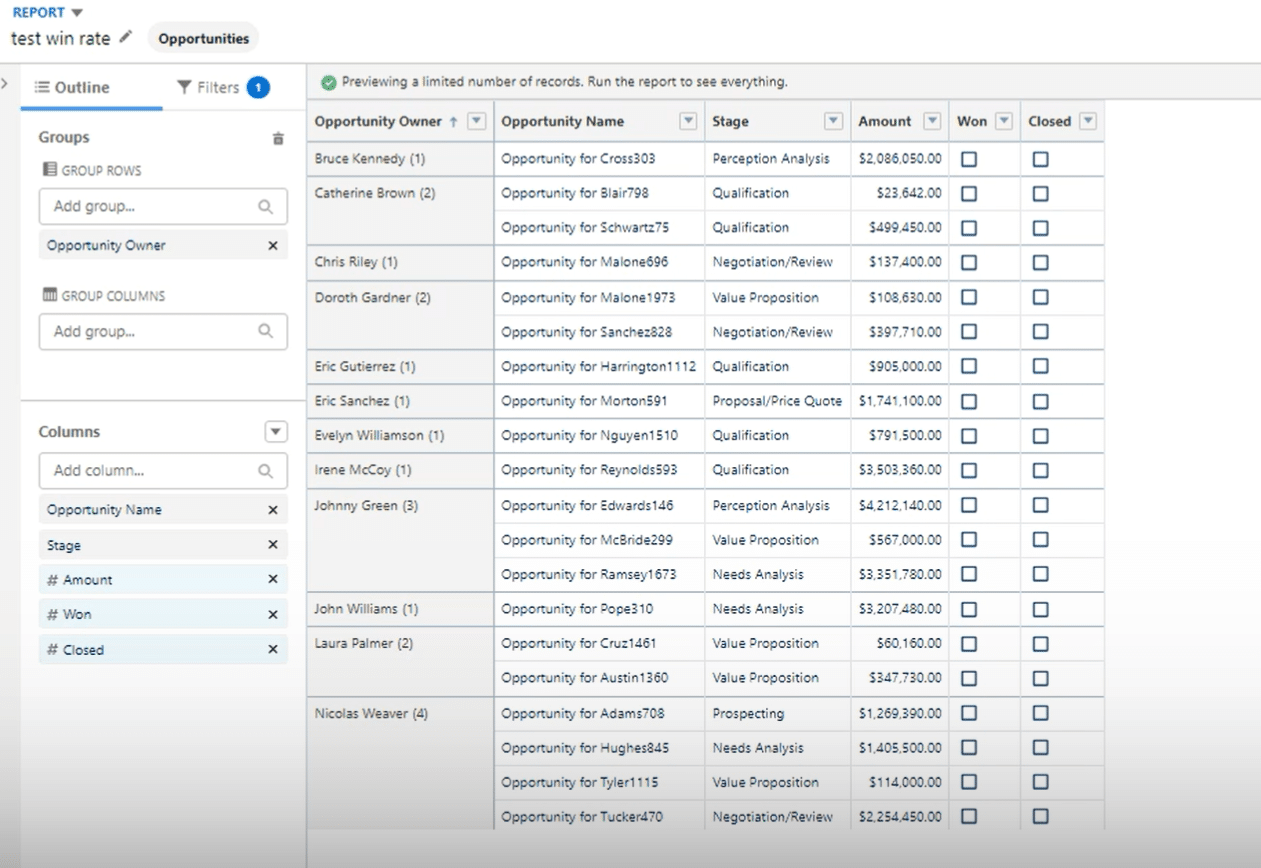
Step 3: Grouping and Report Configuration

Explore 8 cutting-edge techniques that are revolutionizing how Salesforce admins manage their daily tasks. Contribute more significantly to business outcomes and become a key driver of efficiency and innovation.
See the Techniques
Group your report by Opportunity Owner to analyze the win rate by each sales rep.
It’s also crucial at this stage to toggle off grand totals and subtotals while keeping essential toggles on for a clean output.
Step 4. Adding a Summary Formula for Win Rate
Navigate to add a summary formula and name it “Win rate by rep percentage.”
Choose an output of percent for ease of understanding.
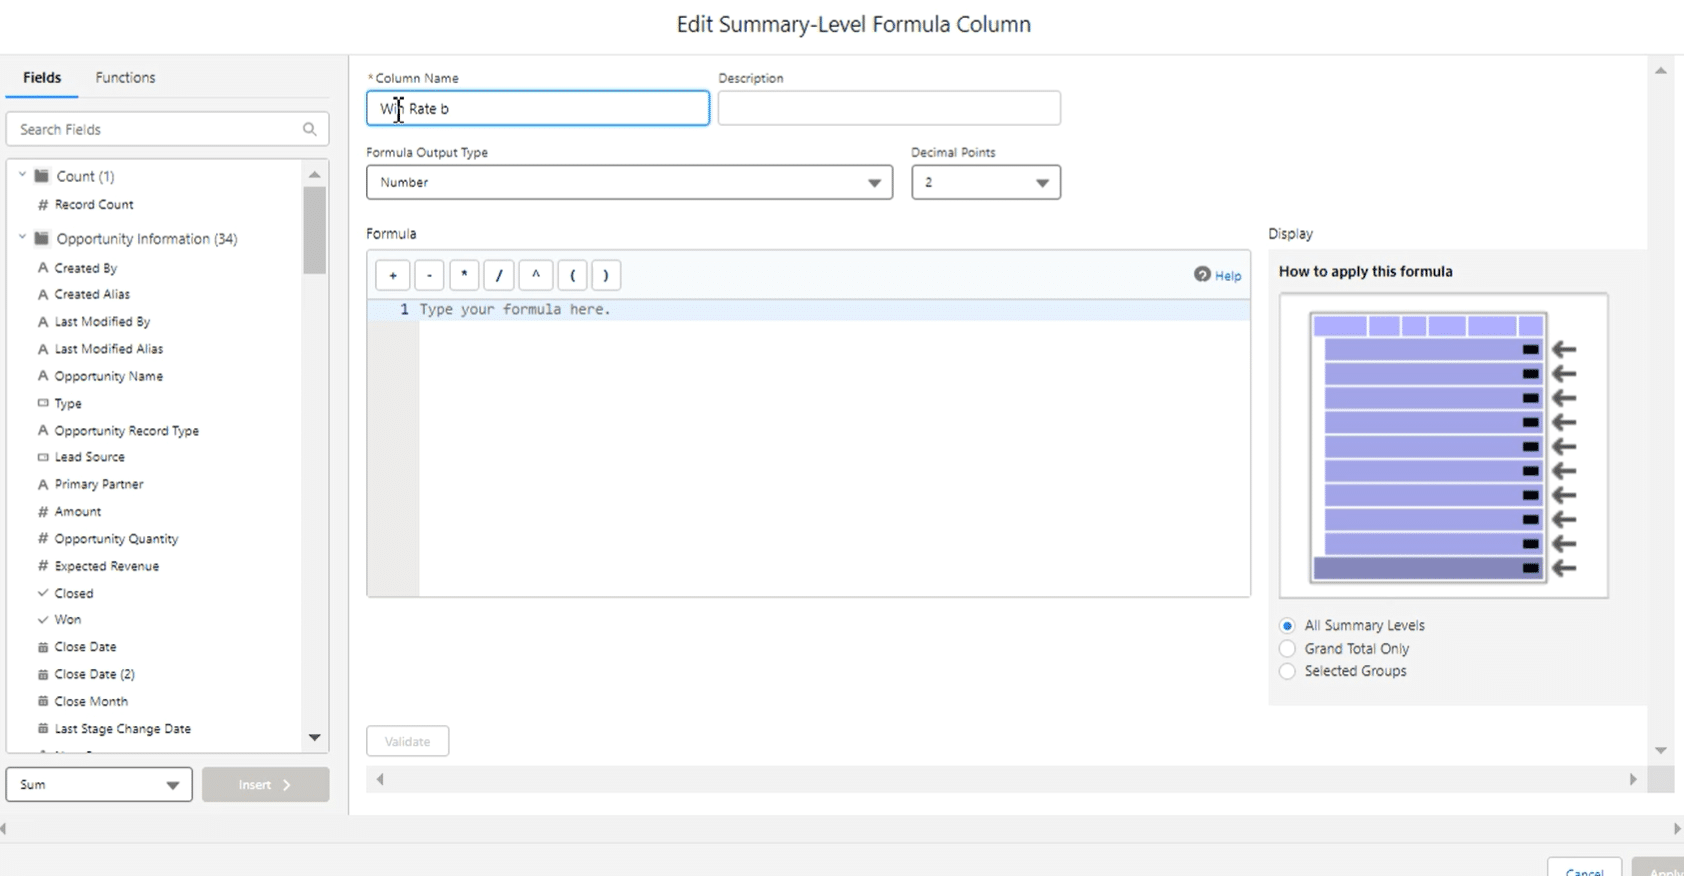
The formula is straightforward: the number of won opportunities divided by the total opportunities for each sales rep. Remember to insert the Won and Closed fields as specified in the transcript.
This formula should be applied to all summary levels to ensure comprehensive analysis across all rows.
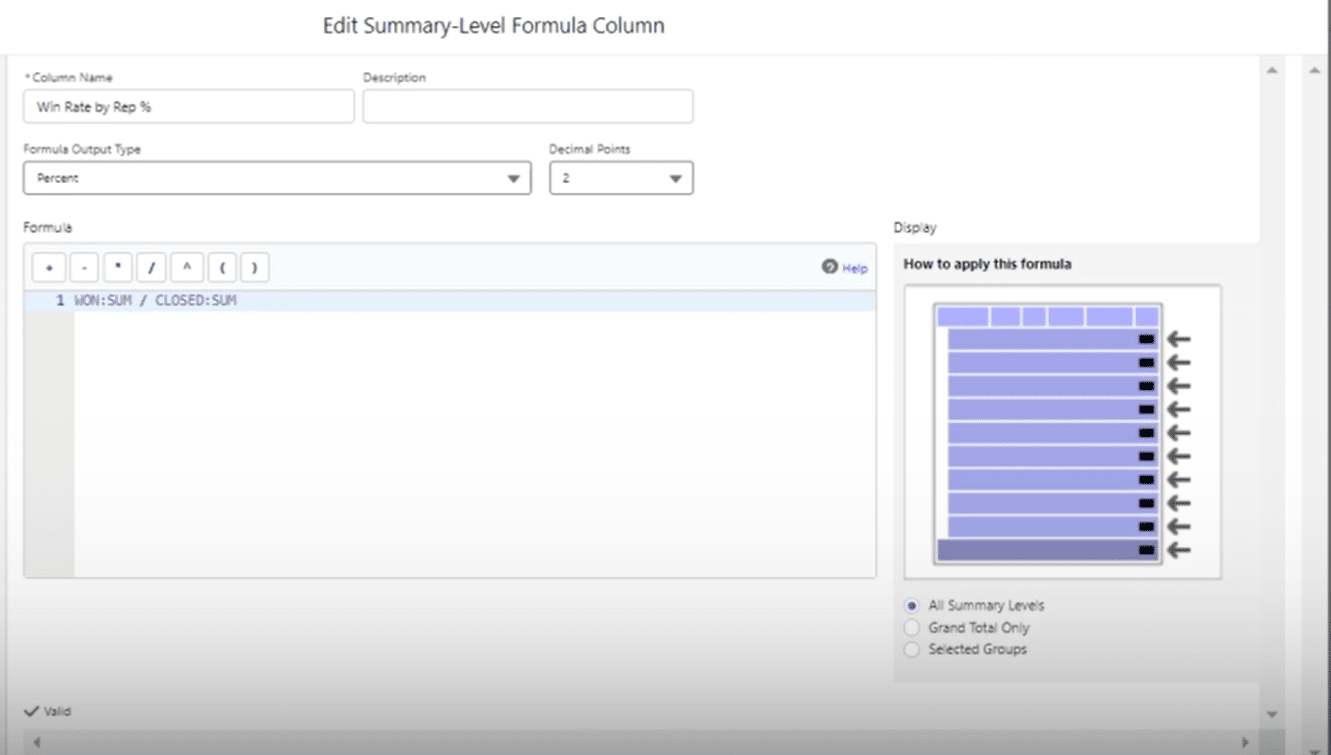
Step 5: Adjusting the Close Date Filter
Adjusting the close date filter is a step often overlooked.
Ensure you filter for closed opportunities—not just closed-won—to obtain an accurate calculation of the win rate. Tailor this filter to fit your company’s specific needs.
Step 6: Saving, Running, and Final Adjustments
After validating your formula, save and run your report. An additional but vital step is to delve into detail rows and specifically type in the win rate. This ensures your report is detailed and informative.
Master Your Sales Win Rate with Speedy Salesforce Insights
Learning how to track and analyze win rates on your Salesforce data is an essential skill for boosting your sales performance. By following the steps outlined in this guide or using our free, pre-built template, you’re now equipped to use Salesforce more effectively for your sales analytics needs.
For even more advanced analytics and integration solutions, visit https://coefficient.io/get-started to discover how Coefficient can enhance your Salesforce experience.


