


Table of Contents
![]()
- 1. 10 Best CRM Reporting Tools for 2026
- 2. Sales Velocity Tracking: How to Calculate and Track Overtime in Google Sheets
- 3. Average Deal Size: How to Measure + Optimize Forecasting (With Template)
- 4. How You Can Measure and Optimize Pipeline Velocity
- 5. How You Can Measure and Optimize Win Rate Today (2024 Guide)
- 6. Quota Attainment: How to Measure in 2026 (With Template)
- 7. Top 10 Sales Metrics to Track in 2025
- 8. How to Analyze Sales Rep Performance in Google Sheets
-
9. 5 Sales Revenue Metrics to Measure Success in 2024 (With Templates)
- Top 5 Sales Revenue Metrics for 2024
- 1. Sales vs Targets
- 2. Opportunity History
- 3. Lead Velocity
- 4. Win-Loss Analysis
- 5. Monthly Recurring Revenue (MRR) Growth Rate
- Advantages of Integrating Live Data From Various Systems into a Single Dashboard
- How Jebbit Streamlined Sales and Revenue
- Operations with Coefficient
- Start Tracking the Sales Revenue Metrics That Matter


Measuring the right metrics provides a clear view of your sales pipeline, identifies areas needing improvement, and helps forecast future performance.
According to a McKinsey study, companies that leverage sales analytics achieve sales growth rates 5-10% higher than those that don’t, highlighting the importance of data-driven decision-making in modern sales strategies.
In this post, we’ll share the 8 most critical sales revenue metrics to track, along with templates to help you get started.
Top 5 Sales Revenue Metrics for 2024
1. Sales vs Targets
Monitoring sales performance against predetermined targets is critical for ensuring that your team is on track to meet its goals. Regularly reviewing sales vs targets data can help you make proactive decisions to keep your team on track and achieve your goals.
By tracking sales vs targets, you can:
- Identify performance gaps and take corrective action
- Adjust strategies based on real-time performance data
- Celebrate successes and recognize top performers
How to Calculate
Sales vs targets is calculated by dividing the actual sales by the target sales for a given period.
How Coefficient’s Sales vs Targets Template Can Help
Coefficient’s Sales vs Targets Template makes it easy for sales managers to monitor team performance in real-time by:
- Integrating live data from Salesforce, eliminating manual data entry
- Visualizing performance against targets, enabling quick identification of gaps
- Allowing you to set custom alerts for when teams or reps are falling behind or exceeding targets, ensuring timely action
Gain real-time visibility into your team’s performance with Coefficient’s Sales vs Targets template.

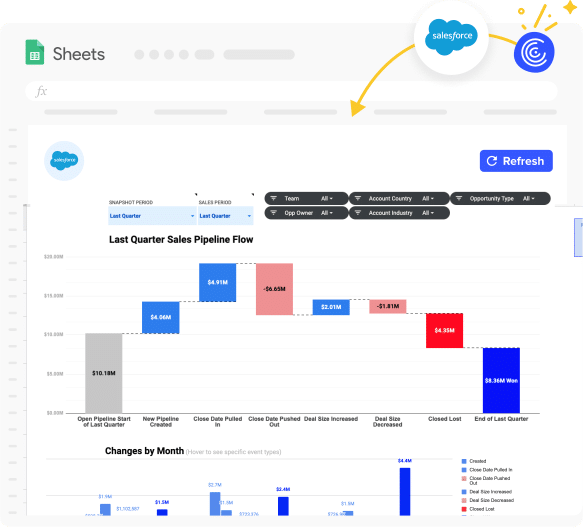
2. Opportunity History
Tracking the progression of opportunities through the sales funnel is essential for understanding the health of your pipeline. Analyzing opportunity history data can reveal valuable insights into the effectiveness of your sales processes and help you make improvements to drive better results.
By monitoring opportunity history, you can:
- Identify bottlenecks and take corrective action
- Forecast future sales performance more accurately
- Optimize your sales processes based on data-driven insights
How to Calculate
Opportunity history is measured by tracking the number of opportunities that move from one stage to another over a given period.
How Coefficient’s Opportunity History Template Can Help
Coefficient’s Opportunity History Template streamlines the process of monitoring this critical metric for sales operations teams by:
- Integrating live data from Salesforce, providing an always up-to-date view of the pipeline
- Visualizing the progression of opportunities through the funnel, highlighting key trends
- Identifying stages where opportunities are progressing smoothly or getting stuck, enabling targeted process improvements
Optimize your sales funnel with Coefficient’s Opportunity History template.
3. Lead Velocity
Lead velocity measures the growth of your qualified leads over time.
By tracking this metric, you can:
- Assess the effectiveness of your lead generation strategies
- Forecast future pipeline growth
- Identify trends in lead volume and quality
How to Calculate
Lead velocity is calculated by comparing the number of qualified leads generated in a given period to the number generated in the previous period.
How Coefficient’s Lead Velocity Template Can Help
Coefficient’s Lead Velocity Template makes it easy for marketing teams to track and analyze this key metric by:
- Providing a pre-built formula for calculating lead velocity, saving time and ensuring accuracy
- Allowing you to input lead data directly into the template, centralizing your data
- Visualizing lead velocity trends over time, enabling quick identification of issues or opportunities
Ensure a healthy pipeline with Coefficient’s Lead Velocity template.

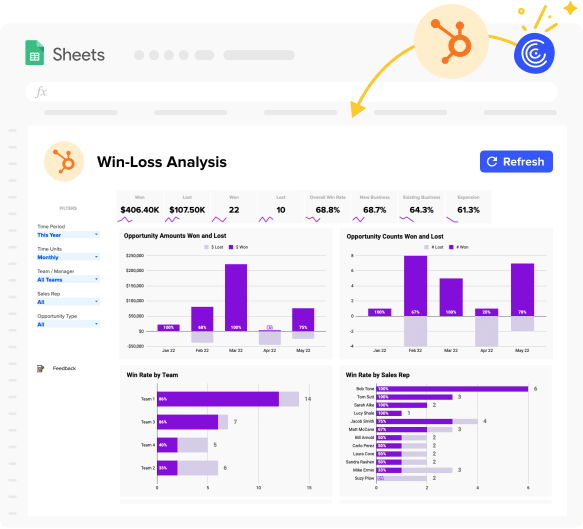
4. Win-Loss Analysis
Conducting win-loss analysis helps you understand the factors that influence your sales outcomes and identify areas for improvement. Regularly conducting win-loss analysis provides valuable insights that sales enablement teams can use to refine messaging, train reps, and improve overall sales effectiveness.
By tracking this metric, you can:
- Identify the strategies and tactics that lead to closed-won deals
- Address the factors contributing to lost opportunities
- Optimize your sales approach to increase win rates
How to Calculate
Win-loss analysis involves analyzing closed-won and closed-lost opportunities to identify the key factors that influenced each outcome.
How Coefficient’s Win-Loss Analysis Template Can Help
Coefficient’s Win-Loss Analysis Template simplifies the process of conducting this critical analysis for sales enablement teams by:
- Integrating live data from HubSpot, eliminating manual data gathering
- Categorizing won and lost deals based on key factors, revealing patterns and trends
- Visualizing win-loss trends over time, enabling identification of improvement areas
Gain actionable insights with Coefficient’s Win-Loss Analysis template.
5. Monthly Recurring Revenue (MRR) Growth Rate
MRR growth rate measures the month-over-month increase in recurring revenue. Monitoring MRR growth rate is crucial for finance teams to ensure the long-term viability and success of the business.
By tracking this metric, you can:
- Assess the health and growth of your subscription-based business
- Forecast future revenue growth
- Identify trends in customer acquisition and retention
How to Calculate
MRR growth rate is calculated by comparing the MRR at the end of the current month to the MRR at the end of the previous month.
How Coefficient’s MRR Growth Rate Template Can Help
Coefficient’s MRR Growth Rate Template streamlines the process of tracking and analyzing this key metric for finance teams by:
- Providing a pre-built formula for calculating MRR growth rate, ensuring accuracy
- Allowing you to input MRR data directly into the template, centralizing your financial data
- Visualizing MRR growth trends over time, enabling quick identification of issues or opportunities
Track the health of your recurring revenue with Coefficient’s MRR Growth Rate template.

Advantages of Integrating Live Data From Various Systems into a Single Dashboard
Integrating live data from various platforms into a single dashboard offers numerous advantages for sales teams:
- Centralized data: Consolidate data from multiple sources, providing a single source of truth for sales performance.
- Real-time insights: Access up-to-date information, enabling quick decision-making and agile strategizing.
- Time savings: Automate data collection and analysis, freeing up time for more strategic initiatives.
Coefficient’s pre-built dashboard templates make it easy to integrate live data from various systems, with customization options to suit your unique needs.
How Jebbit Streamlined Sales and Revenue
Operations with Coefficient
By adopting Coefficient, Jebbit streamlined their sales commission process, eliminating hours of manual work and providing their sales team with real-time insights and a comprehensive view of their commissions. Coefficient’s support for historical Salesforce data also enabled Jebbit to craft more accurate sales forecasts and respond promptly to leadership requests.
“Coefficient saved us hours upon hours of work,” said Rachel Golden, VP of Finance at Jebbit. “There’s no manual back-and-forth with salespeople about commissions anymore. But we haven’t just saved tons of time. We’ve also been able to offer our team better data and more transparency.”
Read the full story to see how Jebbit used Coefficient to streamline their sales operations.
Start Tracking the Sales Revenue Metrics That Matter
In 2024, the most successful sales teams will be those that closely track their key revenue metrics.
By focusing on the 8 metrics we’ve covered and using Coefficient’s templates, you can gain the insights you need to make smart decisions and grow your business. Coefficient’s templates make it easy to track your most important sales metrics, with live data from your existing tools and customization options to fit your unique needs.
Ready to take your sales revenue tracking to the next level? Start using Coefficient for free today.
