


Table of Contents
![]()
- 1. 10 Best CRM Reporting Tools for 2026
- 2. Sales Velocity Tracking: How to Calculate and Track Overtime in Google Sheets
- 3. Average Deal Size: How to Measure + Optimize Forecasting (With Template)
- 4. How You Can Measure and Optimize Pipeline Velocity
- 5. How You Can Measure and Optimize Win Rate Today (2024 Guide)
- 6. Quota Attainment: How to Measure in 2026 (With Template)
- 7. Top 10 Sales Metrics to Track in 2025
- 8. How to Analyze Sales Rep Performance in Google Sheets
- 9. 5 Sales Revenue Metrics to Measure Success in 2024 (With Templates)


Achieving and surpassing sales quotas is critical, but understanding and optimizing quota attainment can be complex. Sales operations and leadership teams often struggle with manual data consolidation and the need for real-time insights to drive strategies.
Coefficient’s Quota Attainment Dashboard streamlines the process of calculating this vital metric, giving you actionable insights to excel in your sales operations.
Understanding Quota Attainment
Quota attainment measures the percentage of sales quota achieved by a salesperson or team over a specific period. It provides insight into individual and team performance, highlighting who is overperforming or underperforming against their sales objectives.
High quota attainment rates indicate effective sales strategies and execution, while lower rates may signal misaligned quotas, market challenges, or areas where additional support is needed.
Why Quota Attainment Matters:
- Aligns performance and compensation, fostering accountability and motivation
- Guides strategic decisions on resource allocation, territories, and forecasting
- Reveals patterns and bottlenecks, helping streamline sales operations
Factors Affecting Quota Attainment:
- Industry dynamics and varying sales cycles
- Effectiveness of sales strategies (inbound, outbound, account-based)
- Market conditions (economic trends, competition, demand shifts)
- Organizational changes (restructuring, product launches, strategic shifts)
How to Calculate Quota Attainment
To calculate quota attainment, use this easy formula:
Quota attainment: (Actual Sales / Sales Quota) x 100
- Actual Sales: The revenue a sales representative or team generates in a given period.
- Quota: The target revenue set for that representative or team in the same period.
Using Coefficient to Calculate Quota Attainment
Coefficient’s Sales Opportunity Dashboard for Google Sheets makes it easy to track and analyze your team’s quota attainment.
Here’s a quick tutorial on how to use it:
Step 1: Download the (Free) Quota Attainment Dashboard
To start, head to Coefficient.io.
Enter your work email in the box and click ‘Get Free Template.’
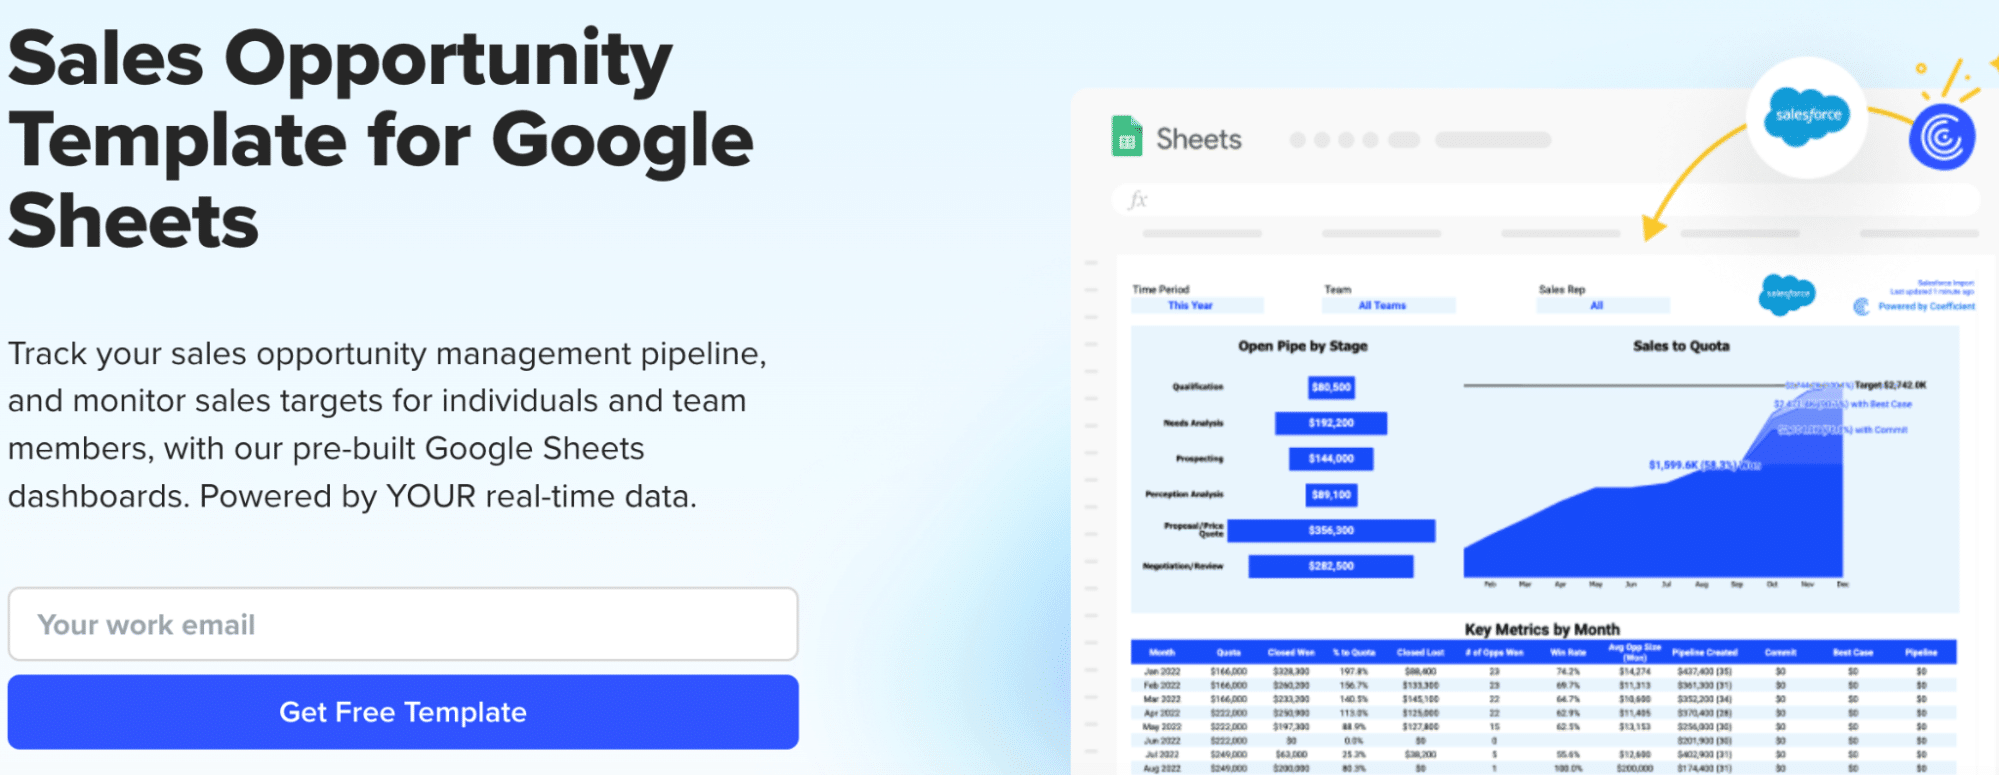
You can save the template to your Google account by clicking the ‘Use Template’ button at the top right corner of your screen.
Coefficient will open in a new spreadsheet.
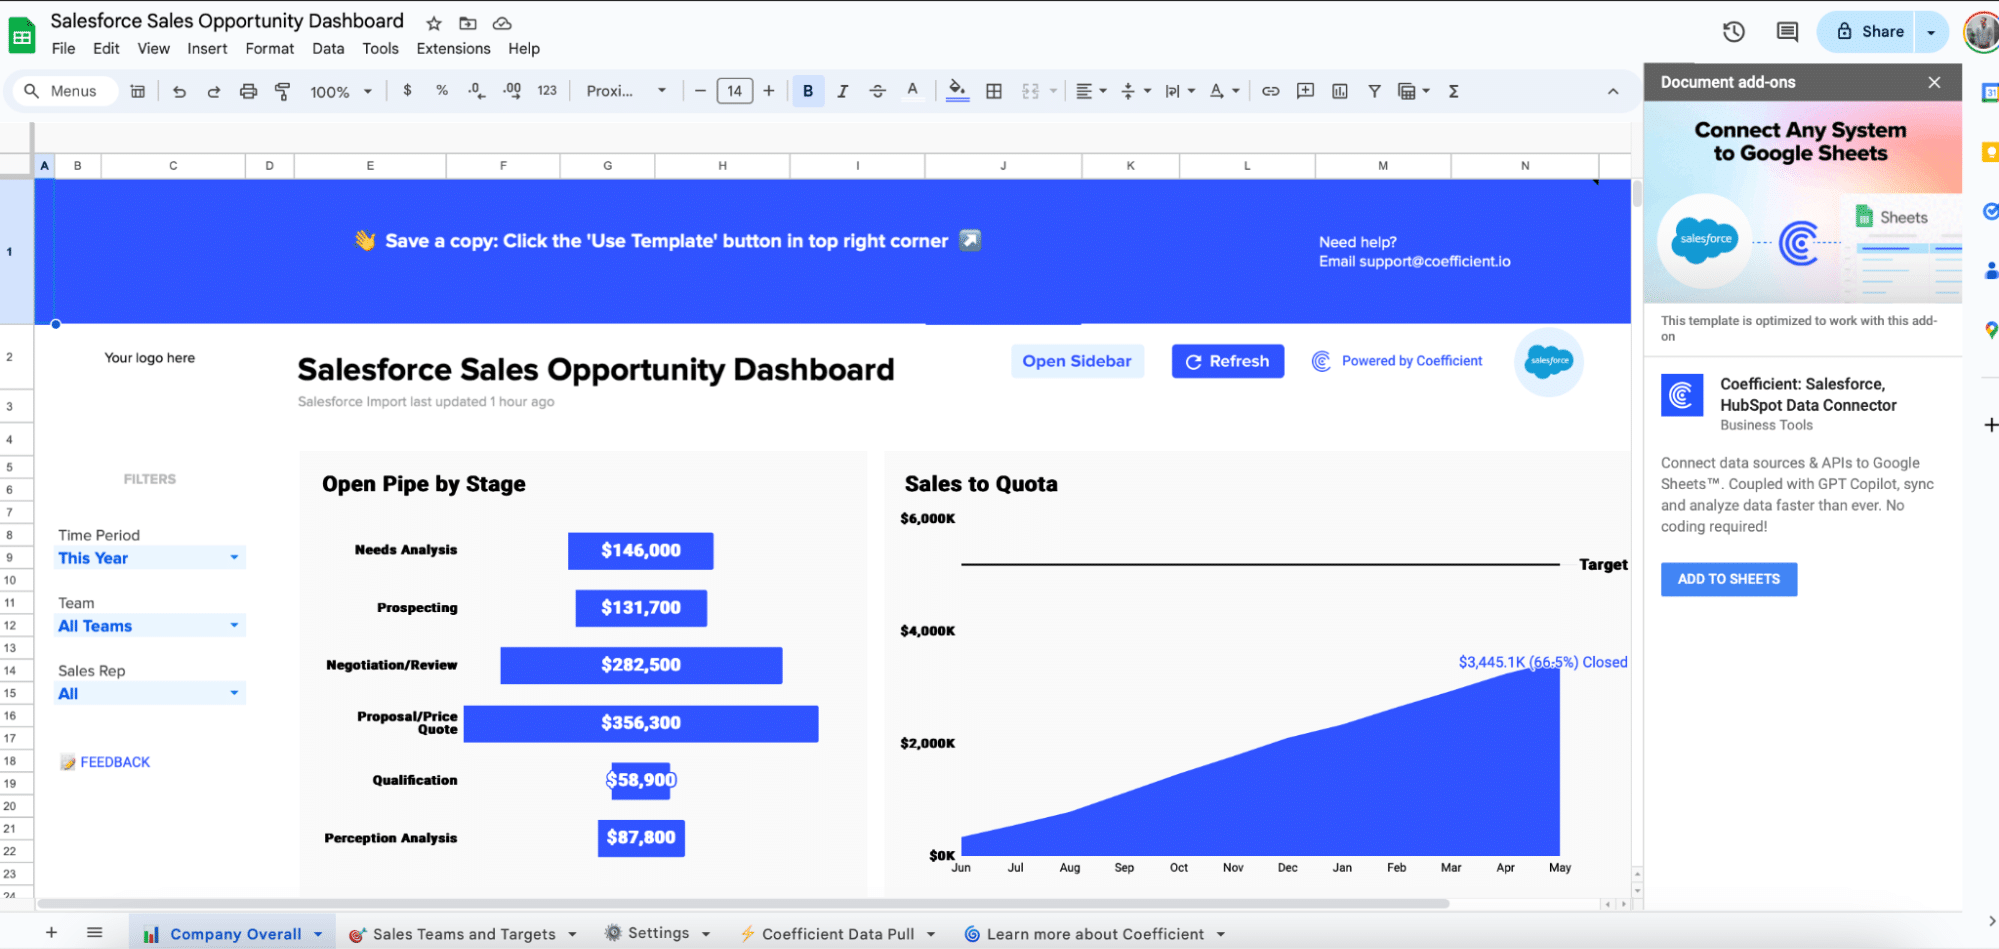
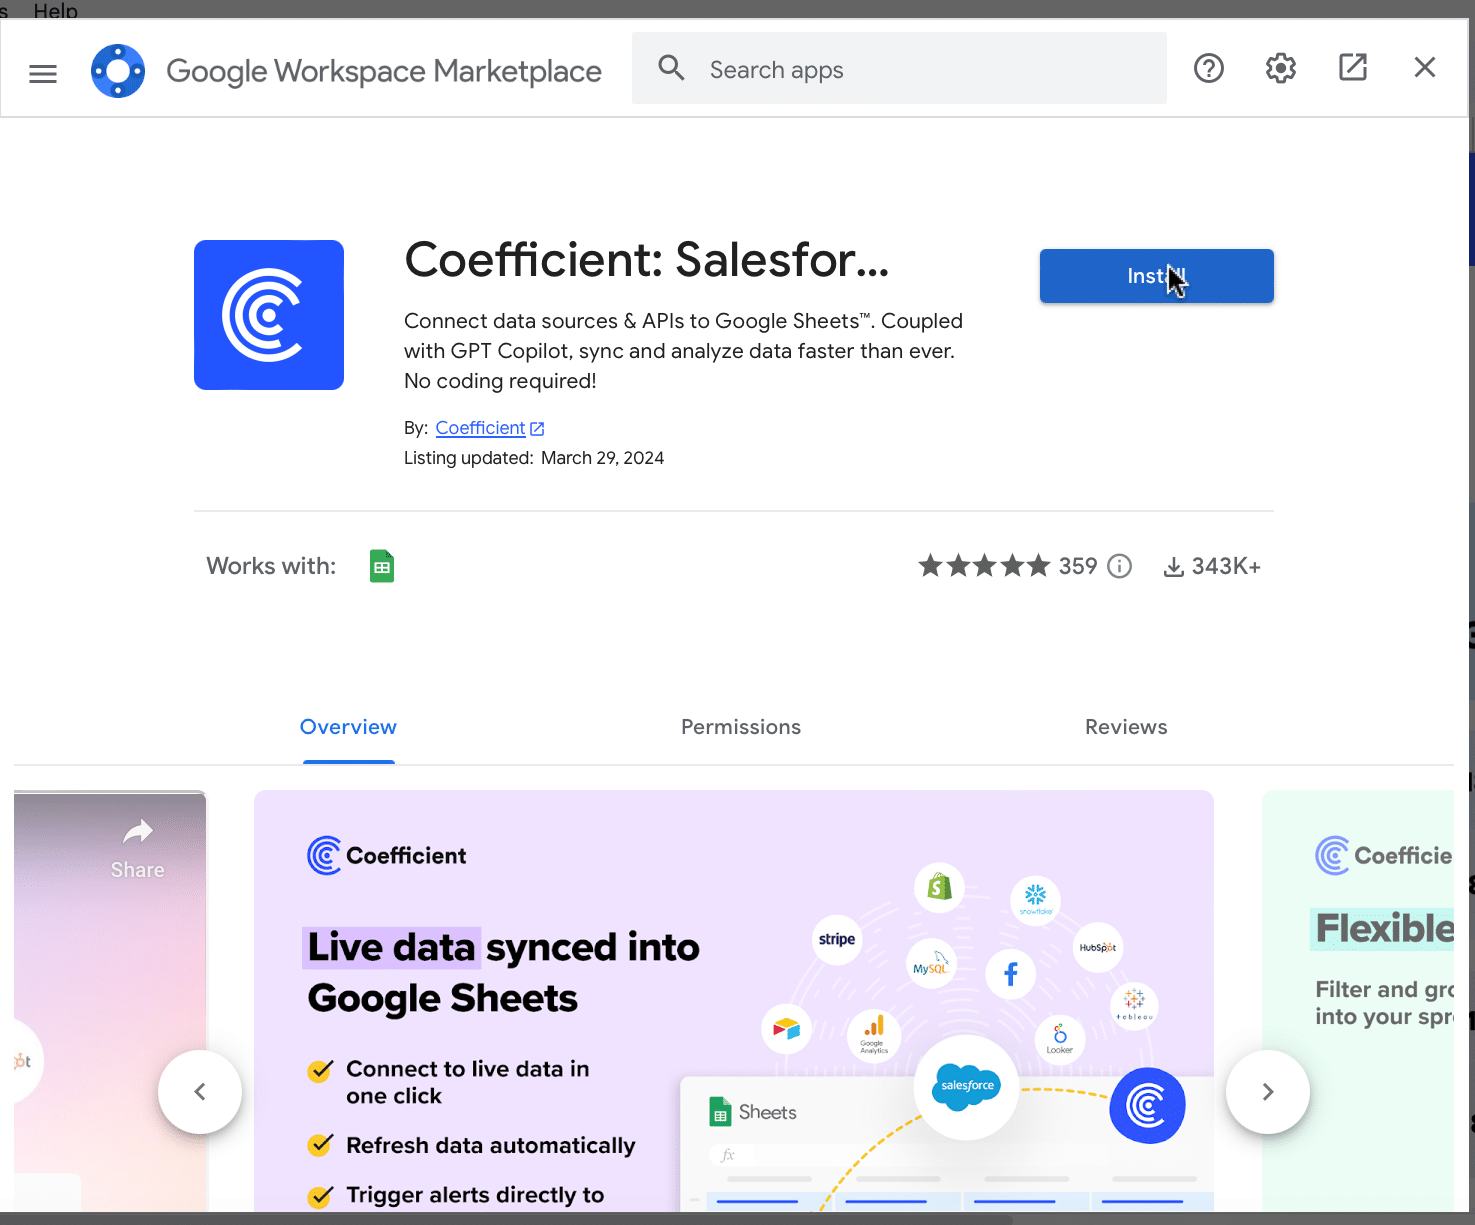
If this is your first time using Coefficient, you’ll need to add it as an add-on to Google Sheets. Click ‘Add to Sheets’ to continue.
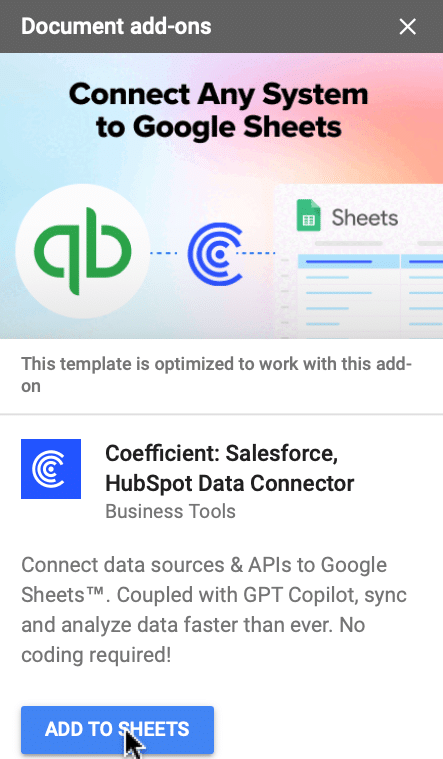
Hit the ‘Install’ button and follow the prompts to complete the installation.
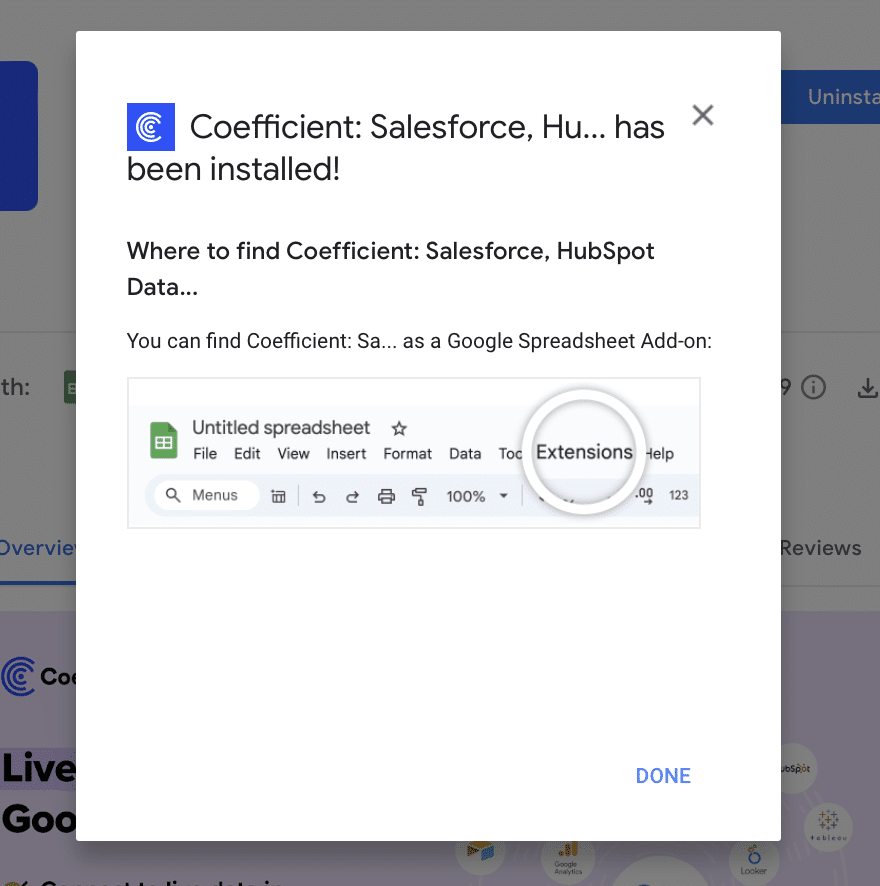
Step 2: Connect Coefficient to Salesforce
After installation is complete, click ‘Done’ to return to your spreadsheet.
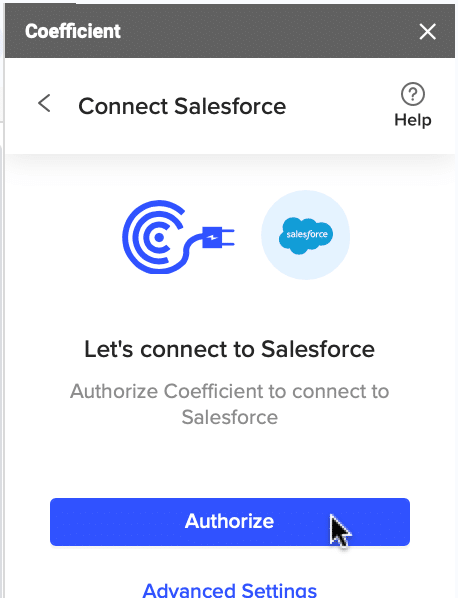
Click ‘Connect to Salesforce’ from the Coefficient menu on the right-hand side of your spreadsheet.
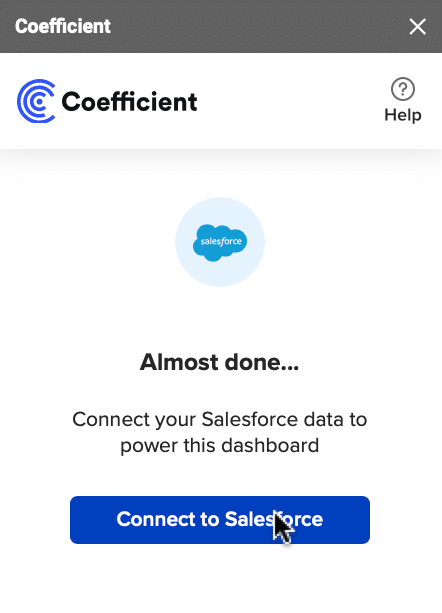
Follow the prompts to authorize Coefficient to yoru Salesforce account.
If successful, you’ll see the following notification at the top of your spreadsheet.

To update your data, navigate to the ‘Salesforce Import’ tab of your spreadsheet and click ‘Refresh.’
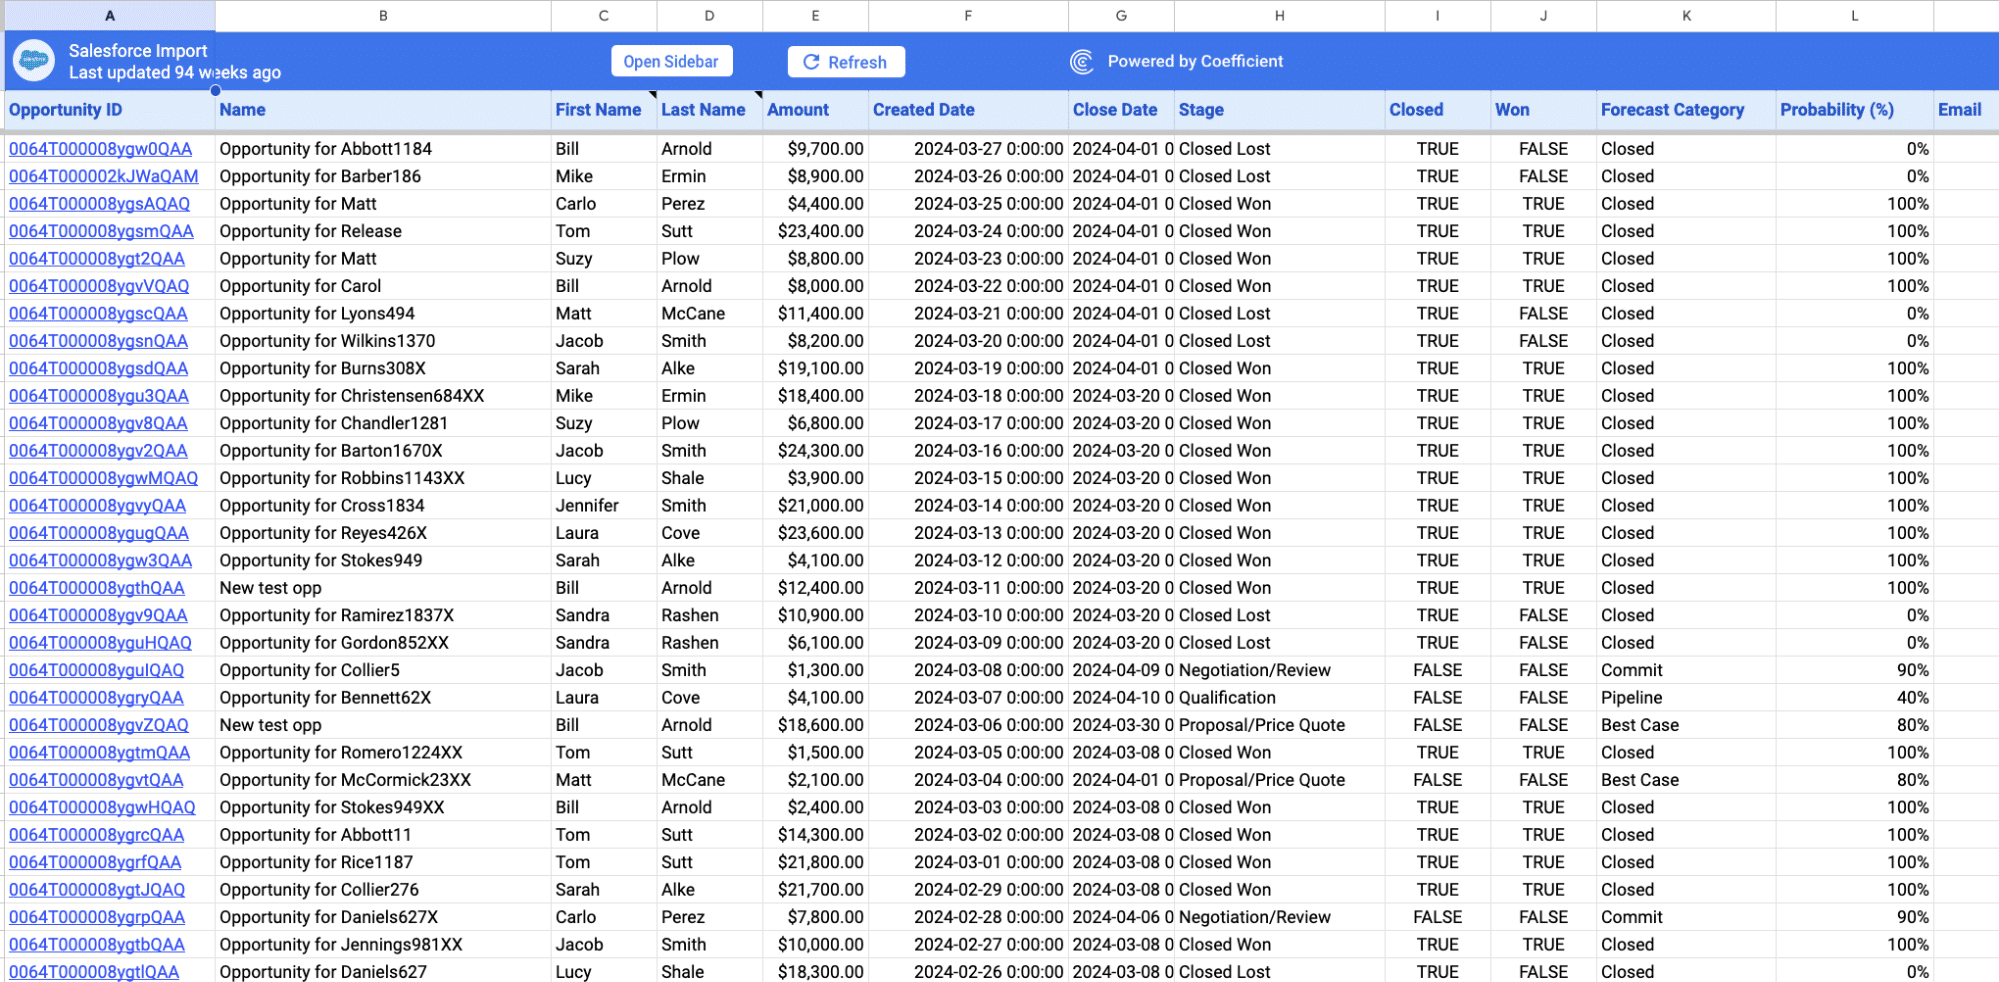
You can also auto-refresh your data by clicking ‘Set Refresh Schedule.’

Set up an hourly, daily, or weekly auto-refresh schedule, and Coefficient will automatically update your data based on that time interval.
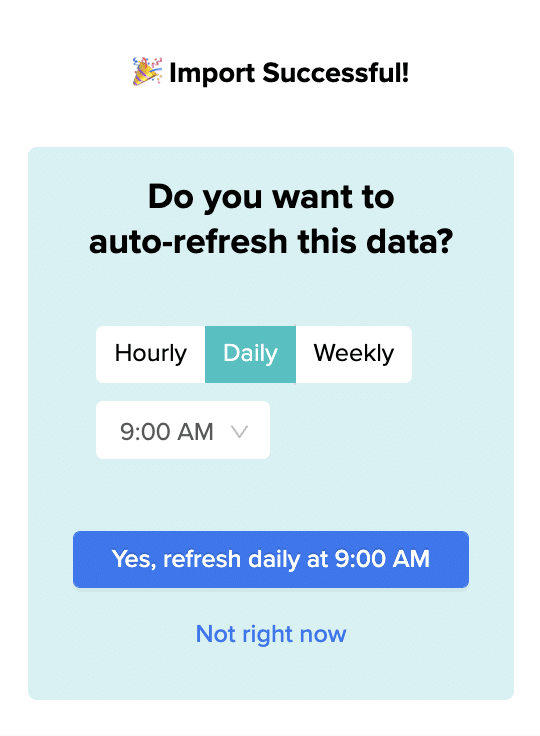
That means, going forward, Coefficient will automate your Salesforce data exports to Google Sheets for you.
Step 3. Customize Your Dashboard
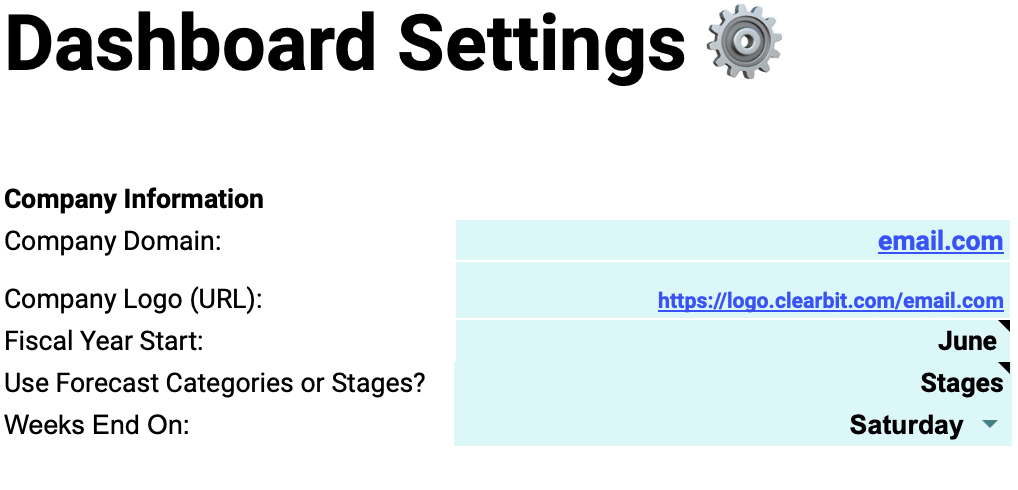
Tailor the template to your organization’s unique needs by navigating to the ‘Settings’ tab.
You can customize by:
Company Information: Add your domain URL, logo, and fiscal year start date.
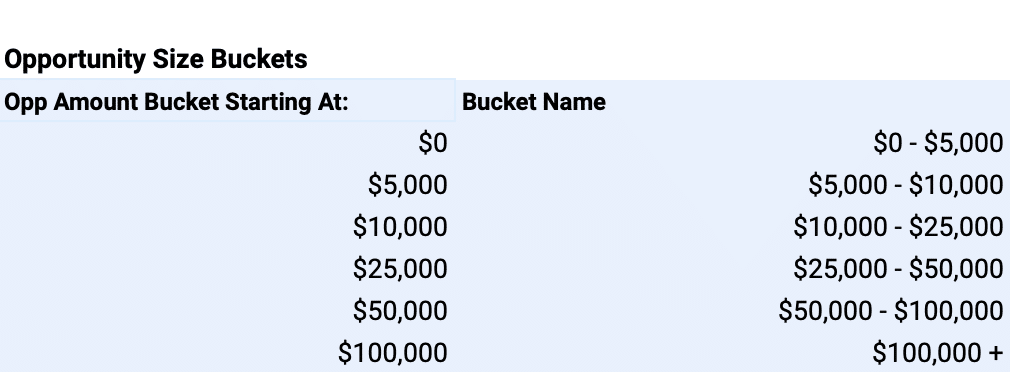
Opportunity Size Buckets: Define the deal size ranges for analysis.
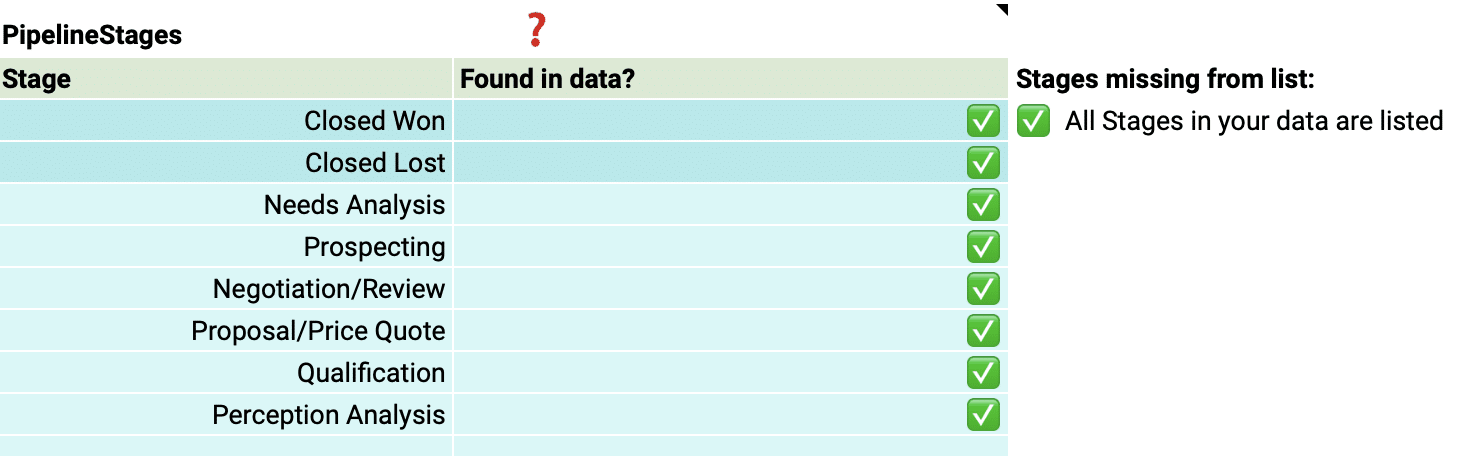
Pipeline Stages: Match the stages to your HubSpot sales pipeline.
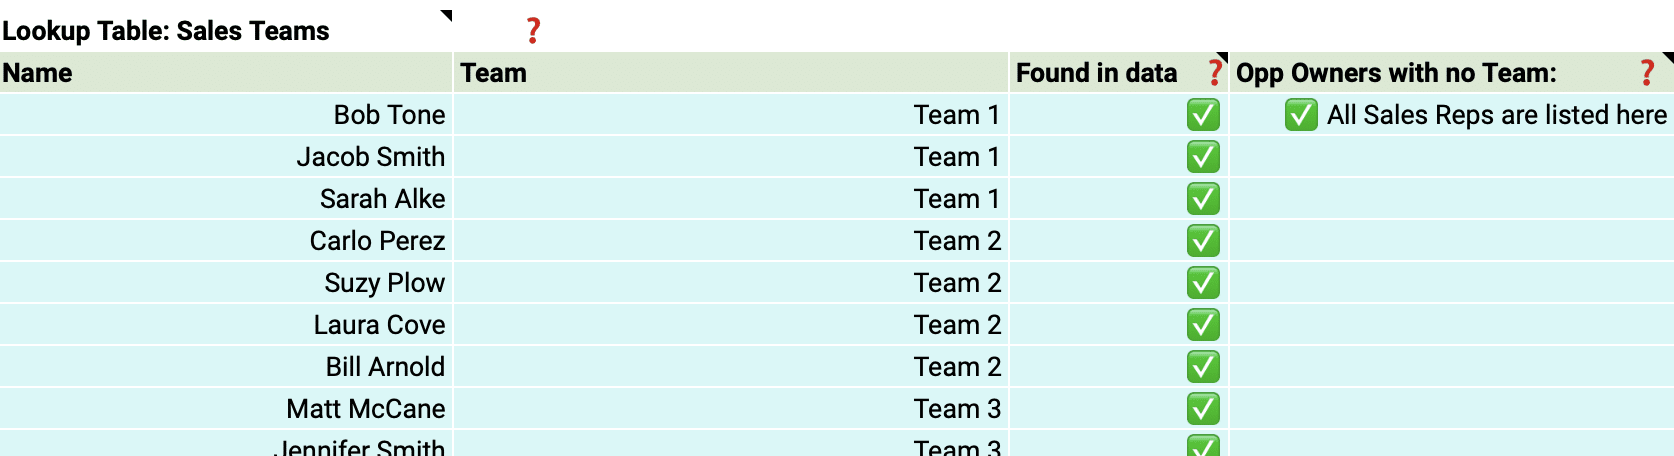
Team Members: Include details about your sales team for personalized insights.
With just a few simple customizations, you can transform the Sales Opportunity Dashboard into a powerful tool tailored to your organization’s specific needs.
Deep Dive into the Quota Attainment Template
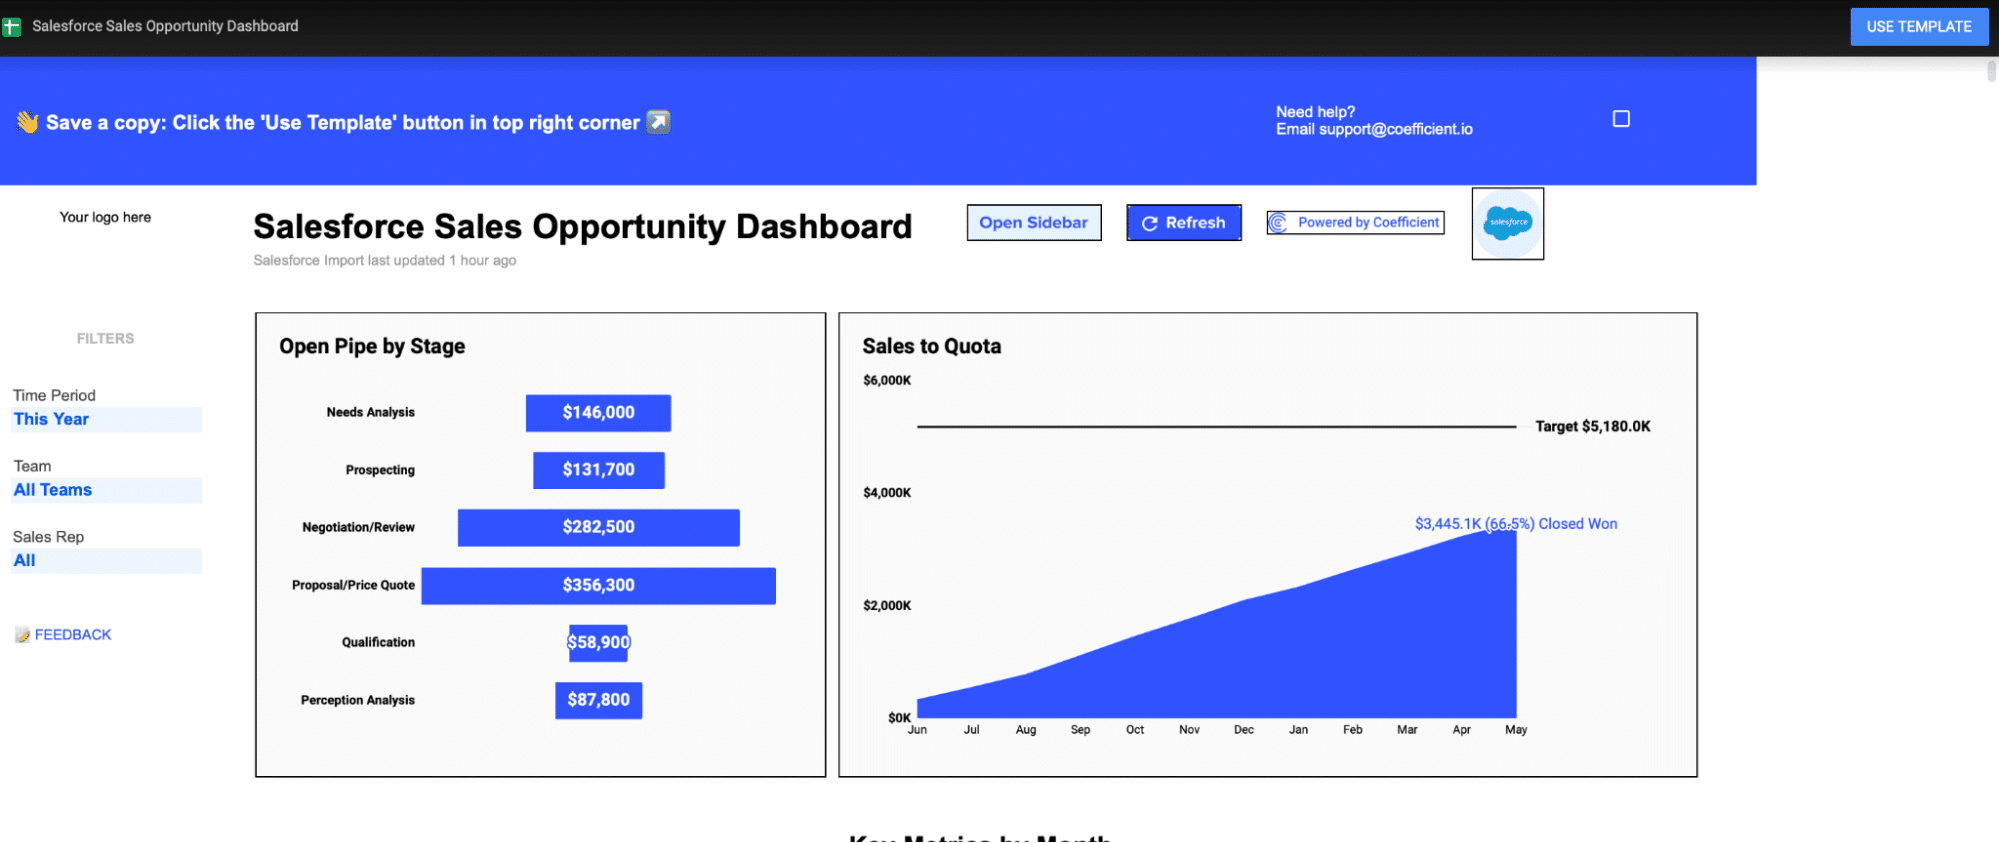
The Sales Opportunity Dashboard provides a comprehensive view of your quota attainment and so much more.
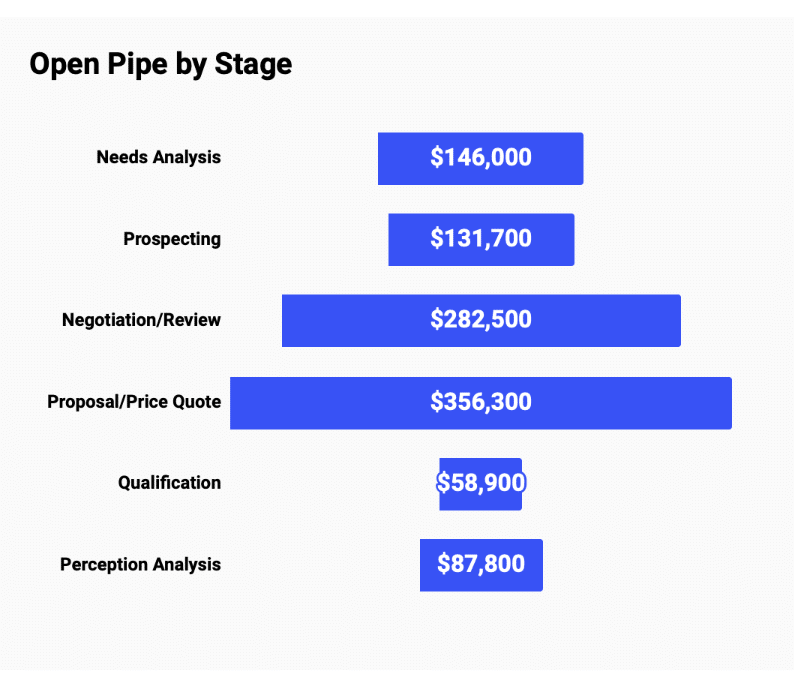
The Open Pipe by Stage chart breaks down the value of your open pipeline by each stage of your sales process. This allows you to quickly identify where the majority of your pipeline value lies and which stages may require more attention or resources to move deals forward.
The Sales to Quota graph shows your actual sales performance against your quota over time. This visualization helps you track your progress towards hitting your sales targets, identify trends, and make data-driven decisions to optimize your sales strategies.
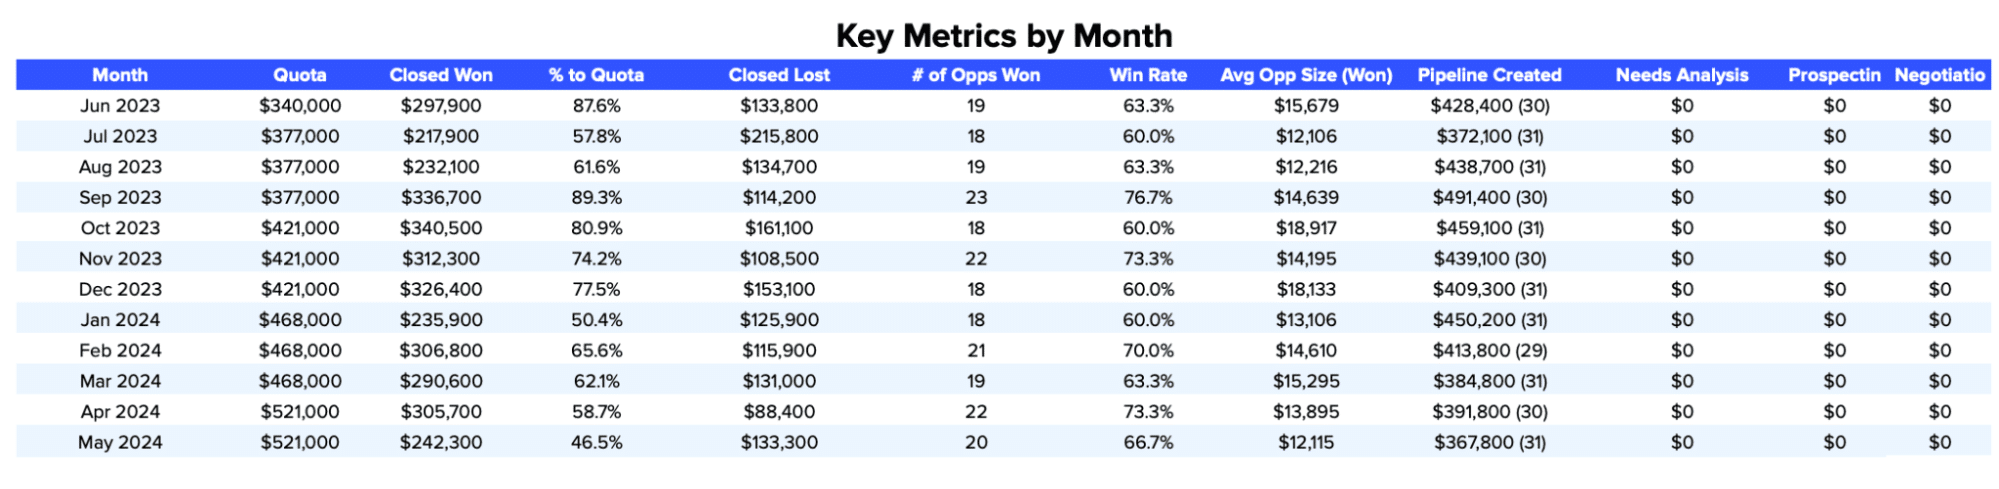
The Key Metrics by Month table provides a detailed overview of your key sales metrics, such as quota, closed won, percentage to quota, and pipeline created, on a monthly basis. This granular data allows you to analyze your performance over time, spot trends, and identify areas for improvement.
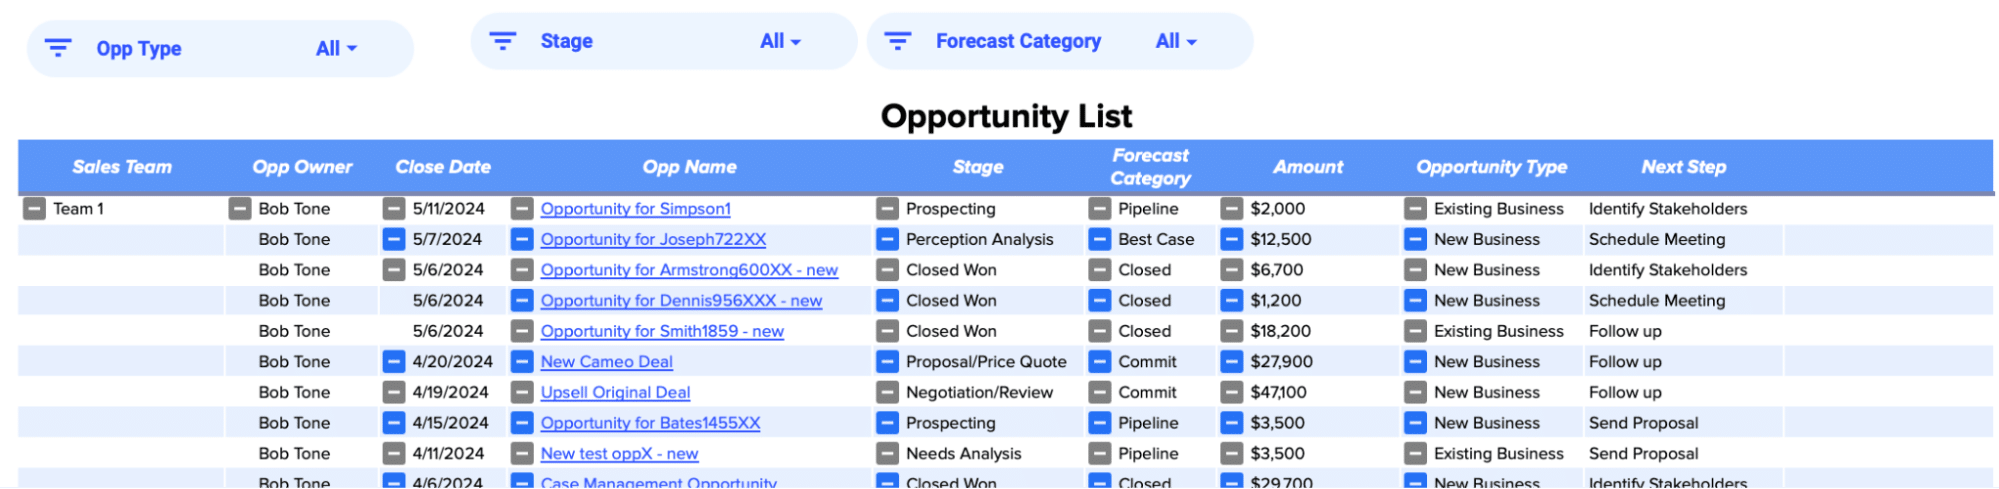
The Opportunity List table gives you a comprehensive view of all your opportunities, including key details such as stage, amount, close date, and next steps. This table enables you to dive into the specifics of each deal, prioritize your efforts, and ensure nothing falls through the cracks.
Actionable Insights from Quota Attainment Analysis
Quota attainment data empowers you to make strategic decisions and optimize your sales performance:
- Identify top performers: Recognize and learn from the strategies of reps consistently exceeding their quotas, and share their best practices with the team.
- Provide targeted coaching: Offer personalized support and training to reps struggling to meet their quotas, addressing specific areas for improvement.
- Align territories and quotas: Ensure that quotas are fair and achievable by analyzing historical performance data and making adjustments as needed.
The Power of Live Data
Coefficient’s dashboard templates leverage real-time data, enabling you to:
- Quickly spot and respond to changes in quota attainment trends
- Make decisions based on the most current information
- Tailor your analysis to your specific priorities and needs
- Easily collaborate and share insights across your organization
Elevate Your Sales Performance
Mastering your quota attainment is essential for driving sales growth and improving overall performance.
Coefficient’s Quota Attainment Dashboard arms you with the tools and insights needed to make data-driven decisions and optimize your sales strategies.
Don’t wait – download the free uota Attainment Dashboard Template or sign up for Coefficient today and start boosting your sales performance!
Chart Your Path to Quota Attainment Mastery
Embark on a journey towards strategic excellence in sales operations with the Quota Attainment Dashboard Template or sign up for Coefficient today .
