You are not really choosing between two tools. You are choosing between two ecosystems: Microsoft and Salesforce. That decision has probably already been made by your tech stack. Most teams that compare Power BI and Tableau already know which one fits their infrastructure. What they need is the cost math, the 2026 AI feature gap and a clear answer on which to pick when the decision is genuinely open.
This guide gives you all three. No feature tick-box tables. No vague ‘it depends.’ Just what each platform actually costs at scale, what changed in 2025 and 2026, and which team should pick which tool.
| Quick verdict: Power BI wins on cost for most organisations. At 100 users, Power BI runs approximately $24,000/year vs Tableau at $50,000/year. If your organisation runs on Microsoft 365, Power BI is the obvious choice. Tableau is still the benchmark for visualisation quality and exploratory analytics, but the cost premium is hard to justify unless your team genuinely needs what Tableau does that Power BI cannot. |
Who Owns What (and Why It Matters in 2026)
Microsoft owns Power BI. In 2026 Power BI is no longer a standalone product. It sits inside Microsoft Fabric, Microsoft’s unified data and analytics platform. If your organisation is moving toward Azure, Fabric or Microsoft 365 consolidation, Power BI becomes part of a broader platform investment rather than a separate licence decision.
Salesforce owns Tableau, following its $15.7 billion acquisition in 2019. Tableau has maintained platform independence. It connects to non-Salesforce data sources and deploys across cloud environments. But Salesforce integration is now a core advantage: CRM data flows into Tableau dashboards without ETL, and Tableau Pulse delivers AI-powered metric summaries directly into Salesforce workflows.
This ownership context matters because your choice is partly a bet on a platform roadmap. Microsoft is consolidating everything into Fabric. Salesforce is deepening the CRM-to-analytics connection. If you are committed to neither ecosystem, you have genuine optionality. If you are already in one, the switching cost is real.
Power BI vs Tableau: What It Actually Costs
Pricing is where the comparison is clearest. Power BI is considerably cheaper at every scale, and the gap widens as you add viewer-only users.
| Licence Type | Power BI | Tableau | Notes |
|---|---|---|---|
| Creator / Author | $14/user/month (Pro) | $75/user/month (Creator) | Full authoring and publishing access |
| Explorer / Analyst | $24/user/month (PPU) | $42/user/month (Explorer) | Analysis without full authoring |
| Viewer / Consumer | Included in Pro | $15/user/month (Viewer) | Read-only dashboard access |
| AI features | $30/user/month add-on (Copilot) | Included in Tableau+ cloud tier | Copilot vs Tableau Pulse |
| Enterprise / Capacity | Microsoft Fabric F64+ SKUs | Tableau Cloud Enterprise | Removes per-viewer cost at scale |
Real-world cost example for 100 users (20 creators, 80 viewers):
- Power BI Pro: 100 users x $14 = $1,400/month ($16,800/year)
- Power BI with Copilot: add $30 x 20 creators = $600/month ($7,200/year total add-on)
- Tableau: 20 creators x $75 + 80 viewers x $15 = $2,700/month ($32,400/year) (Tableau Cloud or Server is a separate cost on top)
At 200 users (20 creators, 180 viewers), the gap widens further. Power BI’s capacity model means viewer costs effectively disappear at Fabric scale, while Tableau’s per-viewer fee compounds linearly. For organisations with many more consumers than creators, Power BI’s cost advantage becomes decisive.
The 2026 AI Features: Copilot vs Tableau Pulse
AI capabilities are now the defining differentiator in both platforms. Both have moved well beyond natural language querying into proactive, workflow-integrated intelligence.
Microsoft Copilot in Power BI
Copilot is available as an add-on at $30/user/month for Power BI Pro users, and is included in Microsoft Fabric capacity SKUs. In 2026, Copilot can:
- Generate complete report pages from a plain-English prompt
- Write DAX formulas from a description of the calculation you need
- Summarise large datasets and surface narrative insights inside dashboards
- Provide semantic model assistance for explaining what a measure does and suggesting alternatives
Copilot’s depth depends heavily on your data model quality. A well-structured semantic model produces genuinely useful Copilot outputs. A messy, ungoverned model produces confusing ones. The Microsoft Fabric integration makes Copilot most powerful when Power BI sits inside a unified data platform rather than in isolation.
Tableau Pulse
Tableau Pulse is included in Tableau+, Salesforce’s cloud-only premium tier. Rather than building reports, Tableau Pulse focuses on continuous monitoring:
- Automatically detects trends, anomalies and performance changes in your key metrics
- Delivers contextual summaries directly into Slack, email or Salesforce workflows
- Provides personalised digests and each user gets the metric changes that matter to their role
- Flags when a metric deviates from its baseline without requiring someone to go check a dashboard
Tableau Pulse is genuinely different from Copilot. Copilot helps you build dashboards faster. Pulse replaces the need to check dashboards by pushing relevant changes to you. For organisations where the bottleneck is analysts building things vs business users being interrupted by noise, these are solving different problems.
Feature Comparison: Power BI vs Tableau in 2026
| Feature | Power BI | Tableau |
|---|---|---|
| Data visualisation | Strong: 30+ chart types, good customisation | Industry benchmark. Widest chart library, deepest customisation |
| Ease of use | High: familiar to Excel users, drag-and-drop | Medium: drag-and-drop interface but steeper learning curve |
| Data modelling | Power Query + DAX: powerful but requires learning | Tableau Prep + VizQL: strong but proprietary |
| AI features | Copilot ($30/user/month add-on) | Tableau Pulse (included in Tableau+) |
| Microsoft ecosystem | Native: Excel, Teams, SharePoint, Azure, Fabric | Available, not native |
| Salesforce / CRM data | Via connector (not native) | Native: direct CRM data flow |
| Mobile experience | Good | Excellent: mobile-first design |
| Embedded analytics | Power BI Embedded (Azure) | Tableau Embedded: strong for customer-facing analytics |
| On-premises deployment | Power BI Report Server | Tableau Server |
| Governance | Row-level security, workspace management | Row-level security, Tableau Catalog, Certified Sources |
| Pricing (creator) | $14/user/month Pro | $75/user/month Creator |
| Pricing (viewer) | Included in Pro licence | $15/user/month |
Visualisation Depth: Where Tableau Still Leads
The honest answer on visualisation is that Power BI has closed the gap considerably since 2022, but Tableau still leads for complex, custom chart work. If your team needs to build publication-quality dashboards, statistical charts beyond standard bar/line/pie, or highly interactive exploratory visualisations, Tableau’s VizQL engine and chart library give you more to work with.
Power BI’s visualisation is genuinely strong for standard business reporting. The gap shows up in edge cases: advanced geospatial analysis, custom chart types not in the standard library, and visualisations that need precise pixel-level control. For most finance and RevOps reporting, Power BI’s visualisation depth is sufficient.
The Microsoft Fabric Angle: Power BI Is Now Part of a Bigger Bet
In 2026, Power BI decisions cannot be separated from the Microsoft Fabric question. Microsoft Fabric is a unified data platform that brings together data engineering, warehousing, real-time analytics, data science and business intelligence under one capacity licence. Power BI is the BI layer of Fabric.
What this means in practice: organisations that buy Fabric capacity get Power BI included. Viewer licences effectively disappear at Fabric F64 capacity and above. Copilot becomes native. The economics shift from per-user licensing to capacity-based pricing, which favours large deployments with many report consumers.
For organisations evaluating Power BI in 2026, the real question is not Power BI vs Tableau. The real question is Microsoft Fabric vs a best-of-breed data stack. If you are moving toward Azure, that question is probably already answered.
Which Tool Should You Choose?
| Your situation | Recommendation |
|---|---|
| Your organisation runs Microsoft 365 and Azure | Power BI. The ecosystem fit alone justifies it. Fabric makes it even clearer. |
| Your team is primarily Salesforce users who need CRM dashboards | Tableau. Native Salesforce integration and Tableau Pulse for proactive CRM insights. |
| You need the best visualisation quality on the market | Tableau. The chart library depth and VizQL flexibility are still ahead of Power BI. |
| You have a large organisation with many report consumers vs creators | Power BI. The per-viewer cost advantage compounds at scale. Fabric capacity removes it entirely. |
| Your analysts are Excel-native and need a short learning curve | Power BI. DAX is learnable for Excel users. Tableau’s VizQL is a bigger shift. |
| You need embedded analytics in a customer-facing product | Either. Tableau Embedded is strong. Power BI Embedded via Azure is also mature. |
| You need live operational data in spreadsheets alongside BI dashboards | Coefficient alongside either tool. See below. |
When Your Team Works in Spreadsheets, Not Dashboards
Both Power BI and Tableau are built for analysts who create dashboards that business users then consume. The workflow assumes someone builds the report and someone else reads it.

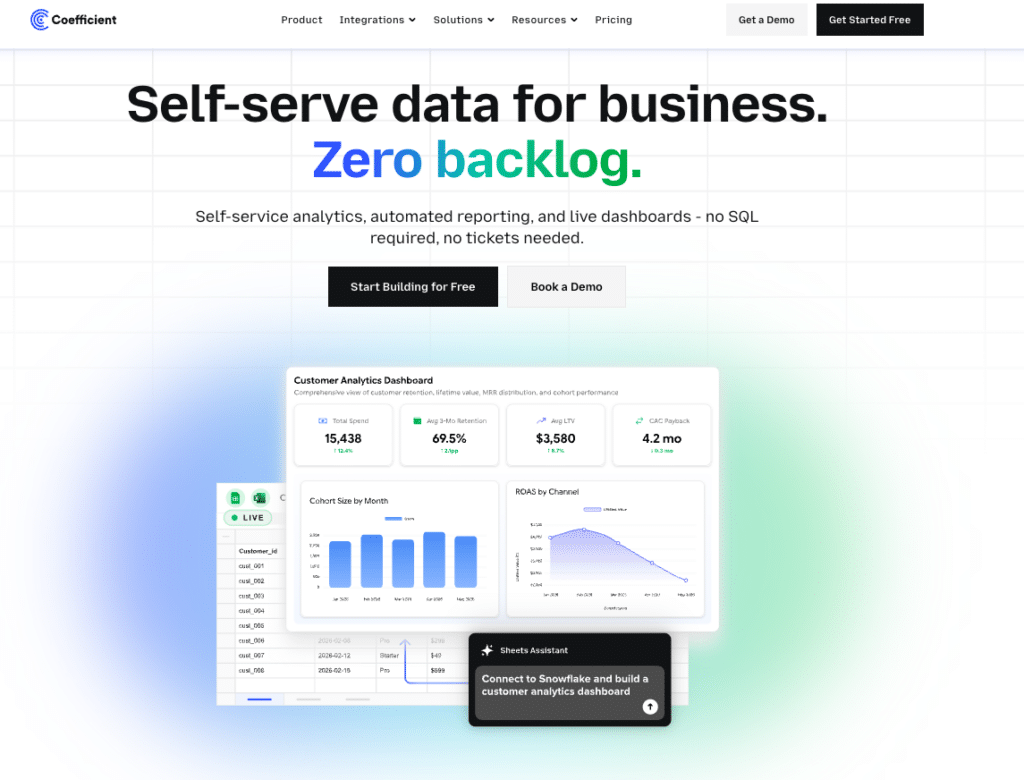
Stop exporting data manually. Sync data from your business systems into Google Sheets or Excel with Coefficient and set it on a refresh schedule.

Most finance, RevOps and ops teams do not work that way. They work in Google Sheets and Excel, doing their own analysis, sharing via links rather than BI platform URLs, and needing their data to stay live without filing a ticket.
Coefficient connects Google Sheets and Excel to 100+ source systems, including Salesforce, HubSpot, NetSuite, Snowflake, Power BI and Tableau data sources, with scheduled auto-refresh and two-way sync. Vibe Reporting lets teams describe a dashboard in plain English and publish a live, shareable web dashboard from their spreadsheet data. The output is BI-quality. The workflow stays in the spreadsheet.
For teams choosing between Power BI and Tableau, Coefficient is often the right complement to either, not a replacement. Business users access live data in spreadsheets. BI teams build governed models in Power BI or Tableau, and both stay current without manual exports.
| “Coefficient automated everything. Instead of manually exporting data every day, I just sit back and watch the data update automatically.” Christian Budnik, FP&A Analyst, Solv |
Frequently Asked Questions
Is Power BI cheaper than Tableau?
Yes, considerably. Power BI Pro costs $14/user/month. Tableau Creator costs $75/user/month. For a 100-user deployment, Power BI runs approximately $16,800/year vs Tableau at $32,400/year plus Tableau Cloud or Server costs. At Fabric capacity scale, Power BI’s viewer cost disappears entirely.
Which has better AI features in 2026?
They solve different problems. Microsoft Copilot helps you build reports faster and write DAX. Tableau Pulse monitors your metrics proactively and pushes relevant changes to you. Copilot is stronger for report creation. Pulse is stronger for metric monitoring without opening a dashboard.
Which is easier to learn?
Power BI is considerably easier for Excel users. The interface is familiar, DAX borrows from Excel formula logic, and the learning curve is gentler. Tableau’s VizQL interface is intuitive for drag-and-drop visualisation but harder to master for complex calculations. Both require real training to use well.
Can you use Power BI and Tableau together?
Yes, and some large organisations do. A common pattern is Tableau for analyst exploration and Power BI for business user reporting, both sitting on top of the same governed data model. The cost of maintaining both is high, so most organisations consolidate on one.
Which is better for Salesforce users?
Tableau. The native Salesforce integration is a genuine advantage. CRM data flows directly into Tableau without ETL, and Tableau Pulse integrates metric monitoring into Salesforce workflows. Power BI can connect to Salesforce but it is not native.
Which is better for Microsoft 365 users?
Power BI. The integration with Excel, Teams, SharePoint and Azure is native and deep. Microsoft Fabric consolidates the entire data stack including Power BI under one capacity licence, making it the natural choice for Microsoft-committed organisations.
What if neither Power BI nor Tableau is the right fit?
If your team does most of its analytical work in spreadsheets rather than in a BI tool, Coefficient is worth evaluating. It connects Google Sheets and Excel to 100+ business systems with live data and two-way sync, and publishes shareable live dashboards via Vibe Reporting. Paid plans start at $49/month.
This post was last updated on April 2026 to ensure content relevancy and accuracy and was originally published on February 2024.


