Decimal separator mismatches occur when Salesforce exports ignore your Excel regional settings and default to US formatting, creating persistent formatting issues that require manual correction.
Here’s how to resolve these formatting conflicts at the source and get data that automatically aligns with your regional preferences.
Eliminate formatting conflicts with direct Salesforce connections using Coefficient
Coefficient resolves decimal separator mismatches by establishing direct API connections that respect your Excel regional preferences, unlike CSV exports that apply source system formatting.
How to make it work
Step 1. Set up a direct Salesforce connection.
Install Coefficient in Excel and authenticate with your Salesforce account. The connection automatically detects your regional settings and applies the correct decimal separators during data retrieval.
Step 2. Import your desired reports or create custom queries.
Select any Salesforce report or build custom queries from objects and fields. The import process automatically handles decimal separator formatting according to your Excel locale settings.
Step 3. Configure scheduled refreshes.
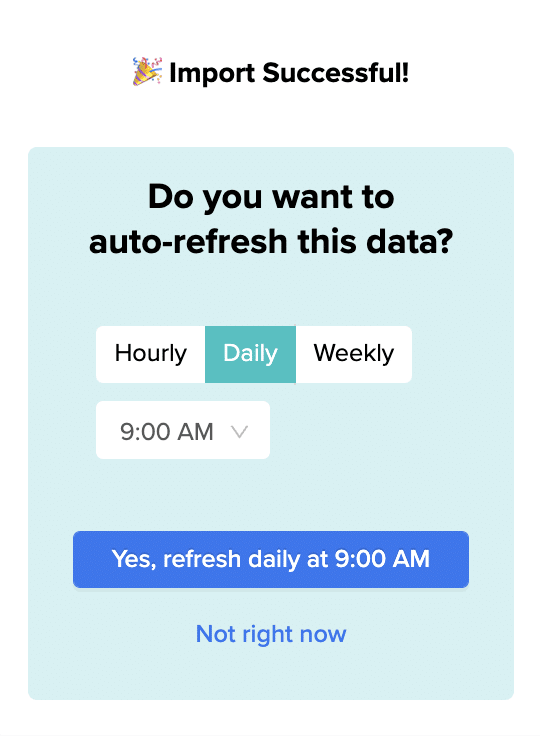
Set up automatic updates on your preferred schedule – hourly, daily, or weekly. Each refresh maintains proper formatting without requiring manual adjustments or export/import formatting corrections.
Get properly aligned formatting from the start
Direct connections eliminate the root cause of decimal separator mismatches and provide consistent formatting across all refresh cycles. Start using Coefficient to get Salesforce data that automatically matches your regional preferences.
When Salesforce exports show dots instead of commas for decimals, it’s because the platform forces US number formatting regardless of your regional settings.
Here’s how to get properly formatted decimal separators that match your locale without manual corrections after each export.
Import Salesforce data with correct decimal formatting using Coefficient
Coefficient bypasses Salesforce’s problematic CSV export system by connecting directly through the API. This eliminates formatting conflicts and automatically applies your Excel regional settings during import.
How to make it work
Step 1. Connect Coefficient to your Salesforce account.
Install Coefficient from Excel’s add-ins store and authenticate with Salesforce. The connection automatically detects your Excel locale settings for proper decimal formatting.
Step 2. Import your desired report or create a custom query.
Select any existing Salesforce report or build custom queries from objects like Opportunities, Accounts, or Leads. All numeric fields will display with comma decimal separators automatically.
Step 3. Schedule automatic refreshes.
Set up hourly, daily, or weekly refreshes to keep your data current. Each refresh maintains consistent comma decimal formatting without requiring post-import corrections.
Get reliable decimal formatting every time
This approach eliminates the frustration of fixing decimal separators after each Salesforce export. Start using Coefficient to get properly formatted data that respects your regional preferences from the beginning.
The “inline editing isn’t supported for this cell” error appears when you try to edit checkbox fields on Opportunity Product objects through Salesforce reports. This is a platform constraint, not a permissions issue.
The error specifically affects boolean fields on related objects. Here’s how to bypass this limitation and edit your checkbox fields without restrictions.
Eliminate the error by editing in Google Sheets with Coefficient
Instead of fighting Salesforce’s inline editing restrictions, you can import your opportunity product data into Google Sheets where this error doesn’t exist. Then export your changes back to Salesforce through automated updates.
How to make it work
Step 1. Connect Salesforce to Google Sheets.
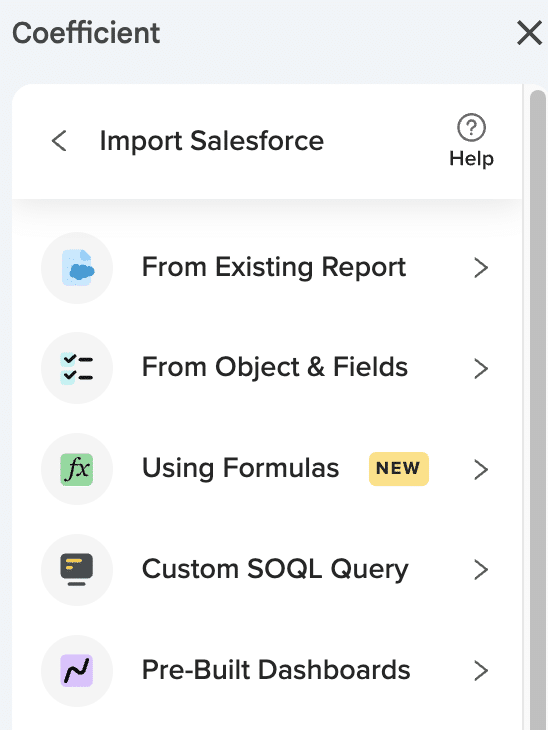
Install Coefficient in Google Sheets and connect your Salesforce account. Use the “From Objects & Fields” import method to pull Opportunity Product records with all your checkbox fields included.
Step 2. Edit checkbox values without restrictions.
In Google Sheets, modify checkbox values using TRUE/FALSE entries, data validation dropdowns, or formula-based bulk updates. You can edit hundreds of opportunity product checkbox fields simultaneously without encountering the “isn’t supported” error.
Step 3. Push changes back to Salesforce.
Use Coefficient’s export functionality with UPDATE operations to sync your checkbox changes back to Salesforce. The system automatically maps fields and uses the Opportunity Product ID to update the correct records.
Step 4. Automate the process.
Set up scheduled exports to run on your preferred timeline. This creates a seamless workflow where you edit in Google Sheets and changes automatically appear in Salesforce without manual intervention.
Skip the error and start editing
Don’t let Salesforce’s inline editing error slow down your opportunity management. This Google Sheets approach gives you unrestricted checkbox editing with automatic syncing back to your CRM. Get started with Coefficient to eliminate this error for good.
The “permission error” for opportunity product custom checkboxes during inline editing is typically not a true permissions issue but rather a manifestation of Salesforce report limitations that present as permission errors.
Even users with full field edit access encounter these errors when attempting to inline edit checkbox fields on Opportunity Product objects through reports. Here’s how to create a permissions-compliant solution that distinguishes between actual permissions and platform limitations.
Create a permissions-compliant solution with Coefficient
You can work within your existing security model while enabling checkbox editing functionality. This approach provides clarity on whether you’re dealing with actual field permissions or Salesforce’s inline editing restrictions.
How to make it work
Step 1. Inherit your Salesforce permissions.
Since Coefficient inherits your Salesforce user permissions, any fields you can access in Salesforce can be imported and edited through the Coefficient workflow. This ensures compliance with your existing security model.
Step 2. Import accessible custom checkbox fields.
Create an import of Opportunity Product records including your custom checkbox fields. Coefficient will only import fields you have access to, eliminating true permission restrictions from the editing process.
Step 3. Edit without permission errors.
In Google Sheets, edit checkbox values without encountering the “permission errors” that appear in Salesforce reports. These errors don’t exist in the spreadsheet environment, allowing unrestricted editing of authorized fields.
Step 4. Validate permissions before export.
Use Coefficient’s field mapping and preview functionality to identify any actual permission restrictions before attempting updates. This distinguishes between true permission limitations and Salesforce’s inline editing restrictions.
Step 5. Monitor export for real permission issues.
If actual permission restrictions exist, Coefficient’s results tracking will identify which fields can’t be updated, providing clarity on your true field permissions versus platform limitations.
Clarify permissions and enable editing
Don’t let confusing permission errors prevent your opportunity product checkbox editing. This approach distinguishes between real permissions and platform limitations while enabling the functionality you need. Build your permissions-compliant editing workflow today.
You’re staring at that cryptic error message again: “Cannot read property ‘length’ of undefined”
Your Salesforce data refresh just failed. No explanation. No diagnostic info. Just another morning ruined by Google’s native Salesforce connector.
Here’s the truth: These errors aren’t random glitches. They’re symptoms of fundamental flaws in Google’s Salesforce connector that make failures inevitable.
Why Google’s Salesforce Connector Keeps Failing You
Hidden Row Limits That Kill Your Reports
Google’s connector has a sneaky 10,000 row limit you can’t override, even with custom SOQL queries. One frustrated user put it perfectly: “I hate one thing: the addon applies a hidden 10,000 row limit that you can’t bypass… this really bothers me.”
When your sales team grows or you need historical data? Too bad. You’re stuck.
Silent Failures That Cost You Hours
When things break (and they will), you get no error notifications. The system fails silently, leaving you to discover problems hours or days later—usually when your boss asks for that critical report.
Authentication Nightmares
Constant timeout issues and IP restriction problems require complex workarounds. Users regularly report being locked out with no clear solution. Every manual refresh becomes a prayer that your authentication still works.
Inflexible Scheduling
You’re stuck with 4, 8, 12, or 24-hour refresh intervals. That’s it. No flexibility for real business needs. Need data every 30 minutes for that board meeting? Not happening.
Why 500,000+ Users Choose Coefficient Instead
“Not really sure what I did in spreadsheets without Coefficient at this point. The work I used to do manually now makes me sweat just thinking about it!” – Hannah R.
“I bring Coefficient to every organization I join. It’s the tool that levels up my ability to access Salesforce data.” – RevOps Professional
With a 4.8/5 star rating on Google Workspace and consistent 5-star reviews on G2, Coefficient has become the go-to solution for teams tired of fighting with native connectors.
How to Fix Your Refresh Errors with Coefficient (5 Simple Steps)
Step 1: Install Coefficient in Google Sheets
Open Google Sheets and install the Coefficient add-on. Connect to Salesforce with enterprise-grade authentication that actually stays connected—no more random logouts or IP restrictions.
Step 2: Create Your Salesforce Import
Select your Salesforce objects and reports directly from Coefficient’s intuitive interface. Pull unlimited rows of data—no hidden caps, no surprises.
Step 3: Set Up Smart Refreshes
Click the refresh button for instant updates with built-in validation. Schedule refreshes on any interval you need—hourly, daily, weekly, or custom. Watch real progress indicators instead of wondering if anything’s happening.
Step 4: Configure Intelligent Monitoring
Get instant Slack or email alerts when refreshes complete or encounter issues. No more silent failures. And if you need help? Their responsive support team typically responds within hours, not days.
Step 5: Scale Without Limits
Refresh multiple Salesforce imports simultaneously. Update thousands of records. Coefficient handles the complexity while you focus on insights.
Beyond Fixing Errors: Why Teams Love Coefficient
Built-in AI Sheets Assistant
Coefficient’s AI Assistant creates actual dashboards, charts, and pivots from your Salesforce data with natural language commands. It understands your sheet context and delivers real, editable output.
Two-Way Sync That Actually Works
Update Salesforce directly from your sheets. Change opportunity stages, update contact info, or bulk edit records—all from the comfort of Google Sheets.
Native Salesforce Formulas
Use formulas like =COEFFICIENT_SALESFORCE() to query live data directly. No exports, no manual refreshes, just real-time data when you need it.
Flexible Scheduling That Matches Your Business
Set refreshes every 15 minutes, every 3 hours, or any custom interval. Your data updates on your schedule, not Google’s arbitrary limitations.
Real-Time Monitoring and Alerts
Know instantly when important data changes. Set up sophisticated alerts based on any criteria—deal size, stage changes, or custom fields.
What Real Users Say
“Coefficient eliminates errors from manual transfers and gives me real-time insights at my fingertips. It’s a game-changer for faster decision-making.” – Finance Director, SaaS Company
“We tried every Salesforce connector available. Coefficient is the only one that doesn’t make me want to throw my laptop out the window.” – Sales Ops Manager
“The support team is incredible. They helped us set up complex workflows that we thought were impossible.” – Revenue Operations Lead
[IMAGE PLACEHOLDER: Customer testimonial cards with star ratings]
The Hidden Cost of Sticking with Google’s Native Connector
Every failed refresh costs you:
30 minutes troubleshooting mysterious errors
2 hours rebuilding corrupted data imports
Countless hours explaining to stakeholders why reports are delayed
One RevOps manager calculated they were losing 15 hours per month to connector issues. That’s almost two full workdays spent fighting with a tool that should just work.
Make the Switch Today
Stop accepting “undefined length property” as part of your workflow. Join 500,000+ users who’ve upgraded to reliable Salesforce syncing.
CRM Analytics Compare Tables lose their visual grouping structure during export, converting organized grouped data into flat, individual rows. The Compare Table’s grouping is a display feature that doesn’t persist through the export process, treating grouping as visualization rather than data structure.
Here’s how to recreate your Compare Table structure with preserved grouping that actually works in Excel.
Recreate Compare Table structure with persistent grouping using Coefficient
Coefficient enables you to recreate your Compare Table structure by importing the same Salesforce data that feeds your Compare Table. You’ll apply comparison logic using Excel’s native functionality, which maintains grouping permanently unlike CRM Analytics exports.
How to make it work
Step 1. Import your Compare Table data sources.
Use Coefficient’s “From Objects & Fields” to select identical fields from your Compare Table’s source objects. This gives you access to the same data that CRM Analytics uses for comparison analysis.
Step 2. Apply matching filtering criteria.
Set up the same filtering criteria using Coefficient’s dynamic filtering feature. You can create complex AND/OR logic that matches your CRM Analytics filters exactly.
Step 3. Create grouped comparisons using Excel functionality.
Build grouped comparisons using Excel’s built-in grouping or pivot table functionality. Apply conditional formatting to highlight comparison insights and create side-by-side analysis views.
Step 4. Implement comparison logic and calculations.
Use Excel formulas to recreate the comparison calculations from your CRM Analytics Compare Table. Set up percentage differences, variance calculations, and other comparison metrics that update automatically.
Step 5. Schedule automated data refresh.
Configure regular data updates to maintain current comparison data without manual exports. Your grouped comparison structure stays intact through every refresh.
Get comparison analysis that preserves your data structure
This approach completely eliminates the flat rows problem while providing more flexible comparison analysis capabilities than CRM Analytics Compare Tables. Start building comparison analyses that maintain proper grouping structure permanently.
The “Download in Excel format” button in CRM Analytics is designed for data portability, not format preservation. This button extracts underlying data records without maintaining visual grouping structure, which is why your organized grouped data becomes flat rows in Excel.
Here’s how to eliminate dependence on that problematic download button while getting properly structured data.
Replace the download button with live data connections using Coefficient
Rather than relying on CRM Analytics’ flawed export functionality, Coefficient provides a complete alternative. You’ll connect directly to your source Salesforce data and apply proper Excel grouping that won’t disappear, eliminating the need for manual downloads entirely.
How to make it work
Step 1. Identify your dashboard’s data sources.
Determine which Salesforce objects feed your CRM Analytics dashboard. This might include standard objects like Accounts, Opportunities, or Leads, plus any custom objects specific to your organization.
Step 2. Import identical data using Coefficient.
Use Coefficient’s “From Objects & Fields” feature to import the same data that appears in your CRM Analytics dashboard. Select the exact fields and apply the same filtering criteria for consistency.
Create grouping, subtotals, and formatting using Excel’s built-in features. This grouping structure remains intact indefinitely, unlike the flattened data from CRM Analytics downloads.
Step 4. Set up automated refresh schedules.
Configure automatic data updates (hourly, daily, or weekly) to replace manual downloads. Your data stays current and your grouping structure is preserved through every refresh.
Eliminate manual downloads with automated data management
This approach eliminates dependence on CRM Analytics’ flawed export functionality while providing superior data management capabilities. Start building automated data workflows that preserve your structure exactly how you need it.
This partial data export issue occurs because your reporting system displays large datasets through pagination and lazy loading, but the Excel export function has a hard row limit that cuts off data at approximately 2000 rows.
The export process uses different memory allocation and file generation constraints than the display interface. Here’s how to get all your visible customer data.
Access complete customer datasets using Coefficient
Coefficient solves this missing export data problem by circumventing the export function’s limitations entirely. Rather than relying on Salesforce’s constrained export mechanism, Coefficient establishes direct API connections to pull complete customer datasets.
How to make it work
Step 1. Connect directly to your Salesforce data source.
Install Coefficient and authenticate with your Salesforce org. This creates an API-based connection that pulls data directly from the source without involving export functions.
Step 2. Import all visible customers from your report.
Use Coefficient’s “From Existing Report” option to import the same report that displays all your customers. This retrieves all 6000+ customers that appear in your report interface.
Step 3. Preserve customer order relationships.
Import related order data to maintain complete customer purchase frequency patterns that get lost in partial exports. Use object relationships to pull connected data automatically.
Step 4. Set up filtered segments for targeted analysis.
Create specific customer groups using Coefficient’s filtering without hitting global row limits. Apply complex AND/OR logic to segment customers dynamically.
Ensure complete customer visibility for accurate analysis
This approach guarantees your customer recurrence analysis includes all visible customers rather than being artificially truncated at row 2013. Get started with Coefficient to access your complete customer dataset.
Salesforce CSV exports have inherent limitations with decimal separator formatting, often ignoring regional preferences and creating delimiter conflicts when commas serve as both field separators and decimal separators.
Instead of fighting with CSV export configurations, there’s a direct approach that eliminates these formatting issues entirely.
Skip CSV exports and connect directly to Salesforce using Coefficient
Coefficient establishes direct API connections to Salesforce, bypassing CSV limitations completely. This approach provides real-time data access with automatic regional formatting based on your Excel locale.
How to make it work
Step 1. Install Coefficient and authenticate with Salesforce.
Add Coefficient to Excel through the Microsoft AppSource. Connect your Salesforce account through the sidebar – the platform automatically handles decimal separator formatting based on your regional settings.
Step 2. Import reports or build custom queries.
Access any Salesforce report directly or create custom queries from objects and fields. All numeric data imports with proper comma decimal separators without CSV delimiter conflicts.
Step 3. Set up scheduled refreshes.
Configure automatic updates on hourly, daily, or weekly schedules. Each refresh maintains consistent formatting and eliminates the need for CSV manipulation or export setting adjustments.
Eliminate CSV formatting headaches
Direct API connections provide superior data formatting compared to problematic CSV exports. Try Coefficient to get properly formatted Salesforce data with comma decimals applied automatically.
Integrating Google Ads reporting data into Salesforce dashboards requires connecting external data sources effectively to create unified marketing ROI analysis.
Here’s how to combine Google Ads performance metrics with Salesforce CRM data for comprehensive marketing attribution dashboards.
Build unified Google Ads Salesforce reporting using Coefficient
Coefficient provides an excellent solution for Google Ads integration by importing data from Google Sheets where many organizations export their Google Ads reports. This enables comprehensive marketing attribution analysis.
How to make it work
Step 1. Export Google Ads data to Google Sheets.
Set up your Google Ads reports in Google Sheets, either manually or through automated export tools. Include key metrics like campaign performance, cost per click, conversion rates, and attribution data.
Step 2. Configure automated data imports.
Use Coefficient to import Google Ads data from Google Sheets into Salesforce custom objects. Set up daily or weekly imports to match your Google Ads reporting cycles and ensure current performance data.
Step 3. Create relationships between campaigns and leads.
Map Google Ads campaigns to Salesforce leads and opportunities using campaign identifiers or UTM parameters. This enables tracking from initial ad click through closed deals.
Create Lightning dashboard components that combine Google Ads performance metrics with Salesforce CRM data. Track customer acquisition cost, lifetime value, and ROI across the entire funnel.
Key reporting capabilities you’ll unlock
Unified marketing ROI dashboards.
Show Google Ads campaign performance alongside Salesforce lead and opportunity data to track marketing ROI from initial click to closed deal.
Customer acquisition cost tracking.
Calculate true customer acquisition costs by combining Google Ads spend data with Salesforce conversion metrics and deal values.
Historical trending and analysis.
Preserve historical Google Ads data for period-over-period analysis and long-term marketing performance trending that External Objects can’t provide.
Get complete marketing attribution visibility
This approach enables comprehensive Google Ads Salesforce dashboard integration without the limitations of External Objects or complex middleware solutions. Start building your unified marketing attribution dashboards today.