Effective case resolution visualizations need to show resolution time distributions, highlight outliers, and compare performance across product categories. Standard Salesforce reports can’t easily calculate average resolution times across product categories or create the flexible visualizations needed for comprehensive case resolution analytics.
Here are the most effective visualization techniques and how to build them using your case resolution data.
Create advanced case resolution visualizations using Coefficient
Coefficient significantly enhances your ability to create effective case resolution analytics by pulling rich case data including Product, Created Date, Closed Date, Priority, and Category fields. You can build pivot tables and charts that standard Salesforce dashboards simply can’t replicate.
How to make it work
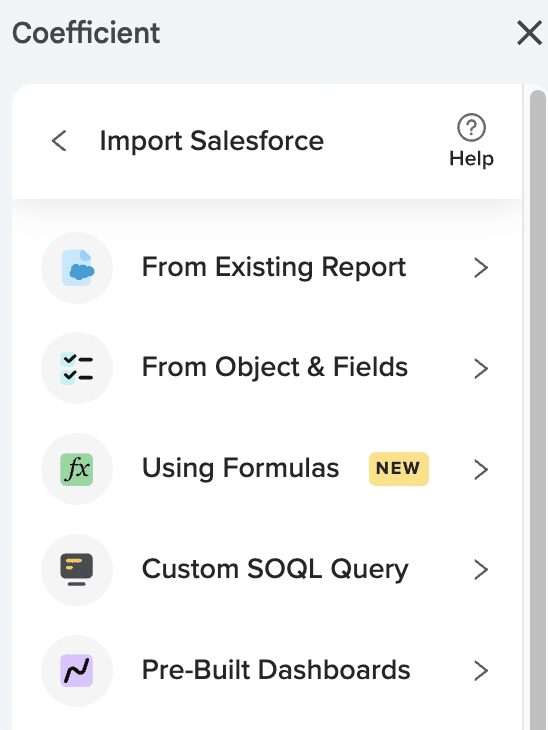
Step 1. Import comprehensive case data with product categories.
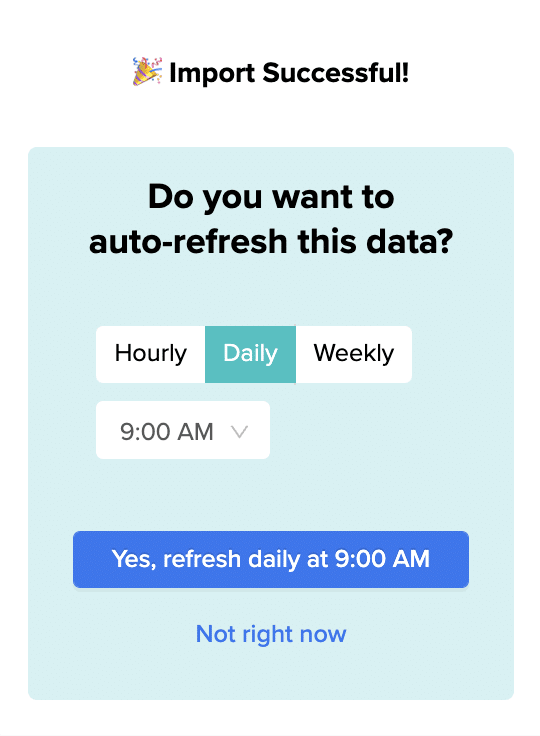
Pull case data including Product, Created Date, Closed Date, Priority, and Category fields. Set up hourly refreshes during business hours to maintain current case resolution metrics and ensure your visualizations reflect the latest support performance data.
Step 2. Calculate resolution times using NETWORKDAYS formulas.
Create advanced time calculations that show resolution times in business days rather than calendar days: `=NETWORKDAYS(CreatedDate,ClosedDate)`. This gives you more accurate resolution metrics that account for weekends and holidays.
Step 3. Build box plot charts for resolution time distributions.
Create box plots that show resolution time distributions by product category, highlighting outliers and median times. These visualizations immediately show which product categories have consistent resolution times versus those with high variability.
Step 4. Create heat maps for resolution time patterns.
Use conditional formatting to display average resolution times across product categories and case priorities as heat maps. This creates an instant visual reference for identifying problem areas that need attention.
Step 5. Build comparative trend lines over time.
Track resolution time improvements over time by product category using line charts. Create monthly snapshots to identify seasonal patterns and measure the impact of process improvements on case resolution performance.
Turn case data into actionable insights
The right visualizations transform raw case resolution data into clear insights that help improve support performance across all product categories. Start building your advanced case resolution analytics with Coefficient.
The difference occurs because Salesforce uses distinct API call patterns and permission validation methods for in-page versus external report exports. In-page exports trigger more comprehensive field-level security checks through the Analytics API.
Rather than troubleshooting these complex API differences, you can establish consistent data access that works regardless of user profile or export context.
Get unified data access that eliminates context-dependent issues using Coefficient
Coefficient provides consistent data access through REST API connections that don’t vary based on where the request originates. This eliminates the subtle differences between Salesforce’s various export mechanisms.
How to make it work
Step 1. Connect directly to Salesforce objects and reports.
Use Coefficient’s “From Existing Report” or “From Objects & Fields” features to access your data. This uses REST API for all data retrieval, eliminating context-dependent permission issues that cause in-page export failures.
Step 2. Control field mapping explicitly.
Select exactly which fields to include in your imports during setup. Coefficient clearly identifies which fields are accessible to specific user profiles, avoiding the problematic fields that trigger exceptions in certain contexts.
Step 3. Set up consistent automated updates.
Configure scheduled refreshes (hourly, daily, or weekly) so the same data access method works for all user types. This eliminates the variability that causes some export methods to work while others fail.
Step 4. Monitor field access transparency.
Coefficient provides clear visibility into which fields are accessible during import setup. This helps you understand permission restrictions without having to test different export contexts.
Eliminate export method variability with reliable data access
This approach provides predictable data access that doesn’t depend on understanding Salesforce’s various API implementations. Try Coefficient to get consistent data access regardless of user context or export method.
Formula fields get disabled with local CSV uploads because most platforms treat these files as static, read-only data sources that can’t support dynamic calculations. This limitation forces you to work with raw data only, eliminating the analytical power you need.
Here’s how to unlock full formula functionality by replacing static CSV uploads with dynamic data connections.
Enable formulas with live data connections using Coefficient
Coefficient eliminates formula restrictions by treating all connected data sources equally, regardless of origin. Instead of uploading static CSV files, you create live connections to Google Sheets that support full formula capabilities.
How to make it work
Step 1. Move your CSV data to Google Sheets.
Upload your CSV file to Google Sheets using File > Import or by dragging the file directly into a new spreadsheet. This preserves your data structure while making it accessible for dynamic connections.
Step 2. Connect Coefficient to your Google Sheets document.
Install Coefficient and connect it to your Salesforce or Salesforce instance. Set up your data import using the Google Sheets document as your source instead of uploading static files.
Step 3. Implement Formula Auto Fill Down.
Place your formulas in the column immediately to the right of your imported data. Coefficient’s Formula Auto Fill Down feature automatically applies these formulas to new rows during each refresh. This works with complex calculations including VLOOKUP, conditional logic, and mathematical operations.
Step 4. Configure automatic refresh schedules.
Set up scheduled refreshes so your formulas update automatically with new data. Choose hourly, daily, or weekly intervals based on how often your source data changes. Your formulas will recalculate every time fresh data comes in.
Transform your data analysis capabilities
This approach gives you the analytical power that static CSV uploads can’t provide. Your formulas update dynamically with refreshed data, creating a robust analytical system that grows with your needs. Start building formula-enabled data streams today.
This limitation exists because most platforms treat local CSV uploads as static, read-only data sources to prevent data corruption and maintain source integrity. However, this creates significant workflow limitations that prevent you from making necessary data adjustments.
Here’s how to enable full editing capabilities by replacing static uploads with dynamic connections that support collaborative data management.
Enable full editing capabilities using Coefficient
Coefficient addresses this through its dynamic connection approach by establishing live connections to editable data sources instead of creating static, immutable snapshots.
How to make it work
Step 1. Set up Google Sheets integration.
Upload your CSV data to Google Sheets where you gain full editing capabilities within the connected spreadsheet. This transforms your static data into an editable source that maintains live connections to your systems.
Step 2. Establish dynamic connections.
Connect Coefficient to your Google Sheets document and your Salesforce or Salesforce instance. This creates a live connection where changes to source data automatically flow through to your data stream during the next refresh.
Step 3. Configure scheduled exports for data synchronization.
Set up scheduled exports to push modified data back to external systems like Salesforce or databases using UPDATE, INSERT, or UPSERT actions. This ensures your edits propagate throughout your entire data ecosystem automatically.
Step 4. Implement Formula Auto Fill Down for dynamic calculations.
Enable automatic application of calculations to new or modified data by placing formulas in columns adjacent to your imported data. These formulas update automatically when you edit source data, maintaining analytical consistency across your workflow.
Enable collaborative data management
This approach eliminates the edit restrictions of static CSV uploads while providing superior data management capabilities including collaborative editing, automated synchronization, and maintained data lineage. Start building your editable data system today.
The native Salesforce Data Connector can’t access custom objects because it was designed only for standard objects and lacks the flexibility to handle diverse schema variations.
Here’s how to import all your custom objects, fields, and relationships without any restrictions.
Import all Salesforce custom objects using Coefficient
Coefficient provides full support for ALL Salesforce custom objects, making it essential for organizations with customized Salesforce implementations. You can access any custom object visible to your Salesforce user, including all custom fields, formula fields, and complex relationships.
How to make it work
Step 1. Open Coefficient in Google Sheets and connect to Salesforce.
Install Coefficient from the Google Workspace Marketplace and authorize your Salesforce connection. The platform automatically detects all objects you have access to, including custom ones.
Step 2. Select “Import from Salesforce” and choose “From Objects & Fields”.
This method gives you access to the complete object schema. Your custom objects appear alongside standard objects in the selection list, clearly marked with their API names.
Step 3. Select your custom object and choose fields.
Browse through extensive field lists that include all custom fields, formula fields, and lookup relationships. You can select any combination of fields from your custom object and related objects.
Step 4. Apply filters using complex AND/OR logic.
Set up sophisticated filtering on custom fields using operators like equals, contains, greater than, and date ranges. Dynamic filters let you point to cell values for flexible querying.
Step 5. Use custom SOQL queries for advanced relationships.
Write custom queries to join multiple custom objects or access parent-child hierarchies. For example:
Access your complete Salesforce data model
Custom objects contain your most valuable business data, and you shouldn’t be limited by connector restrictions. Coefficient’s comprehensive custom object support ensures you can analyze all your Salesforce data in Google Sheets. Start importing your custom objects today.
Salesforce dashboard filters fail with multiple report types because the platform requires filter fields to exist identically across all underlying objects. When you have Forecasting Quota reports and Opportunity reports on the same dashboard, Salesforce cannot apply a filter unless every component’s underlying object contains that exact field name and type.
Here’s why this happens and how to solve cross-object dashboard filtering without modifying your Salesforce org structure.
Technical limitations behind incompatible field types in Salesforce dashboards
This incompatible field types limitation is a fundamental architectural constraint of Salesforce dashboard engine. The platform has specific technical requirements that create systematic filtering failures.
Dashboard filters must map to identical field API names across all report types. Field data types must match exactly (Date, Text, Number, Picklist). Custom objects often lack standard fields present on other objects, and cross-object lookups don’t resolve filter compatibility issues.
How to make it work
Step 1. Import all report types into a unified analytical environment.
Use Coefficient to pull Forecasting, Opportunity, and any other Salesforce reports into a spreadsheet environment. This moves beyond Salesforce’s dashboard architecture limitations entirely.
Step 2. Create universal filters that work across all data sources.
Build filtering logic that works across all data sources without field existence requirements. Use dynamic cell references to create filters that can simultaneously work with different field names and data types.
Step 3. Build advanced filter combinations with AND/OR logic.
Create complex filtering scenarios that are impossible in Salesforce dashboards. Combine multiple criteria across different objects using spreadsheet formulas that don’t require identical field structures.
Step 4. Maintain live data with automated refresh scheduling.
Keep your analysis current with automated refresh scheduling while avoiding the technical debt of creating proxy fields in Salesforce. Set up hourly, daily, or weekly refreshes to maintain data accuracy across all imported objects.
Move beyond architectural constraints
This approach provides sales forecast dashboard error resolution without the complexity and maintenance burden of modifying your Salesforce org’s field structure. Start building unified cross-object dashboards that work beyond native limitations.
Your Salesforce formula fields contain critical business calculations—profit margins, lead scores, commission calculations. But when you import to Google Sheets using native connectors, they either vanish completely or arrive as useless static text.
The worst part? You don’t discover this until after building your entire reporting workflow, forcing you to rebuild everything from scratch.
Why Native Salesforce Connectors Drop Your Formula Fields (And Cost You Hours)
Here’s what actually happens when you try importing Salesforce data with formula fields:
The Silent Data Loss Problem
Native connectors like Salesforce Data Connector have fundamental API limitations that either:
Skip formula fields entirely – They simply don’t appear in your import
Import as static text – Your calculated values become frozen snapshots
Break on refresh – Formula results don’t update when source data changes
One frustrated user put it perfectly: “I spent 3 hours building a commission dashboard only to realize none of my formula fields were calculating. Had to manually recreate everything in Sheets.”
Why This Keeps Happening
Limited Field Recognition: Basic connectors can’t properly interpret Salesforce’s formula field types. They treat them like optional metadata instead of critical data.
Outdated API Implementation: Most connectors use simplified API calls that exclude calculated fields to “improve performance”—sacrificing your data completeness.
No Relationship Preservation: Formula fields that reference other objects break completely, leaving you with #ERROR values or blank cells.
Why 500,000+ Users Choose Coefficient Instead
“Coefficient saved our RevOps team 15+ hours per week. We finally have real-time Salesforce calculations flowing into our forecasting sheets.” – Sarah M., Revenue Operations Manager
“I bring Coefficient to every organization I join. It’s the only tool that actually preserves our complex Salesforce formulas.” – Mike T., Sales Analytics Lead
With a 4.8/5 star rating on Google Workspace and consistent recognition as a G2 Leader, Coefficient has become the go-to solution for teams who need complete Salesforce data—formula fields included.
How to Import ALL Your Salesforce Formula Fields with Coefficient (5 Simple Steps)
Step 1: Install Coefficient and Connect to Salesforce
Install the Coefficient add-on from Google Sheets in one click. Connect to Salesforce with enterprise-grade OAuth that stays connected (no more daily re-authentication nightmares).
Step 2: Select Your Salesforce Object with Formula Fields
Use Coefficient’s “From Objects & Fields” import method. You’ll immediately see ALL your fields—including formula fields clearly marked and ready to import.
What makes this different: Coefficient’s deep Salesforce integration recognizes and preserves every field type:
Currency formulas maintain formatting
Date calculations stay dynamic
Cross-object formulas resolve correctly
Percentage fields import with proper decimals
Step 3: Import with Live Formula Calculations
Select any combination of regular and formula fields. Watch as Coefficient imports not just the values, but maintains the calculation logic for automatic updates.
Step 4: Set Up Automated Refreshes That Actually Work
Configure refreshes on your schedule—hourly, daily, weekly, or custom intervals. Each refresh recalculates all formula values automatically.
Real user experience:“Our lead scoring formula updates every hour now. Sales gets fresh prioritization without me lifting a finger.” – Jessica R., Sales Ops
Step 5: Combine Salesforce Formulas with Google Sheets Power
Layer Google Sheets formulas on top of your Salesforce calculations. Coefficient’s Auto Fill Down feature ensures new rows automatically get your custom formulas applied.
Example: Import your Salesforce Probability_Score__c formula field, then add a Sheets formula like =IF(B2>80,”Hot Lead”,”Nurture”) for additional segmentation.
Beyond Formula Fields: Why Teams Stick with Coefficient
Built-in AI Sheets Assistant
The AI doesn’t just make suggestions—it builds actual charts, pivots, and formulas using your live Salesforce data.
Two-Way Sync That Actually Works
Update Salesforce directly from your sheets. Change opportunity stages, update contact info, or mass-edit records—all while preserving formula field integrity.
Native Salesforce Functions
Use formulas like =SALESFORCE_LOOKUP() to query live data on demand. No exports, no delays, just real-time Salesforce data in familiar spreadsheet formulas.
Enterprise-Grade Reliability
Smart error handling with clear messages (not cryptic failures)
Automatic retry logic for network issues
Row limit flexibility (not capped at 10,000 like native connectors)
Real-time alerts via Slack or email when data changes
The Hidden Cost of Broken Formula Fields
Every time formula fields fail to import correctly, you’re losing:
3-5 hours rebuilding calculations manually
Data accuracy from outdated static values
Team trust when reports show incorrect numbers
Decision speed from delayed insights
“Before Coefficient, I was manually updating 47 formula calculations every Monday. Now it’s automated and 100% accurate.” – Rachel S., Finance Manager
See Coefficient in Action with Your Own Data
Stop wrestling with broken formula field imports. Join 500,000+ users who’ve eliminated this problem completely.
The Salesforce Data Connector fails with complex SOQL queries because its basic query parser can’t handle advanced syntax, relationships, joins, subqueries, or aggregations.
Here’s how to run sophisticated SOQL queries that include relationships, aggregations, and complex filtering logic.
Run advanced SOQL queries using Coefficient
Coefficient provides enterprise-grade SOQL support with full syntax compatibility, including complex JOIN operations, aggregate functions, GROUP BY clauses, and date functions that the native connector simply can’t handle.
How to make it work
Step 1. Select “Custom SOQL Query” in Coefficient.
Choose this option when importing from Salesforce to access the full SOQL query builder. This unlocks all advanced SOQL capabilities that aren’t available through the basic connector.
Step 2. Write your complex SOQL query with full syntax support.
Use advanced features like subqueries, relationships, and aggregations. For example:
Step 3. Validate your query syntax with real-time feedback.
Coefficient provides immediate syntax validation and error checking as you write your query. This prevents common SOQL mistakes and ensures your query will execute successfully.
Step 4. Preview results before importing.
Test your query with a small sample to verify the results match your expectations. You can see the data structure and field types before committing to the full import.
Step 5. Schedule automated refreshes for dynamic reporting.
Set up hourly, daily, or weekly refreshes to keep your complex query results current. The same advanced SOQL capabilities work seamlessly with automated scheduling.
Unlock advanced Salesforce data analysis
Complex SOQL queries are essential for meaningful data analysis, but the native connector’s limitations force you to settle for basic data pulls. Coefficient’s full SOQL support enables sophisticated reporting and analysis directly in Google Sheets. Start running advanced queries today.
The 2000 row limit exists because of Salesforce API governor limits and the native connector’s basic architecture that can’t handle larger datasets efficiently.
Here’s how to bypass this limitation completely and import unlimited rows from Salesforce into your spreadsheets.
Import unlimited Salesforce rows using Coefficient
Coefficient eliminates the 2000 row restriction by using both REST API and Bulk API support with smart batch processing. You can import hundreds of thousands of records without hitting artificial limits, with the only exception being MFA-enabled orgs without unique ID fields.
How to make it work
Step 1. Connect your Salesforce account to Coefficient.
Install Coefficient from the Google Workspace Marketplace and authorize your Salesforce connection. The platform handles OAuth authentication and maintains stable connections even with MFA enabled.
Step 2. Choose your import method.
Select “Import from Objects & Fields” for standard imports or “Custom SOQL Query” for complex data needs. Both methods support unlimited row imports through intelligent batch processing.
Step 3. Select your object and fields without worrying about limits.
Choose any Salesforce object and select all the fields you need. Coefficient automatically optimizes the query and uses parallel batch execution to handle large datasets efficiently.
Step 4. Apply filters to optimize performance.
Use dynamic filters to point to cell values or set up complex AND/OR logic. This helps manage data volume while maintaining fast import speeds even for enterprise-level datasets.
Step 5. Set up automated refresh schedules.
Configure hourly, daily, or weekly refreshes to keep your data current. Coefficient maintains the same unlimited import capacity across all scheduled updates.
Start importing unlimited Salesforce data today
The native connector’s 2000 row limit doesn’t have to restrict your data analysis. Coefficient’s enterprise-grade architecture handles datasets of any size with reliable performance. Get started with unlimited Salesforce imports today.
Salesforce Maps separates temporal data from spatial layer information because of its underlying data architecture, which treats time-based visit tracking and geographic visualization as distinct functional areas with separate data models.
Here’s why this separation exists and how to overcome it for comprehensive geographic data consolidation and analysis.
The platform prioritizes real-time visualization over analytical reporting
This architectural separation occurs because visit tracking data lives in time-series objects focused on chronological events, while spatial layer data is stored in geographic objects optimized for mapping visualization. Salesforce Maps’ reporting engine lacks built-in cross-object relationship mapping between these data types, and the platform prioritizes real-time geographic visualization over complex analytical reporting needs in Salesforce .
How to make it work
Step 1. Use Coefficient as an external data consolidation platform.
Coefficient solves this architectural limitation by importing from both temporal and spatial data sources simultaneously. It can establish relationships that Salesforce Maps cannot create natively, enabling the spatial-temporal data merge that Maps’ separated architecture prevents.
Step 2. Import both data types and establish cross-dimensional relationships.
Pull visit tracking data (timestamps, duration) and spatial layer data (territories, marker colors, geographic boundaries) into your spreadsheet. Use common identifiers like User ID, Territory ID, or Location coordinates to connect these separate datasets.
Step 3. Create unified reports showing visit duration patterns by territory.
Build analysis that combines both temporal and spatial dimensions, such as average visit duration by territory assignment, rep performance metrics with geographic context, and time-based analysis across different marker layer categories.
Step 4. Build historical trending with combined dimensions.
Create reports that show historical patterns combining both temporal and spatial elements, such as territory performance over time, seasonal visit patterns by geographic region, and rep efficiency trends across different territorial assignments.
Step 5. Set up automated refresh for ongoing integrated analysis.
Schedule regular data updates to maintain current information across both temporal and spatial dimensions. Your integrated reports stay synchronized with Salesforce Maps activity automatically.
Get the integrated reporting Maps’ architecture prevents
This approach provides comprehensive geographic data consolidation that overcomes Salesforce Maps’ architectural separation, delivering integrated spatial-temporal analysis for enhanced sales and field service management. Create your unified territory analysis today.