Connect live NetSuite transaction data to Google Sheets without API coding

You can connect live NetSuite transaction data to Google Sheets without writing any API code or scripts, using a completely visual interface that handles all the technical complexity.

Here’s how to set up live transaction data connections using point-and-click configuration instead of programming.

Access live NetSuite transactions with zero coding using Coefficient

Coefficient eliminates all API coding requirements for NetSuite transaction data. The one-time OAuth setup handles all API communication, and the visual interface lets you select transaction types, fields, and filters without any scripting knowledge.

How to make it work

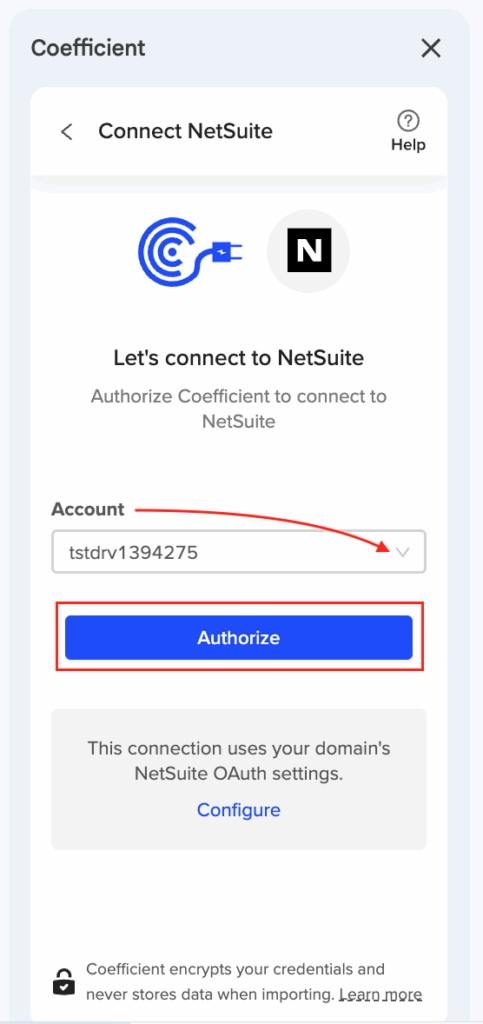
Step 1. Complete the one-time OAuth setup.

Your NetSuite admin configures OAuth integration once, and Coefficient automatically deploys the required RESTlet script. After this initial setup, no coding or technical knowledge is needed for ongoing use.

Step 2. Select your transaction data using the visual interface.

Click “Import from” → “NetSuite” → “Records & Lists” → “Transaction.” Choose your transaction type (Sales Orders, Invoices, Purchase Orders, etc.) from dropdown menus, then check the fields you want from a visual list.

Step 3. Apply filters without writing code.

Use dropdown menus to set filters with AND/OR logic. Filter by date ranges, transaction status, customer, or any other field using the point-and-click interface. Preview your data in real-time before importing.

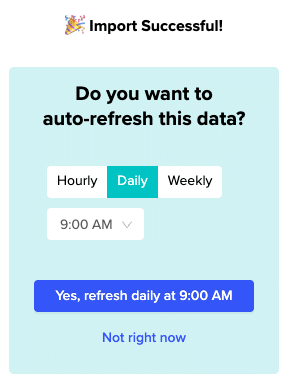
Step 4. Set up automated refresh scheduling.

Configure hourly, daily, or weekly updates through the visual scheduling interface. Enable email notifications and set your timezone preferences without touching any code.

Start connecting your transaction data today

This no-code approach makes live NetSuite transaction data accessible to all business users, regardless of technical expertise. You get powerful data connections without the complexity of API programming. Connect your transaction data in minutes, not months.

Connect month-end trial balance snapshot to Google Sheets for variance analysis

Month-end variance analysis requires consistent trial balance snapshots and period comparisons that are time-consuming to create manually. You can automate month-end trial balance snapshots with built-in variance analysis workflows that eliminate manual reporting tasks.

This automated approach provides rich variance analysis capabilities for comprehensive financial review processes.

Automate month-end snapshots and variance analysis using Coefficient

Coefficient provides excellent capabilities for connecting month-end trial balance snapshots from NetSuite to Google Sheets with automated variance analysis workflows. You can schedule snapshots and create comprehensive period comparisons automatically.

How to make it work

Step 1. Configure scheduled month-end imports.

Set up daily refresh schedules that activate on month-end dates using reporting period parameters for specific month-end snapshots. Create separate imports for current versus prior periods and maintain historical snapshots in dedicated sheets for audit trail purposes.

Step 2. Set up automated variance analysis imports.

Import current month trial balance alongside prior month and prior year comparisons for comprehensive analysis. Name your imports consistently like “Trial Balance – Oct 2024”, “Trial Balance – Sep 2024”, and “Trial Balance – Oct 2023” to maintain organization and enable automated calculations.

Step 3. Build period comparison analysis with SuiteQL.

Write SuiteQL queries for direct period comparisons. Example query: SELECT account.accountnumber, account.displayname, curr.balance as current_balance, prev.balance as prior_balance, (curr.balance – prev.balance) as variance FROM account LEFT JOIN (SELECT * FROM accountbalance WHERE period = ‘2024-10’) curr LEFT JOIN (SELECT * FROM accountbalance WHERE period = ‘2024-09’) prev.

Step 4. Create automated variance calculations and alerts.

Use Google Sheets formulas to calculate variance amounts and percentages automatically. Set up conditional formatting to highlight variances exceeding predetermined thresholds and create data validation rules for variance explanations. Build drill-down links to supporting detail for investigation purposes.

Step 5. Build advanced analytics and trending.

Create rolling 12-month trending analysis and budget versus actual variance comparisons. Build forecast accuracy measurements and department or class-level variance detail. Set up commentary tracking systems to document variance explanations and maintain historical context.

Transform your month-end close process

Automated variance analysis eliminates manual month-end reporting tasks while providing comprehensive financial review capabilities. This approach ensures consistent analysis across periods and enables faster identification of significant variances. Start automating your month-end variance analysis today.

Connect multiple company trial balances to single Google Sheets dashboard via API

Managing trial balances across multiple companies requires constant switching between systems and manual consolidation work. You can eliminate this complexity by connecting all company trial balances to a single Google Sheets dashboard through automated API integration.

This unified approach transforms isolated trial balances into a dynamic consolidated financial dashboard with minimal ongoing maintenance.

Build multi-company dashboards using Coefficient

Coefficient enables powerful multi-company trial balance consolidation from NetSuite into unified Google Sheets dashboards. You can connect multiple subsidiaries within a single NetSuite account or separate NetSuite instances depending on your company structure.

How to make it work

Step 1. Configure multi-company authentication.

For multi-subsidiary NetSuite accounts, complete OAuth authentication once to access all authorized subsidiaries. For separate NetSuite instances, configure OAuth for each account and maintain multiple authenticated connections. Each connection requires NetSuite Admin setup with proper role permissions.

Step 2. Structure your multi-company imports.

Create separate imports for each company using clear naming conventions like “Trial Balance – Company A” and “Trial Balance – Company B”. Use consistent field selection across all companies to ensure proper consolidation and map each import to dedicated sheets within your dashboard workbook.

Step 3. Synchronize refresh schedules across companies.

Set identical refresh timing for all company imports to ensure consolidated reporting accuracy. Configure failure notifications for each import separately and use timezone considerations for global companies with different reporting schedules.

Step 4. Build consolidated analysis with SuiteQL.

For advanced cross-company analysis, write SuiteQL queries that pull data across subsidiaries. Example query: SELECT subsidiary.name as company, account.accountnumber, account.displayname, account.balance FROM account WHERE subsidiary.id IN (1, 2, 3) ORDER BY subsidiary.name, account.accountnumber. This approach works within multi-subsidiary NetSuite environments.

Step 5. Create the master dashboard with consolidation features.

Build real-time consolidation formulas that update automatically as individual company data refreshes. Create comparison analytics for side-by-side company performance and implement drill-down capabilities linking to detailed company sheets. Use data validation for company selection dropdowns and build variance analysis between companies.

Streamline your multi-company reporting

Consolidated dashboards eliminate the need to switch between systems while providing comprehensive cross-company analysis. This approach maintains individual company detail while enabling powerful comparative insights. Start consolidating your multi-company trial balances today.

Connect NetSuite account types and classifications to Excel pivot tables

Coefficient optimally connects NetSuite account types and classifications to Excel, providing data perfectly structured for powerful pivot table analysis with dynamic hierarchies and automated report updates.

This transforms static NetSuite classifications into dynamic, analyzable data perfect for Excel pivot table reporting with instant financial statement grouping and custom classification analysis.

Structure NetSuite classifications for powerful pivot analysis

The key is importing comprehensive classification fields and preparing data in Excel Table format for dynamic pivot table creation with multi-level grouping capabilities.

How to make it work

Step 1. Import comprehensive classification data.

Use Records & Lists → Account import including Account Type (Asset, Liability, Equity, Revenue, Expense), Account Subtype (Current Asset, Fixed Asset, etc.), Classification (Balance Sheet, Income Statement), and custom classifications if configured.

Step 2. Prepare data for pivot table optimization.

Import data directly into Excel Table format with all classifications as separate columns, consistent naming for pivot grouping, and numerical data included for analysis with enhanced classification fields like Cash Flow classifications.

Step 3. Configure recommended pivot structure.

Set Rows as Account Type → Subtype → Account for hierarchical grouping, Columns as Period, Subsidiary, Department for time and entity analysis, Values as Balance, Count, percentage of Total for comprehensive metrics, and Filters as Status, Currency, Custom Class for dynamic filtering.

Step 4. Build advanced analysis capabilities.

Create multi-level grouping with Type > Subtype > Individual accounts, dynamic hierarchies with expand/collapse account trees, cross-classification analysis by multiple dimensions, and calculated fields for ratios, percentages, and variances.

Transform classifications into dynamic financial intelligence

This approach enables dynamic reclassification analysis, account type distribution monitoring, and automated report updates with Power Pivot integration for complex DAX measures. Start building your classification-based pivot analysis today.

Connect NetSuite saved searches to Google Sheets using SuiteScript and Apps Script

You can connect NetSuite saved searches to Google Sheets without writing custom SuiteScript or Apps Script code by using a pre-built solution that handles all the technical complexity automatically.

This approach eliminates the need for JavaScript programming knowledge, OAuth implementation, and ongoing code maintenance while providing enterprise-grade reliability.

Skip custom scripting with Coefficient

Coefficient provides a no-code alternative to custom SuiteScript and Apps Script development for connecting NetSuite saved searches to Google Sheets. The solution includes automated RESTlet deployment, built-in authentication, and maintained API compatibility.

How to make it work

Step 1. Deploy the pre-built RESTlet script automatically.

Your NetSuite admin deploys Coefficient’s tested, secure RESTlet bundle without writing any custom code. The script handles all NetSuite API communications and includes built-in error handling and retry logic.

Step 2. Complete guided OAuth configuration.

Follow the step-by-step authentication process without coding OAuth flows manually. The system manages secure token exchange and automatic re-authentication reminders every 7 days.

Step 3. Select saved searches through visual interface.

Choose your desired saved searches from dropdown menus instead of writing API calls. Use the instant preview feature to see the first 50 rows before importing, eliminating the need for test scripts.

Step 4. Set up automated scheduling through UI.

Configure refresh intervals (hourly, daily, weekly) through the interface rather than writing cron jobs or trigger scripts. The system handles batch processing for large datasets automatically.

Connect without coding complexity

This no-code approach delivers enterprise-grade reliability in hours instead of weeks of development, with professional support and automatic updates included. Get started with your connection today.

Connect NetSuite subsidiary Chart of Accounts to master Excel workbook

Coefficient provides robust capabilities for connecting multiple NetSuite subsidiary Charts of Accounts into a master Excel workbook, supporting complex multi-entity consolidations with real-time synchronization.

This solution provides enterprise-grade subsidiary COA management directly in Excel, enabling centralized multi-entity financial management while maintaining subsidiary-level security.

Build comprehensive multi-subsidiary COA management

The system supports both consolidated and separate subsidiary approaches, with automatic consolidation updates and subsidiary-specific customizations maintained throughout the process.

How to make it work

Step 1. Set up subsidiary-specific imports.

Create separate sheets for each subsidiary using Records & Lists → Account with subsidiary filter. Apply filter “Subsidiary equals [Specific Subsidiary]” and import the same fields for consistency across entities including currency handling for multi-currency COAs.

Step 2. Choose your consolidation approach.

For single consolidated import, remove subsidiary filter for all-entity view and include Subsidiary field in import, then create pivot table for subsidiary analysis. For multiple linked imports, use separate import per subsidiary with master sheet using VLOOKUP or Power Query consolidation.

Step 3. Structure your master workbook.

Design with Tab 1 as Consolidated COA (all subsidiaries), Tabs 2-n as Individual subsidiary COAs, Summary Tab for rollup analysis, Mapping Tab for subsidiary-specific variations, and Dashboard for cross-subsidiary comparisons.

Step 4. Configure automated refresh strategy.

Schedule all subsidiary imports simultaneously with consistent timing for data integrity. Set up refresh notifications and monitor for subsidiary-specific changes including elimination entries and intercompany accounts.

Master multi-entity financial management in Excel

This approach enables automatic consolidation updates, centralized multi-entity financial management, and Excel-based consolidation without NetSuite OneWorld complexity. Start building your multi-subsidiary COA management system.

Connecting NetSuite multi-period financials to Excel variance analysis

NetSuite’s comparative period reporting has limitations that make sophisticated variance analysis difficult. Excel provides superior analytical capabilities when connected to multi-period NetSuite financial data through automated imports.

Here’s how to connect NetSuite multi-period financials to Excel for comprehensive variance analysis that updates automatically and supports complex comparative reporting requirements.

Connect multi-period data for automated variance calculations

Coefficient excels at connecting NetSuite multi-period financial data for sophisticated variance analysis in Excel. The platform overcomes NetSuite’s limitations in comparative period reporting with flexible import strategies.

How to make it work

Step 1. Import comparative financial reports for side-by-side analysis.

Use the Reports import method for Comparative Income Statement and select multiple accounting periods for month-over-month, quarter-over-quarter, or year-over-year comparisons. Include budget vs. actual comparisons and maintain consistent account structures across all periods.

Step 2. Create period-specific imports with coordinated refresh schedules.

Set up separate imports for each period requiring analysis using naming conventions like “TB_2024_Jan” and “TB_2024_Feb”. Schedule coordinated refreshes to ensure data consistency across all period imports during your analysis.

Step 3. Build Excel variance analysis formulas with automated calculations.

Create horizontal analysis with Variance $ = Current_Period – Prior_Period and Variance % = (Current_Period – Prior_Period) / Prior_Period. Use IFERROR functions to handle division by zero: =IFERROR((XLOOKUP($A2,Current!$A:$A,Current!$C:$C) – XLOOKUP($A2,Prior!$A:$A,Prior!$C:$C)) / XLOOKUP($A2,Prior!$A:$A,Prior!$C:$C), 0).

Step 4. Set up advanced variance features with conditional formatting.

Apply conditional formatting for variances exceeding 10% thresholds and create drill-down capabilities from summary to transaction detail. Build rolling period analysis with 13 months of data for comprehensive trend identification.

Turn static reports into dynamic variance models

Multi-period financial connections transform NetSuite data into powerful Excel analytical models that identify trends, anomalies, and improvement opportunities automatically. Build your variance analysis system today.

Convert NetSuite saved searches to SQL queries for SuiteAnalytics Connect

Converting NetSuite saved searches to SQL queries is complex due to internal field naming conventions and unique data model structures. The translation process often introduces errors and loses the original search logic you’ve carefully configured.

Here’s how to use your existing saved searches directly in Excel, plus a better approach for users who need SQL-like functionality without manual conversion work.

Import saved searches directly without SQL conversion using Coefficient

NetSuite saved searches can be imported directly into Excel without any SQL translation. This preserves all your search criteria, filters, and custom fields exactly as configured in NetSuite’s interface.

For users who need SQL capabilities, Coefficient offers SuiteQL with built-in syntax assistance that’s optimized for NetSuite’s data structure.

How to make it work

Step 1. Install Coefficient and connect to NetSuite.

Add Coefficient from Excel’s add-in store and authenticate with your NetSuite credentials using OAuth.

Step 2. Import saved searches directly.

Select “Saved Searches” from Coefficient’s menu, choose your existing search from the dropdown, and click import. All search logic transfers without conversion.

Step 3. Use SuiteQL for custom queries (optional).

If you need SQL functionality, select “SuiteQL Query” instead. Write queries with NetSuite-specific syntax using autocomplete assistance for table and field names.

Step 4. Set up automated refresh.

Schedule your imports to refresh hourly, daily, or weekly. Both saved searches and SuiteQL queries update automatically without manual intervention.

Preserve your NetSuite configuration investment

This approach saves hours of SQL conversion work while maintaining the reliability of your existing saved searches. You get the same data in Excel without the risk of translation errors or lost business logic. Try Coefficient to import your NetSuite saved searches directly without SQL conversion complexity.

Cost comparison of NetSuite Excel integration tools with trials

NetSuite Excel integration costs vary dramatically between traditional ODBC approaches and modern API-based solutions, with potential annual savings of $5,000-$6,000 when choosing the right tool and trial strategy.

Understanding the total cost of ownership, including hidden infrastructure and maintenance expenses, helps you make informed decisions during trial periods and avoid costly long-term commitments.

Compare true integration costs during extended trials using Coefficient

Coefficient offers transparent, user-based pricing with no hidden infrastructure costs, making it significantly more affordable than traditional ODBC approaches. During the free trial, you can test all import methods, automated scheduling, and large dataset handling without restrictions.

The biggest cost advantage comes from eliminating NetSuite ODBC licensing ($3,000-$5,000 annually) and avoiding infrastructure requirements like database servers and ongoing IT support.

How to make it work

Step 1. Calculate your current integration costs.

Add up NetSuite ODBC licensing ($3,000-$5,000/year), ODBC driver costs ($500-$1,500/year), infrastructure expenses, and IT support time. Traditional approaches typically cost $5,000-$10,000+ annually.

Step 2. Test full functionality during trial periods.

Use the first week to test connection setup and basic imports from NetSuite Records & Lists. Week two should focus on automated refresh reliability and scheduling options. Week three involves testing complex SuiteQL queries and large datasets up to 100,000 rows. Week four assesses user adoption and training requirements.

Step 3. Evaluate enterprise platforms carefully.

Celigo typically costs $2,000-$5,000 monthly with $10,000-$50,000 implementation fees, making it suitable only for comprehensive enterprise integration needs. CData drivers require $500-$2,000 per driver plus 20% annual maintenance fees.

Step 4. Calculate your ROI with modern solutions.

Coefficient’s user-based subscriptions typically range $1,200-$2,400 annually, providing $5,100-$6,300 in annual savings compared to ODBC approaches. Factor in reduced IT support needs and faster implementation times for additional value.

Maximize your integration investment

Modern API-based integration eliminates the hidden costs and complexity of traditional ODBC solutions while providing better reliability and user experience. Extended trials let you validate actual cost savings and functionality before committing. Start your free trial to see the real cost difference for your NetSuite Excel integration needs.

Create dynamic Excel link to NetSuite Chart of Accounts with real-time updates

Coefficient enables true dynamic linking between NetSuite Chart of Accounts and Excel with real-time update capabilities through automated refresh and live data connections.

This creates a truly dynamic link where Excel always reflects current NetSuite COA state without manual intervention, perfect for real-time financial analysis and reporting.

Establish dynamic COA linking with real-time updates

The key to dynamic linking is setting up both the initial connection and configuring automatic updates that capture changes as they happen in NetSuite.

How to make it work

Step 1. Set up your initial dynamic connection.

Use Coefficient’s Records & Lists import and select “Account” as your record type. Choose all relevant COA fields including Account Number, Name, Type, Status, and Parent Account to maintain hierarchical relationships.

Step 2. Configure real-time update settings.

Enable automated refresh with hourly frequency for near real-time updates. You can also use the on-sheet refresh button for immediate updates and set up scheduled refreshes during business hours.

Step 3. Leverage dynamic features.

The live preview shows the first 50 rows before importing, and field updates automatically capture new custom fields. The system preserves parent-child relationships and reflects account activations and deactivations.

Step 4. Build formulas and dashboards on live data.

Create Excel formulas referencing the imported data, build dashboards and reports on top of live data, and schedule hourly refresh during business hours with manual refresh available anytime.

Transform static data into dynamic insights

This approach creates a professional dynamic link with change detection that highlights modified accounts between refreshes and supports multi-currency updates. Get started with your dynamic NetSuite COA connection today.