
Metabase is a popular first BI tool. The open source option, a visual query builder and a simple cloud setup make it fast to start. But as teams grow, three problems surface consistently.
The step from $100/month Starter to $575/month Pro unlocks row-level security, interactive embedding and white-labeling, with nothing in between. Every person who logs in counts as a paid user, including read-only stakeholders. And without a semantic layer, the same metric ends up defined differently across dashboards as more teams build their own reports.
Here are ten alternatives that cover Metabase’s core use cases, with verified 2026 pricing, honest trade-offs and a clear recommendation for each team type.
| Tool | Starting price | Best for | Metabase capability traded |
| Coefficient | Free / $49/mo flat | Live AI dashboards from spreadsheet data; finance, RevOps, ops teams | Native SQL query builder, cross-database joins |
| Power BI | $14/user/mo (Pro) | Microsoft-stack orgs, enterprise BI with AI | No per-user fees, zero infrastructure setup |
| Tableau | $15/user/mo (Viewer) | Visualisation depth and exploratory analytics | Simpler setup, lower cost at small team sizes |
| Apache Superset | Free (self-hosted) | Open source with engineering capacity | Managed hosting, no maintenance burden |
| Looker | ~$5K/mo platform | Governed semantic layer at enterprise scale | Setup speed, cost, spreadsheet-native flow |
| Looker Studio | Free | Free Google-connected dashboards | Self-service depth, RLS, support |
| Zoho Analytics | $30/mo (Basic) | SMBs and Zoho ecosystem users | Enterprise scale, visualization depth |
| Amazon QuickSight | $24/user/mo (Pro) | AWS-native teams, pay-per-session pricing | Broader community, richer visualization set |
| Redash | Free (self-hosted) | SQL-first engineering teams | No-code builder, visual self-service |
| Lightdash | Free (self-hosted) | dbt-native teams, metrics-as-code | Non-technical self-service, managed hosting |
Pricing verified April 2026. Sources: metabase.com/pricing, powerbi.microsoft.com, tableau.com/pricing, cloud.google.com/looker/pricing, zoho.com/analytics/pricing.html, aws.amazon.com/quicksight/pricing, coefficient.io/pricing.
Why Teams Move Off Metabase
G2 and Capterra reviews and community forums surface four consistent pain points:
• No middle tier: row-level security, interactive embedding and SSO all require a jump from $100/month to $575/month. There is no add-on model.
• Per-user billing hits viewer-heavy teams hard: everyone who signs in, including those who only open a read-only dashboard, counts toward the monthly bill.
• Metric drift without a semantic layer: different analysts define the same KPI differently across dashboards, and there is no centralized enforcement layer to prevent it.
• Self-hosted maintenance overhead: the free open source version requires server setup, quarterly upgrades and security patching. For teams without platform engineers, this cost accumulates silently.
1. Coefficient
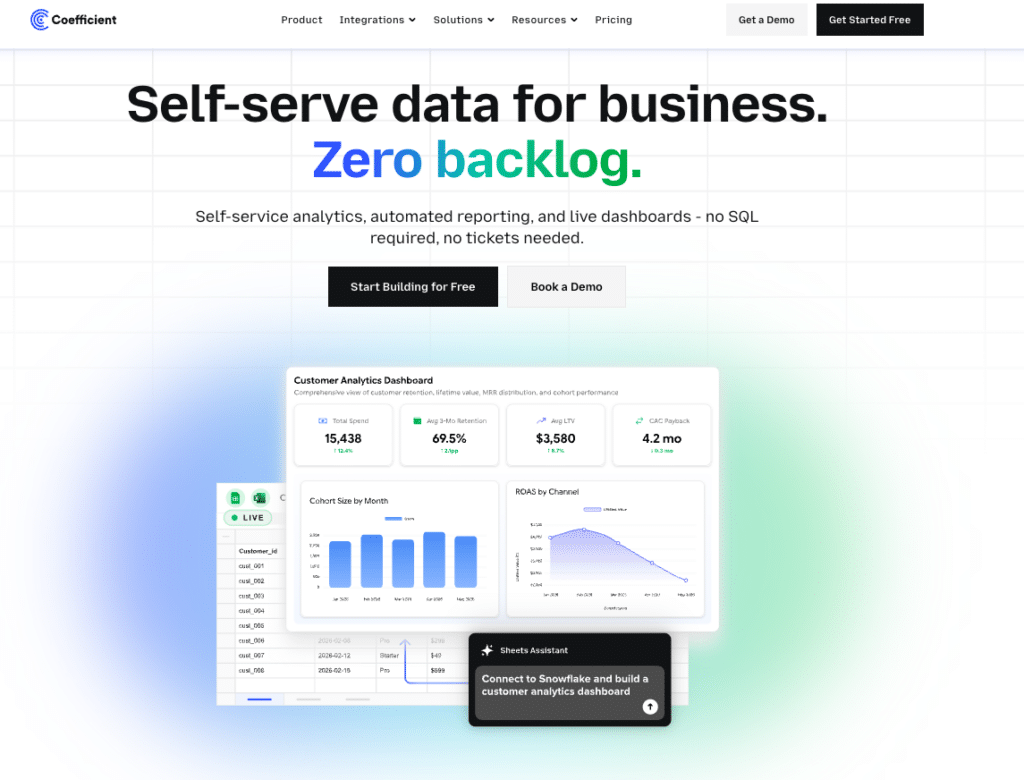
Best for: Teams that need live, shareable BI-quality dashboards without paying for a dedicated BI platform
Coefficient connects Google Sheets and Excel to 150+ business systems, including Salesforce, HubSpot, QuickBooks, NetSuite and Snowflake, with scheduled auto-refresh and two-way sync.
The key differentiator in 2026 is Live Web Dashboards: describe a dashboard in plain English and Coefficient publishes it as a live, shareable web dashboard directly from your spreadsheet data. No separate BI license. No platform to learn or maintain. The dashboard updates automatically as the underlying data refreshes.
For teams evaluating Metabase because they need shareable live dashboards on top of CRM, ERP or data warehouse data, this is the closest like-for-like output without Metabase’s per-user billing structure or server infrastructure requirement. Finance managers, RevOps leads and operations teams get BI-quality dashboards through the spreadsheet environment they already use daily. Sharing is a link, not a Metabase login.
Pros
- ✔ Live Web Dashboards publishes live, shareable web dashboards from spreadsheet data with no separate BI license required.
- ✔ No per-user viewer fees. Sharing a dashboard link with 50 stakeholders does not change the monthly bill.
- ✔ No server infrastructure to manage. Installs as a browser extension with no hosting, upgrades or patching.
- ✔ Two-way sync pushes updates back to Salesforce, HubSpot or QuickBooks without leaving the spreadsheet.
- ✔ Flat-rate pricing with a free tier. Predictable cost regardless of team size.
Cons
✖ Not a standalone BI platform. Requires Google Sheets or Excel as the working environment.
✖ No native SQL query builder for ad-hoc analysis against production databases.
✖ No cross-database joins or complex semantic modeling layer.
Pricing: Free plan available. Paid plans from $49/month flat. See coefficient.io/pricing.
“Coefficient automated everything. Instead of manually exporting data every day, I just sit back and watch the data update automatically.” — Christian Budnik, FP&A Analyst, Solv
2. Microsoft Power BI
Best for: Microsoft-stack organisations needing enterprise BI at a low per-user cost
Power BI is the default enterprise BI choice for organisations running Microsoft 365. Pro at $14/user/month makes it the most affordable per-user enterprise BI option available. It connects natively to Excel, SharePoint, Teams, Dynamics 365 and Azure without extra configuration.
The Copilot AI add-on ($30/user/month) generates DAX formulas, builds report pages from natural language prompts and summarises data. Power Query handles data transformation without a separate ETL tool. For organisations already invested in the Microsoft ecosystem, the integration friction is minimal.
The tradeoff: DAX, Microsoft’s formula language, has a steeper learning curve than Metabase’s visual query builder. Non-technical users need onboarding before they can build reports independently. Teams outside the Microsoft ecosystem get less value from it.
Pros
✔ Lowest per-user cost among enterprise BI platforms at $14/user/month Pro.
✔ Native Microsoft ecosystem integration: Excel, Teams, SharePoint, Dynamics and Azure.
✔ Copilot AI generates DAX formulas and report pages from natural language prompts.
✔ Free Desktop version for local report building before committing to a cloud license.
✔ Power Query provides built-in data transformation without a separate ETL tool.
Cons
✖ Copilot AI is an additional $30/user/month on top of the Pro license.
✖ DAX has a significant learning curve for complex custom calculations.
✖ Limited value for teams not invested in the Microsoft tooling ecosystem.
✖ Mac users have reduced functionality with the desktop app.
Pricing: Free Desktop; Pro $14/user/month; Premium Per User $24/user/month (annual). Copilot add-on $30/user/month. See powerbi.microsoft.com/pricing.
3. Tableau
Best for: Organisations that need the deepest visualisation flexibility and analyst-led data exploration
Tableau remains the benchmark for interactive data visualisation. Its drag-and-drop interface handles complex multi-dimensional exploration, custom geographic maps and detailed formatting at a level most BI tools cannot match. Tableau Pulse adds AI-generated metric summaries and proactive anomaly alerts.
2026 pricing: Creator $75/user/month, Explorer $42/user/month, Viewer $15/user/month, all billed annually. A 25-person team with mixed roles typically costs $1,200 to $2,000 per month, significantly more than Metabase at the same headcount.
Non-technical users need training before building their first dashboard. Complex metric governance requires Tableau Prep or an external semantic modeling tool. For teams that need visualisation quality above all else, Tableau is the clear choice. For teams where adoption across non-analysts matters, the onboarding investment is real.
Pros
✔ Industry-leading visualisation quality and chart type depth.
✔ Tableau Pulse delivers AI-generated metric summaries and proactive anomaly detection.
✔ Connects to 100+ databases, cloud warehouses and flat files.
✔ Strong community and training ecosystem for complex implementations.
Cons
✖ Creator at $75/user/month is the highest cost on this list for a primary authoring license.
✖ No free read-only tier. All viewers require a paid seat.
✖ No built-in semantic layer; complex metric governance requires external tooling.
✖ Non-technical users face a meaningful training requirement.
Pricing: Creator $75/user/month; Explorer $42/user/month; Viewer $15/user/month (annual). See tableau.com/pricing.
4. Apache Superset
Best for: Engineering-led teams that want open source BI with no vendor lock-in and no feature gating
Apache Superset is the highest-ceiling open source BI option available. Used in production at Airbnb, Lyft and Dropbox, it is actively maintained by the Apache Software Foundation and supports 40+ visualization types, a full SQL editor, row-level security, Jinja templating and a semantic layer for custom metrics.
Unlike Metabase, Superset has no feature gating. Row-level security, custom visualisations and unlimited users are available without a paid tier. The tradeoff is operational: production deployments require Docker or Kubernetes, regular security patching and a dedicated engineer. Non-technical users cannot self-serve the way they can in Metabase’s visual query builder.
Pros
✔ Free to self-host under Apache License 2.0, with no feature tiers.
✔ Row-level security, 40+ visualization types and a semantic layer, all without a paid plan.
✔ No per-user billing at any scale.
✔ Actively maintained with regular releases and a large community (73,000+ GitHub stars).
Cons
✖ Requires Docker or Kubernetes expertise for production deployment.
✖ Non-technical users face a steep onboarding barrier.
✖ Infrastructure costs replace licensing costs: $100 to $300/month depending on scale.
✖ No managed cloud hosting included.
Pricing: Free to self-host. Infrastructure costs typically $100 to $300/month. See superset.apache.org.
5. Looker
Best for: Data-mature organisations that need a governed semantic layer with consistent metric definitions across teams
Looker’s core differentiator is LookML: a semantic modeling layer that defines metrics centrally so every dashboard in the organisation uses the same definitions. This directly solves Metabase’s metric drift problem. Gemini AI adds natural language querying on top of those governed data models.
Platform pricing typically starts around $5,000/month with user licenses at $30/month (Viewer), $60/month (Standard) and $125/month (Developer). LookML requires a dedicated data engineer and typically takes 6+ weeks to learn. Implementation timelines of several weeks are common.
Looker makes sense when metric governance across a large, cross-functional organisation is the primary requirement. For most teams evaluating Metabase, the cost and implementation complexity make it a longer-term consideration rather than an immediate swap.
Pros
✔ LookML semantic layer enforces consistent metric definitions across all dashboards.
✔ Gemini AI enables natural language querying on governed data models.
✔ Native Google Cloud integration: BigQuery, Vertex AI and Workspace.
✔ Enterprise-grade permissions, audit logs and governance from day one.
Cons
✖ Platform fee starts around $5,000/month before user licenses.
✖ LookML has a steep learning curve, typically 6+ weeks to learn.
✖ Implementation takes weeks to months for new deployments.
✖ Customer support quality declined after the Google acquisition, per community feedback.
Pricing: Platform from ~$5,000/month; Viewer $30/user/month; Standard $60/user/month; Developer $125/user/month. See cloud.google.com/looker/pricing.
6. Looker Studio (Now known as Data Studio)
Best for: Teams that need free, shareable dashboards built on Google-connected data sources
Looker Studio (formerly Google Data Studio) is completely free with no feature tiers and no user limit. It connects to 200+ data sources including Google Analytics, Google Ads, BigQuery, Salesforce and MySQL. For teams inside Google Workspace, the setup friction is near zero.
The limitations are structural: no row-level security, no white-label, no persistent metric definitions and no meaningful customer support. Visualization quality has a ceiling that shows on complex dashboards. Outside the Google ecosystem, connector quality drops significantly. Gemini AI integration in Sheets is in beta as of 2026 and not yet production-ready for complex querying.
Looker Studio and Looker (above) are frequently confused. They are different products. Looker Studio is a free, simple dashboarding tool. Looker is a full data platform with LookML-based governance and enterprise pricing.
Pros
✔ Completely free with no user limit and no feature tiers.
✔ 200+ data source connectors including all major Google products.
✔ Easy sharing and collaboration inside Google Workspace.
✔ No server setup or maintenance required.
Cons
✖ No row-level security, white-label or persistent metric definitions.
✖ Visualization quality ceiling on complex dashboards.
✖ No customer support beyond community help.
✖ Connector quality drops significantly outside the Google ecosystem.
Pricing: Free. Looker Studio Pro is $9/user/month for additional governance features. See lookerstudio.google.com.
7. Zoho Analytics
Best for: SMBs and Zoho ecosystem users that need affordable published-pricing BI with AI included
Zoho Analytics is one of the few BI platforms with fully published pricing. Plans run from $30/month to $575/month on annual billing with per-account user pools rather than per-seat fees. Zia AI, Zoho’s analytics assistant, provides natural language querying across all plan tiers at no extra cost.
It supports 500+ connectors, cross-source data blending and a no-SQL interface with pivot tables and formulas. For teams already in the Zoho CRM or Zoho Books ecosystem, the integration overhead is minimal. For teams outside Zoho’s ecosystem, connecting third-party systems requires more technical effort than native alternatives.
Pros
✔ Fully transparent pricing published on the website, no sales call required.

Stop exporting data manually. Sync data from your business systems into Google Sheets or Excel with Coefficient and set it on a refresh schedule.
Get Started
✔ Per-account pricing rather than per-seat: more cost-effective for small teams with many viewers.
✔ Zia AI included at no extra cost across all plan tiers.
✔ 500+ connectors and cross-source data blending.
Cons
✖ Performance degrades noticeably at row counts above 10 million, per G2 reviews.
✖ Visualization depth and chart customisation fall short of Tableau or Power BI.
✖ Connecting to systems outside the Zoho ecosystem requires more technical effort.
✖ Less suitable for complex data modeling requirements.
Pricing: Free (2 users, 10K rows); Basic $30/month; Standard $60/month; Premium $145/month; Enterprise $575/month (annual). See zoho.com/analytics/pricing.
8. Amazon QuickSight
Best for: AWS-native teams that want managed BI without a separate platform contract
Amazon QuickSight is the natural BI choice for organisations already running workloads on AWS. It connects natively to Redshift, Athena, S3, RDS and other AWS services with minimal setup. The SPICE in-memory engine enables fast performance on large datasets. Pay-per-session pricing ($0.30/session, capped at $5/user/month for readers) can be significantly cheaper than per-seat models for organisations with sporadic or fluctuating usage patterns.
Outside the AWS ecosystem, QuickSight’s value diminishes. The user community is smaller than Power BI or Tableau, third-party integrations are fewer, and the visualisation library has less depth. ML-powered anomaly detection and forecasting are included, which is a meaningful differentiator for data teams that want predictive features without a separate tool.
Pros
✔ Pay-per-session pricing benefits teams with fluctuating or occasional users.
✔ Native integration with the full AWS ecosystem: Redshift, Athena, S3, RDS.
✔ SPICE in-memory engine delivers fast performance on large datasets.
✔ ML-powered anomaly detection and forecasting included without a separate tool.
Cons
✖ Limited value for teams not already invested in the AWS ecosystem.
✖ Smaller user community and fewer third-party integrations than Power BI or Tableau.
✖ Visualization library is less deep than Tableau or Power BI.
✖ Pro plan at $24/user/month positions it above Power BI Pro on per-user cost.
Pricing: Reader: $0.30/session (max $5/user/month); Author/Pro: $24/user/month (annual). See aws.amazon.com/quicksight/pricing.
9. Redash
Best for: SQL-first engineering teams that need lightweight query dashboards with no no-code overhead
Redash is a SQL-first, lightweight dashboarding tool built for developers. Connect a database, write a query, build a chart. It is fast to set up and gets out of the way. The open source version is free to self-host. Databricks acquired Redash and the hosted version was discontinued, but the project remains actively maintained.
Redash has no visual query builder for non-technical users, no row-level security and no white-label capability. It is not a self-service tool. For engineering teams that need to share query results with colleagues through a dashboard, it is a clean, minimal option. For any deployment needing RLS, non-technical self-serve or branding, it is not the right fit.
Self-hosting on AWS typically costs $25 to $40/month in compute before engineering time for setup and maintenance.
Pros
✔ Completely free to self-host.
✔ Fast and minimal for SQL-first developer teams.
✔ Parameterised queries for reusable reports.
✔ Actively maintained open source project.
Cons
✖ No visual query builder. Non-technical users cannot self-serve.
✖ No row-level security, white-label or semantic layer.
✖ Hosted product was discontinued. Self-hosting requires ongoing engineering support.
✖ Development has slowed since the Databricks acquisition.
Pricing: Free to self-host. Infrastructure costs ~$25 to $40/month on AWS. See redash.io.
10. Lightdash
Best for: Analytics engineering teams using dbt that want metrics defined in source control
Lightdash is purpose-built for teams using dbt. Metric definitions live in YAML files alongside dbt models, version-controlled in your repository. Any metric change goes through a pull request review like any other code change. This makes Lightdash the most auditable option for teams that need consistent, reviewable metric definitions.
It is actively maintained and open source. AI query agents were added in 2025 for natural language questions. The open source version is free to self-host. A managed cloud option is available for teams that prefer not to run their own instance.
Lightdash is not a drop-in Metabase replacement for non-technical users. The product is built around the dbt workflow. Teams not using dbt will find little value here. For dbt-native teams, it eliminates the metric drift problem that plagues Metabase at scale.
Pros
✔ Metrics defined in YAML alongside dbt models: version-controlled, reviewed and auditable.
✔ Eliminates metric drift by keeping the BI layer in sync with dbt transformations.
✔ AI query agents for natural language analysis added in 2025.
✔ Free to self-host with an active open source community.
Cons
✖ Only relevant for teams using dbt. No value outside that workflow.
✖ Non-technical users still face a learning curve without dbt context.
✖ Managed cloud pricing is not fully published.
✖ Fewer visualisation types than Superset or Tableau.
Pricing: Free to self-host. Cloud plan pricing on request. See lightdash.com.
Which Metabase Alternative Should You Choose?
The right replacement depends on your primary constraint.
• Spreadsheet-native team needing live dashboards without a BI stack: Coefficient Live Web Dashboards.
• Microsoft-stack enterprise: Power BI at $14/user/month.
• Visualisation quality and analyst-led exploration: Tableau.
• Open source with engineering capacity: Apache Superset.
• Governed semantic layer for a large organisation: Looker.
• Free Google-connected dashboards: Looker Studio.
• SMB on a budget with published pricing: Zoho Analytics.
• AWS-native team with variable usage: Amazon QuickSight.
• SQL-first engineering team needing lightweight dashboards: Redash.
• dbt-native team needing metrics in source control: Lightdash.
If the core need is live operational data displayed in shareable dashboards that update automatically, with no per-viewer billing and no infrastructure to manage, Coefficient is worth evaluating before committing to another BI platform contract. Connect your first data source free and describe the dashboard you need in plain English.
Coefficient connects Google Sheets and Excel to 100+ business systems with scheduled auto-refresh and two-way sync. Live Web Dashboards publishes live, shareable web dashboards from your spreadsheet data. Free plan available. Paid plans from $49/month flat, no per-user fees.


