Are you looking for a quick guide on how to connect LinkedIn ads to Excel? You’re in the right place.
LinkedIn Ads provides valuable insights into your B2B campaigns, but truly unleashing that data’s potential requires a more versatile tool – like Excel.
And let’s face it, getting that data into Excel can be a hassle. Manual exports are time-consuming and prone to errors. That’s where this guide comes in.
We’ll show you three methods to link your LinkedIn Ads data to Excel, so you can choose the one that works best for you.
Why Connect LinkedIn Ads to Excel?
Before we dive into the “how,” let’s talk about the “why.” Here are three key benefits of analyzing your LinkedIn Ads data in Excel:
- Customized Reporting: With Excel, you’re in control. Create reports tailored to your exact needs, with the metrics and visuals that matter most to you and your stakeholders.
- Historical Analysis: Excel can handle vast amounts of data, so you can combine current and historical performance data to uncover trends and patterns that inform smarter strategies.
- Advanced Calculations: Excel’s functions let you manipulate data in ways LinkedIn’s native analytics can’t. Perform complex calculations, segment your data, and gain deeper insights.
How to Connect LinkedIn Ads to Excel: 3 Methods
Method 1| Coefficient: No-Code, Fully Automated
Coefficient is the fastest, easiest way to export LinkedIn Ads data to Excel for technical and non-technical users alike.
Coefficient’s no-code interface makes it easy for anyone to safely get the data they need into their Connected Spreadsheet in a few clicks. This is particularly useful for Excel for Web users who do not have access to Power Query.
To install Coefficient, open Excel from your desktop or in Office Online.
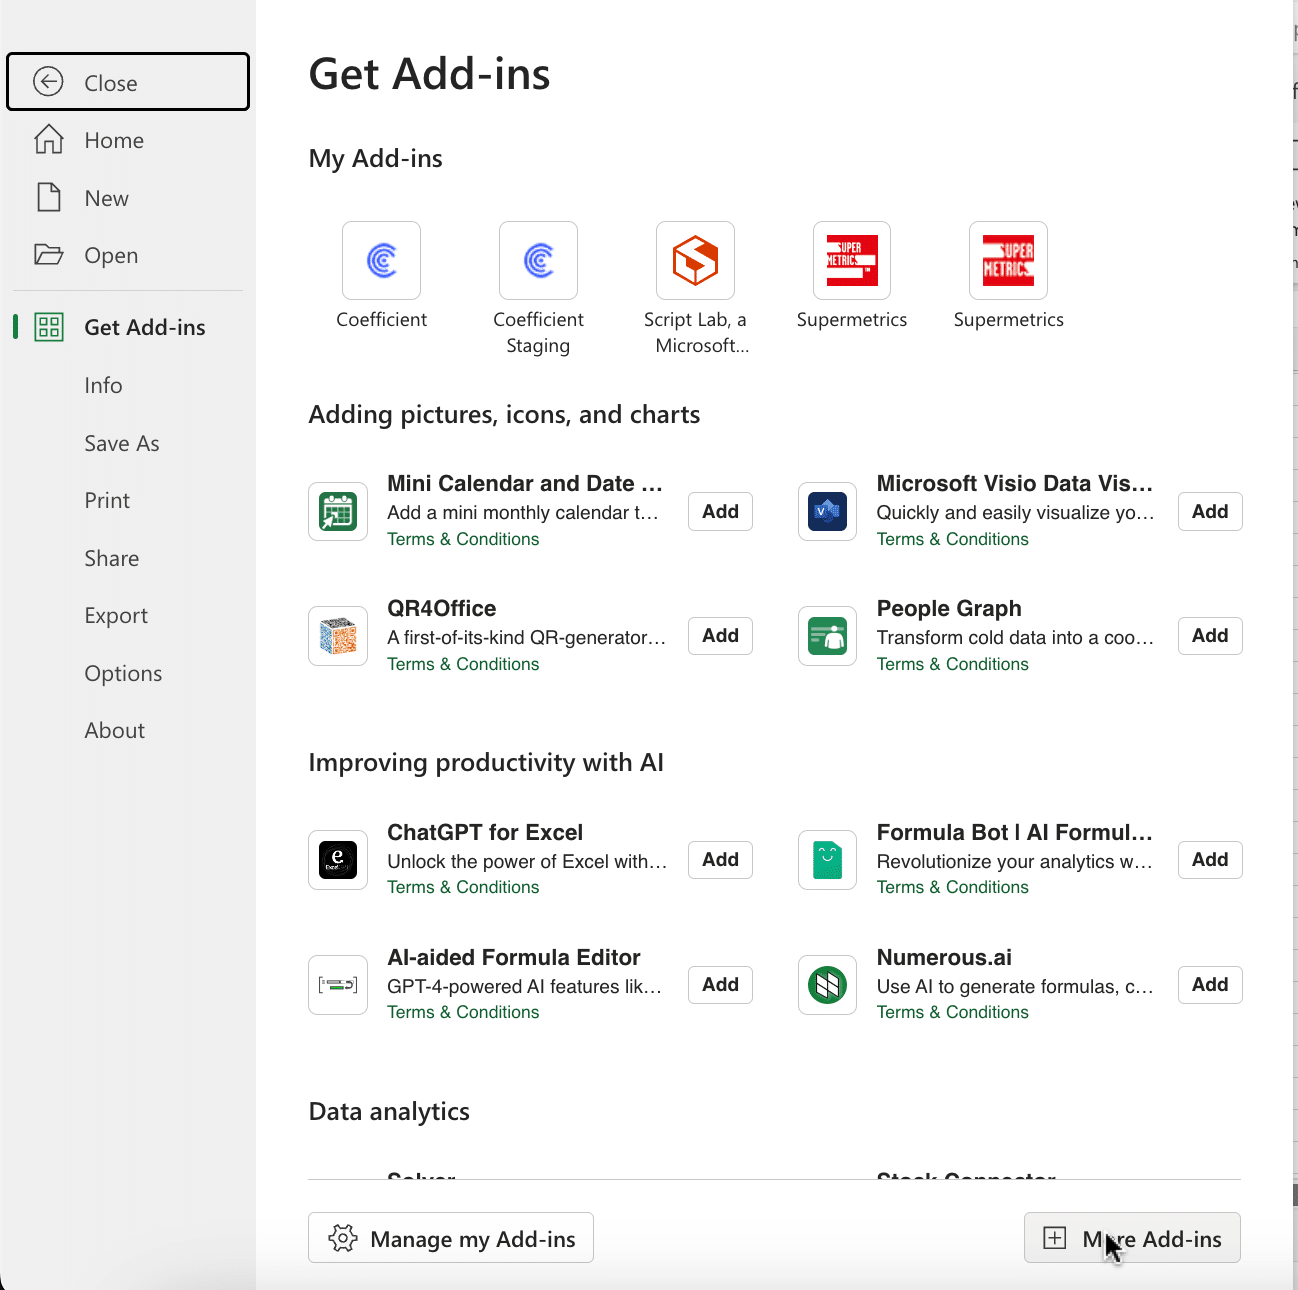
Click ‘File’ > ‘Get Add-ins’ > ‘More Add-Ins.’
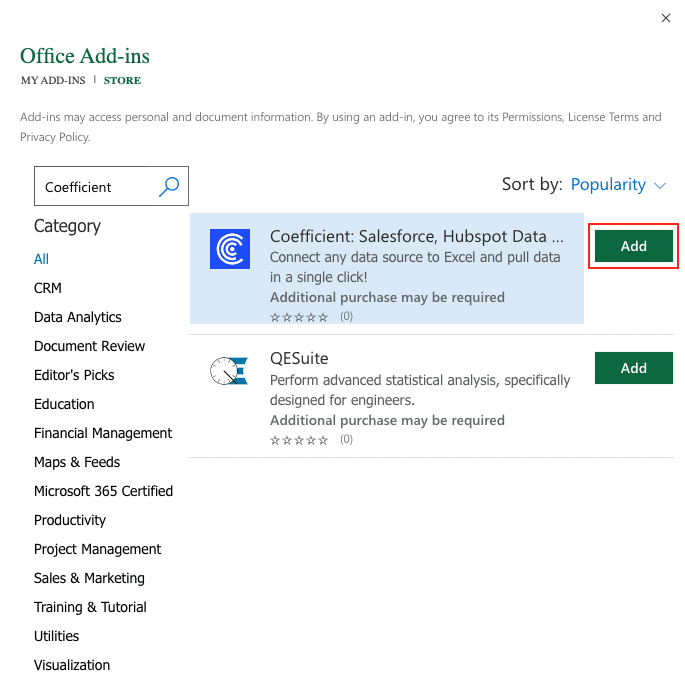
Type “Coefficient” in the search bar and click ‘Add.’
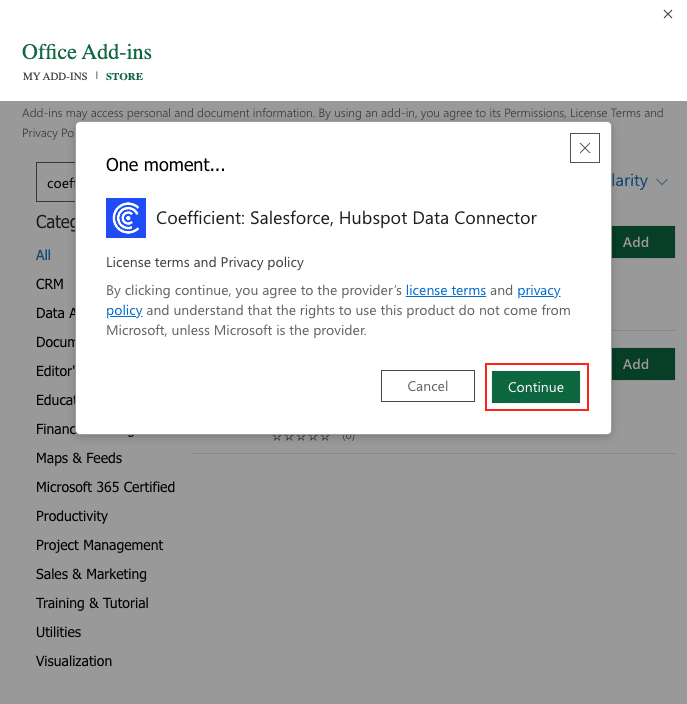
A pop-up will open up. Follow the prompts to complete the installation.
Once finished, you will see a “Coefficient” tab at the top navigation bar.
Click ‘Open Sidebar’ to launch Coefficient.
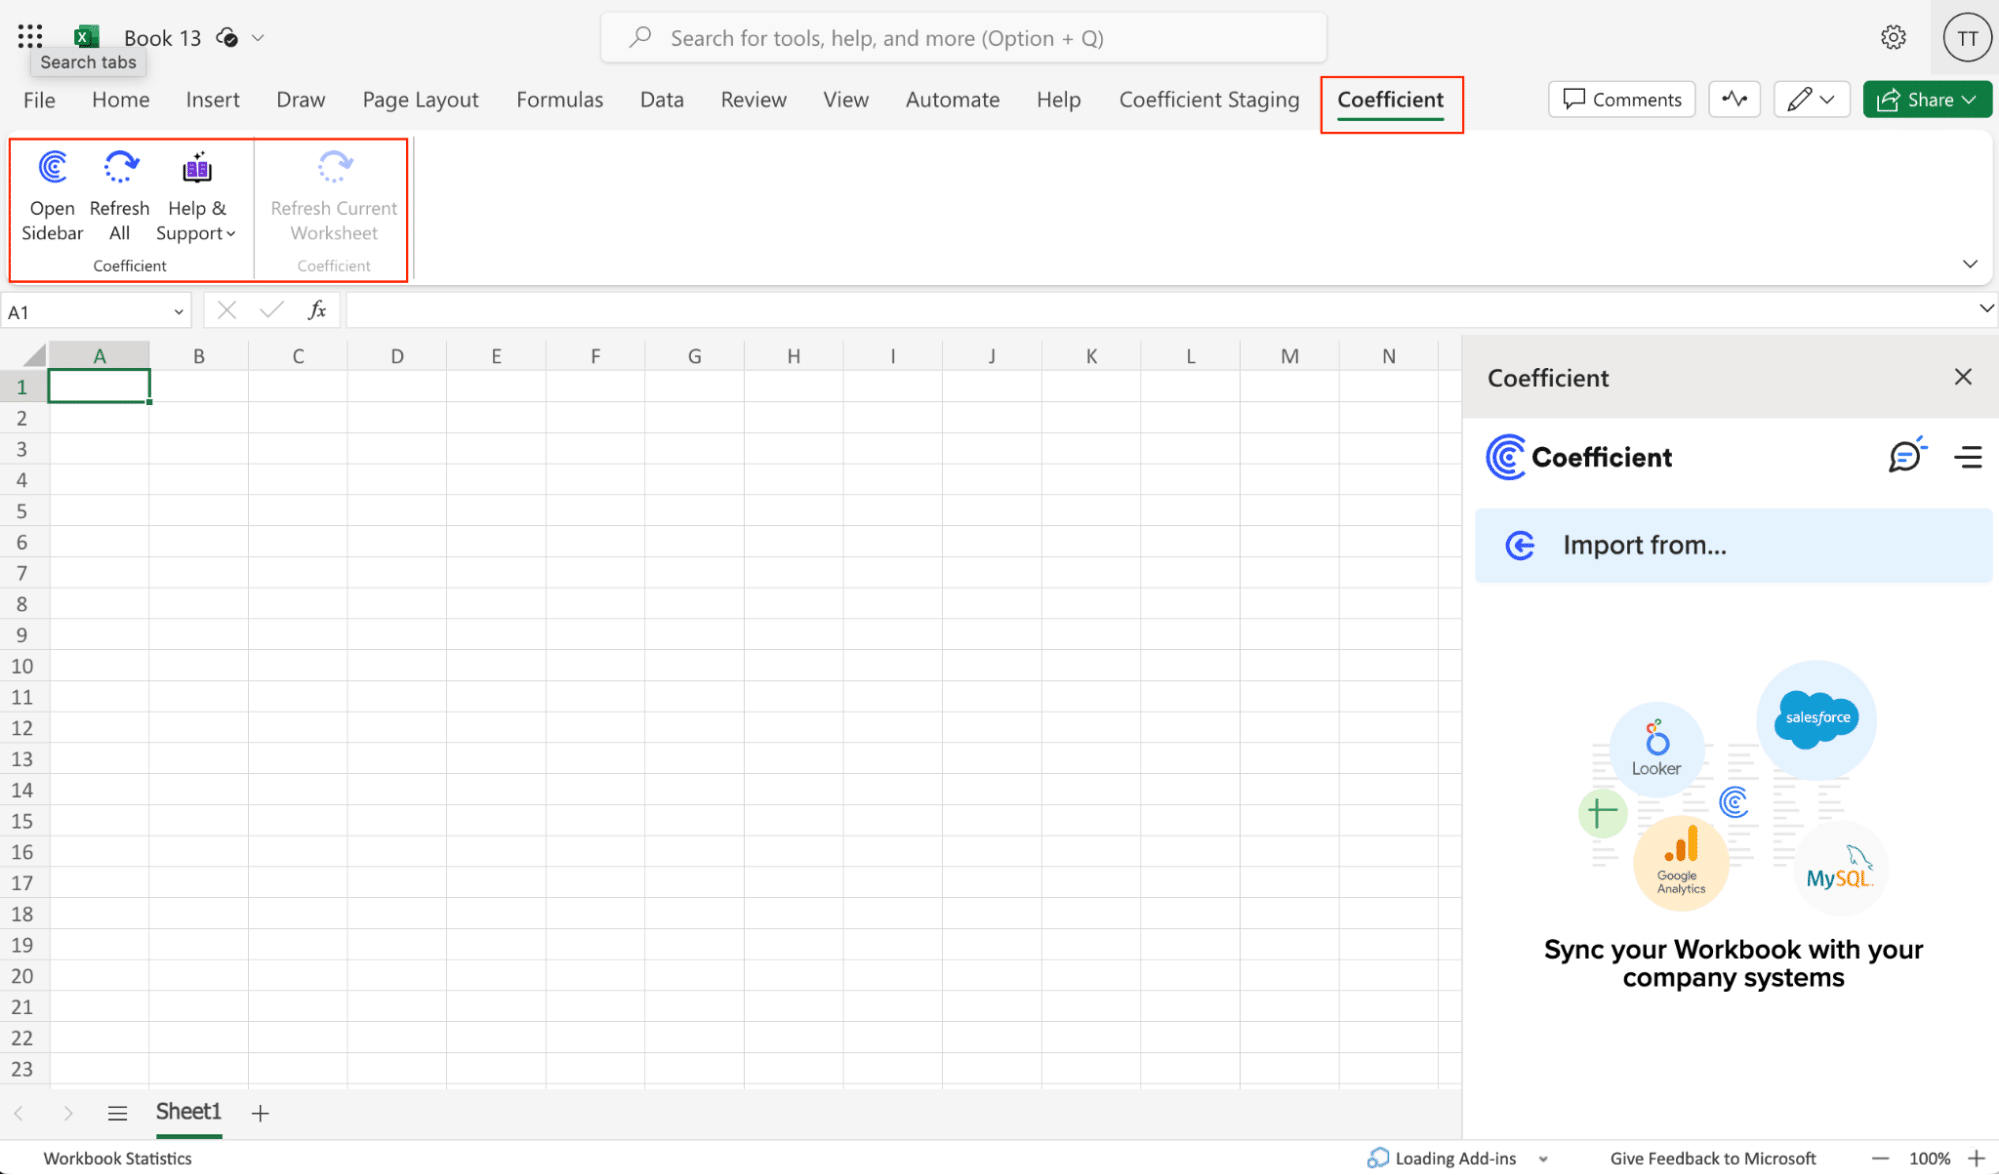
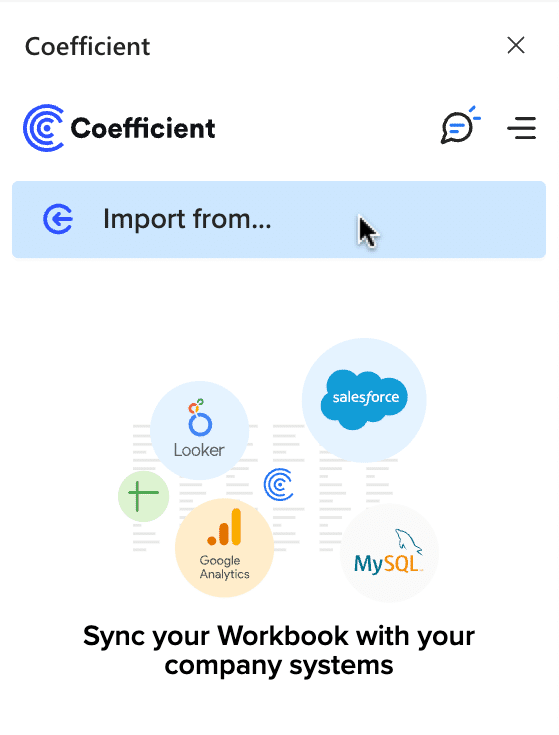
Select ‘Import from…’
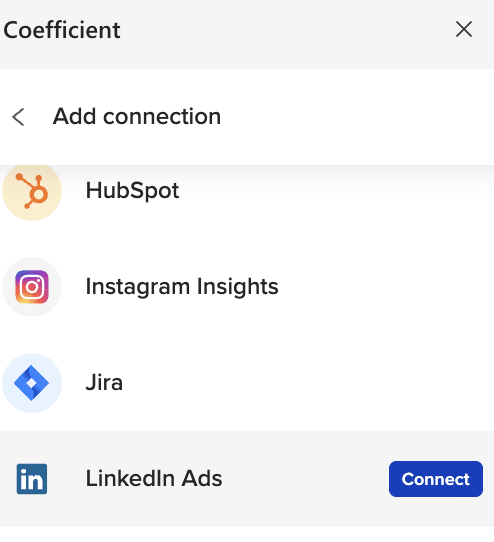
Scroll down until you find LinkedIn Ads and click ‘Connect.’
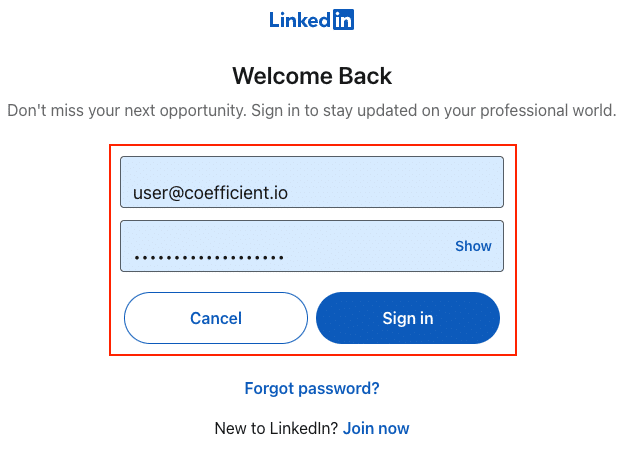
Follow the prompts to authorize Coefficient to your LinkedIn Ads account.

Enter your LinkedIn Ads email and password. Click ‘Sign In’ to complete the authorization.
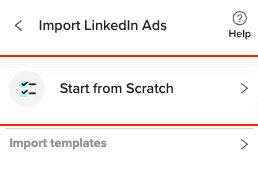
Return to LinkedIn Ads from the Coefficient menu ‘Import from…’ > ‘LinkedIn Ads’ > ‘Start from Scratch.’
Select the Metrics, Pivot, and Time Granularity needed for your import. Click inside the white box area for each section to search for the fields you need.
The data previewer shows a sample of the data from the fields you select.
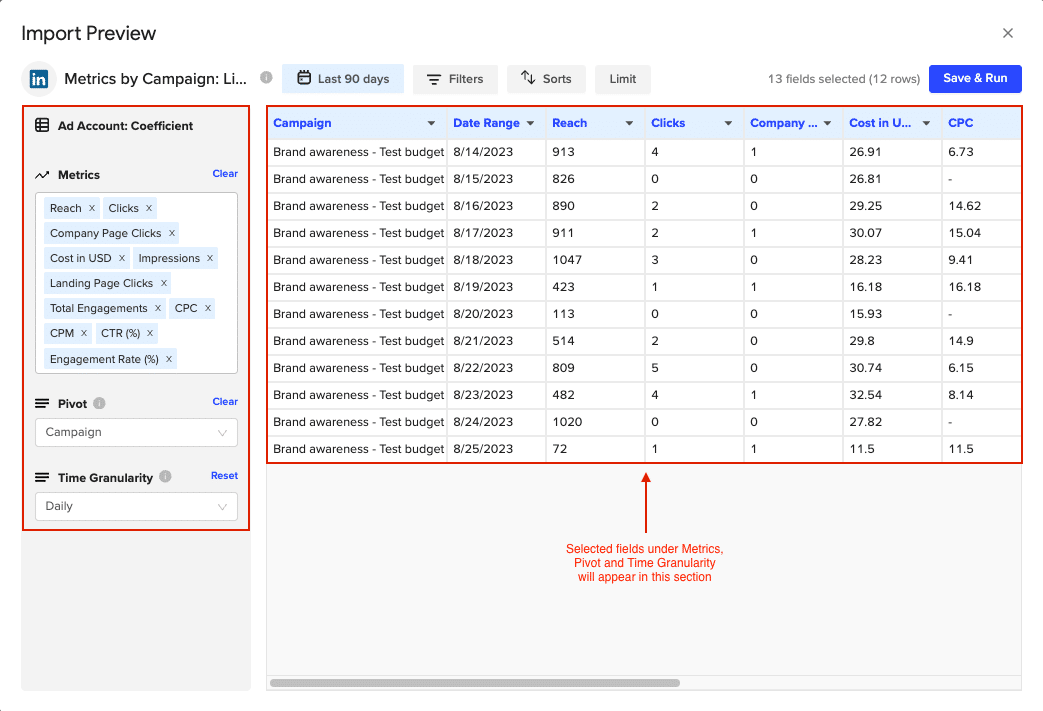
Customize your import by adding filters and/or row limits as needed.
Click the ‘Refresh Preview’ option to update the sample data based on the customizations that are added.
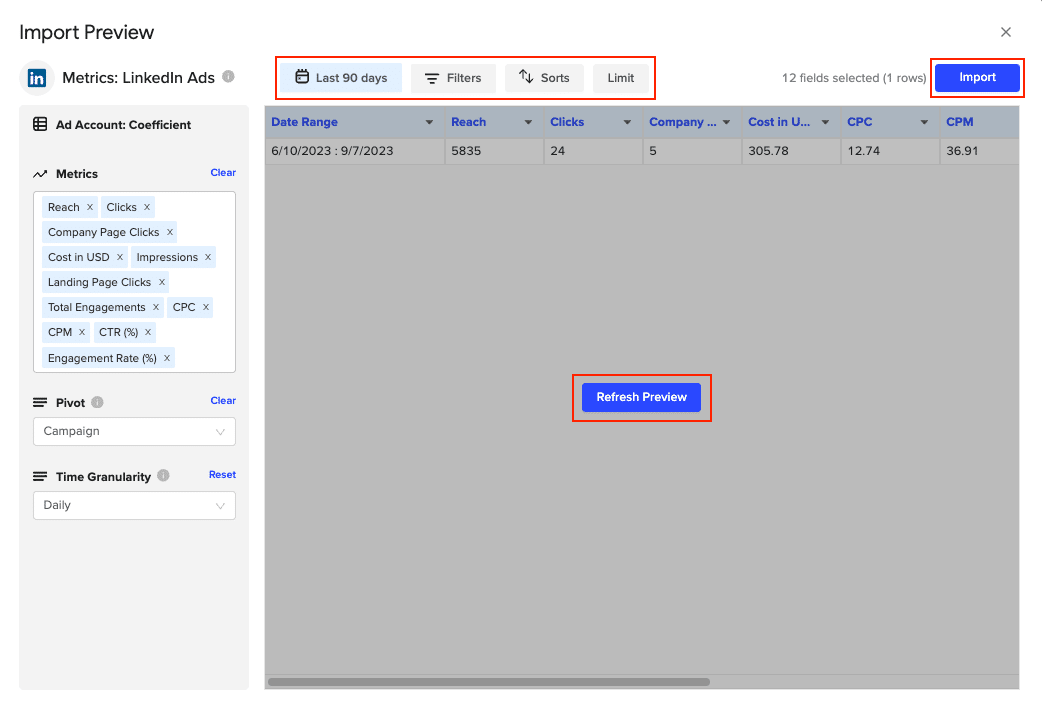
Click ‘Import’ to automatically export your LinkedIn Ads data to Excel.

You can also set up automatic data updates to schedule data syncs between LinkedIn Ads and Excel. Choose whether to run daily, hourly, or weekly automatic data updates.
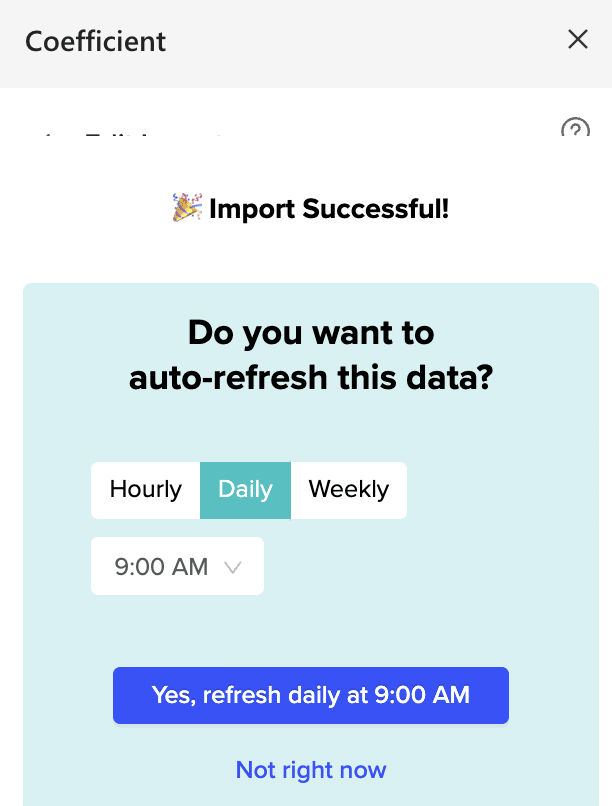
With automatic data updates, your LinkedIn Ads data is always up-to-date in your spreadsheet. That means you can build live dashboards and reports on top of the data without performing cumbersome manual updates.
Pros:
- Easy to use, even for non-technical users
- Quick setup and data access
- Automatic data refresh keeps reports current
Cons:
- Scheduled automations require a paid plan (but it’s affordable and worth it)
Method 2| Manual Export and Import
Log into LinkedIn and navigate to ‘Advertise’ in the top menu. Or, sign in to Campaign Manager directly.

Use the tabs at the top of the page to select the correct campaign groups, campaigns, or ads.

Stop exporting data manually. Sync data from your business systems into Google Sheets or Excel with Coefficient and set it on a refresh schedule.


Confirm the Time range at the top right of the page, and click the ‘Export’ button at the top of the page.

Select ‘Report Type’ and the time breakdown of your report (Daily, Monthly or All), and click ‘Export’ to download the report.
Pros:
- Ideal for one-time or infrequent analysis
Cons:
- Time-consuming and repetitive for regular reporting
- Manual updates needed for fresh data
- Risk of errors in data handling
Method 3| Zapier
Zapier Integration Zapier is a web-based service that allows you to create automated workflows between different apps, including LinkedIn Ads and Excel.
Here’s a step-by-step guide on how to set it up:
Log into your Zapier account. Click ‘+ Create’ > ‘New Zap.’

Choose LinkedIn Ads as your trigger app and select the event that will trigger the workflow (e.g., New Report)
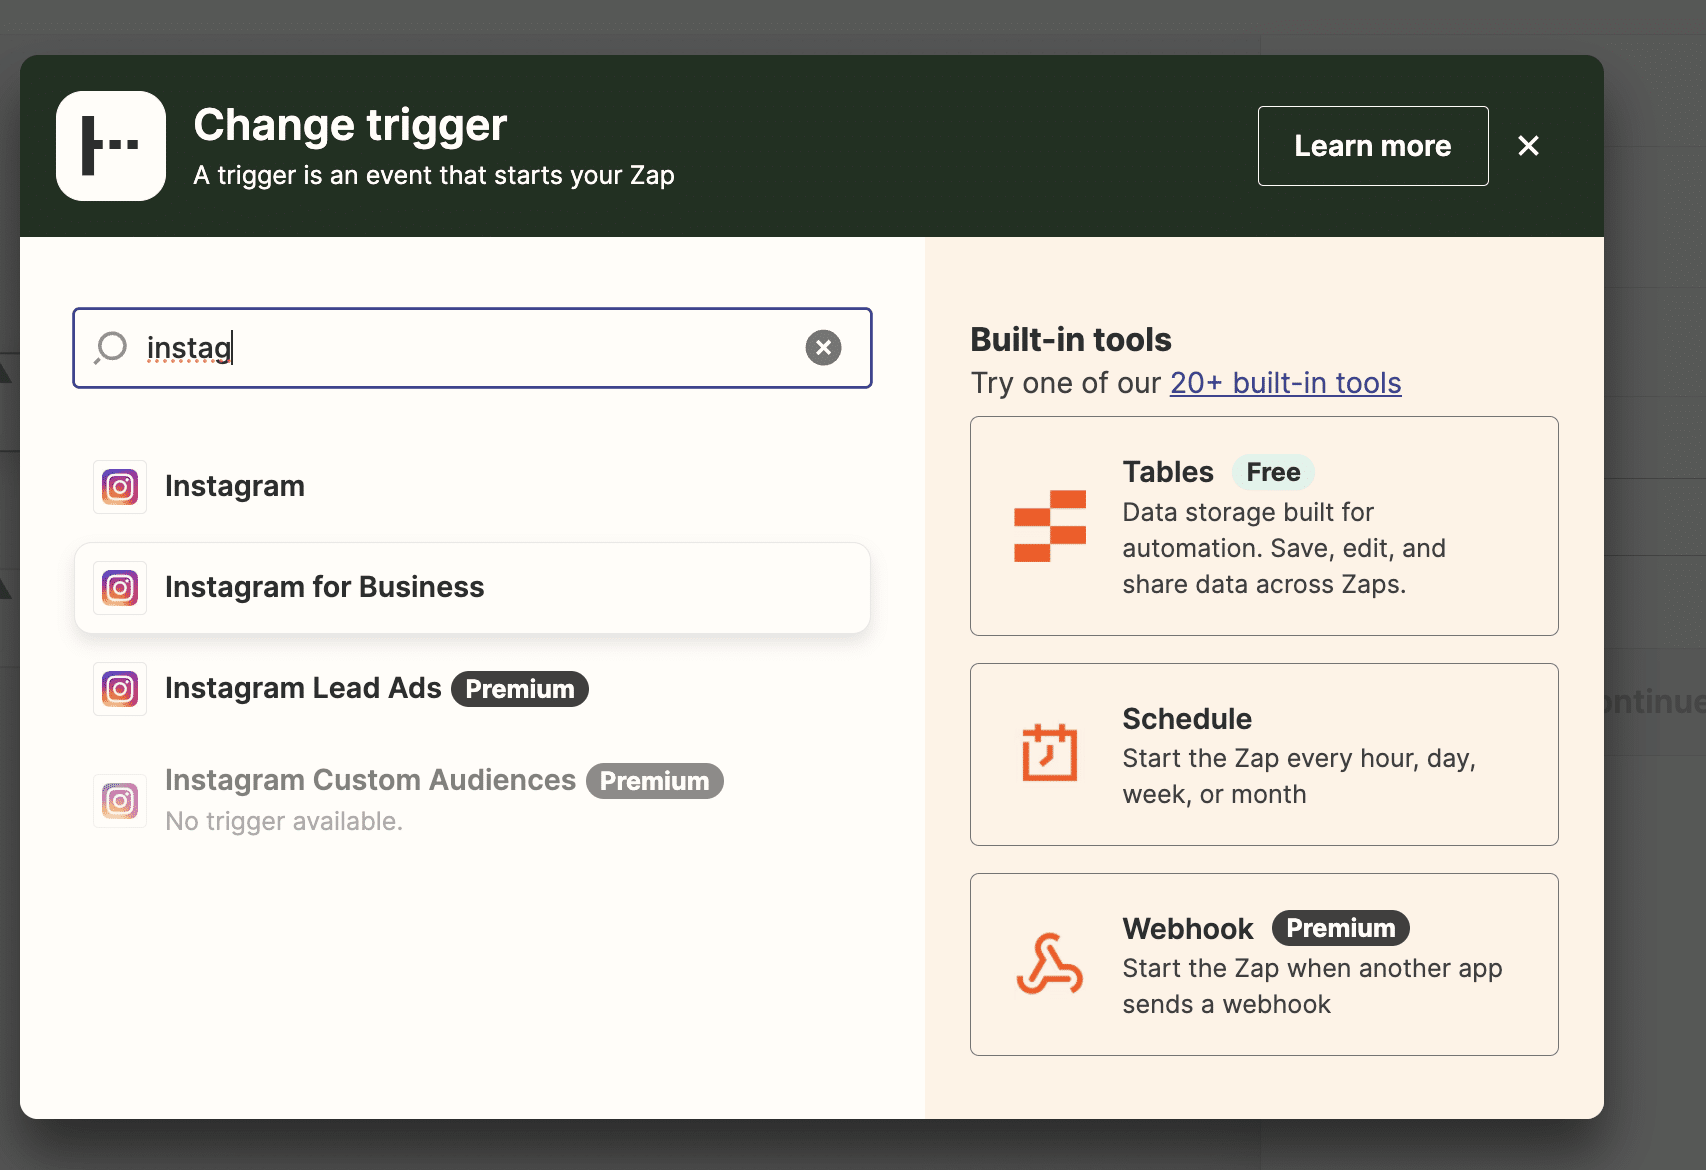
Choose LinkedIn Ads as your trigger app and select the event that will trigger the workflow (e.g., New Report). Follow the prompts to connect your LinkedIn Ads account to Zapier.
Connect your LinkedIn Ads account to Zapier by providing your API key, following the steps above.
Choose Microsoft Excel Online as your action app.
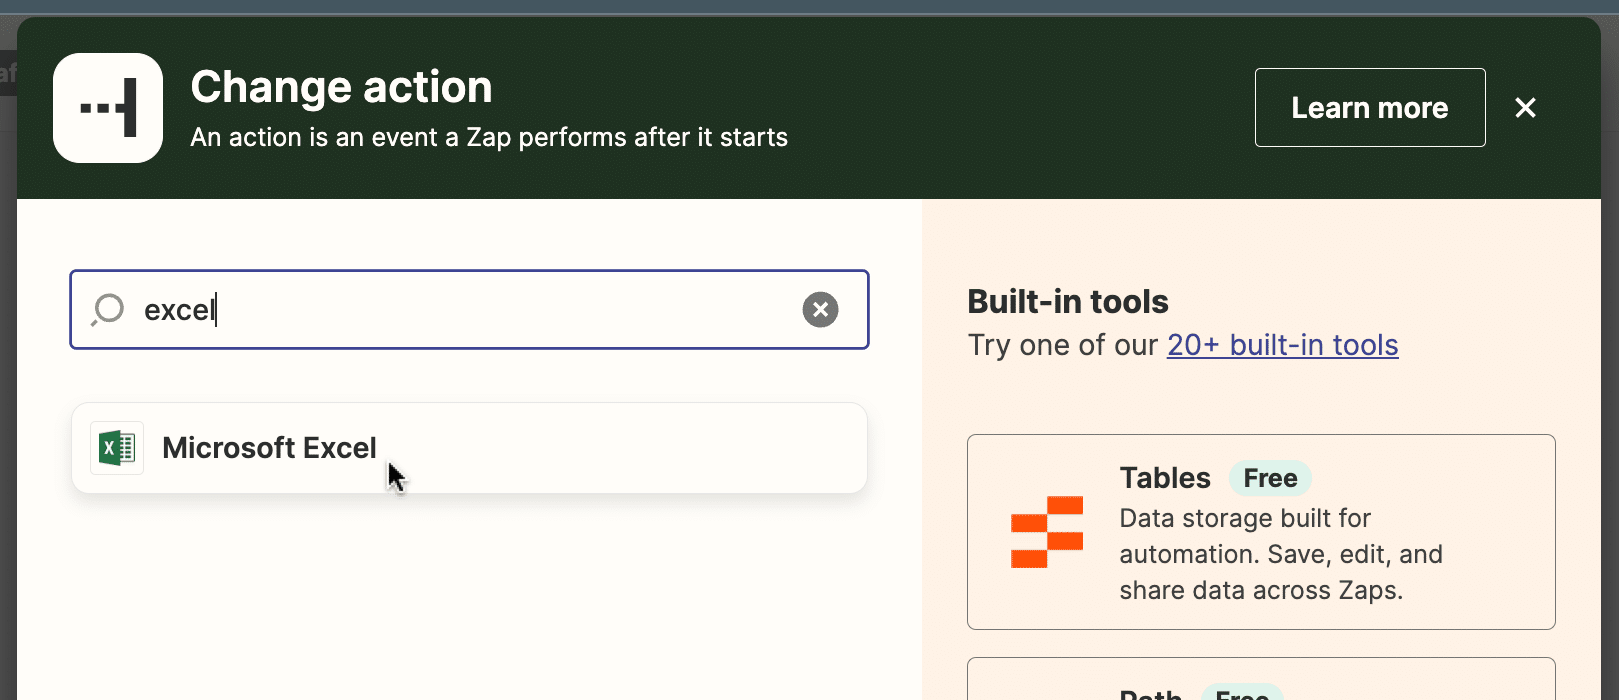
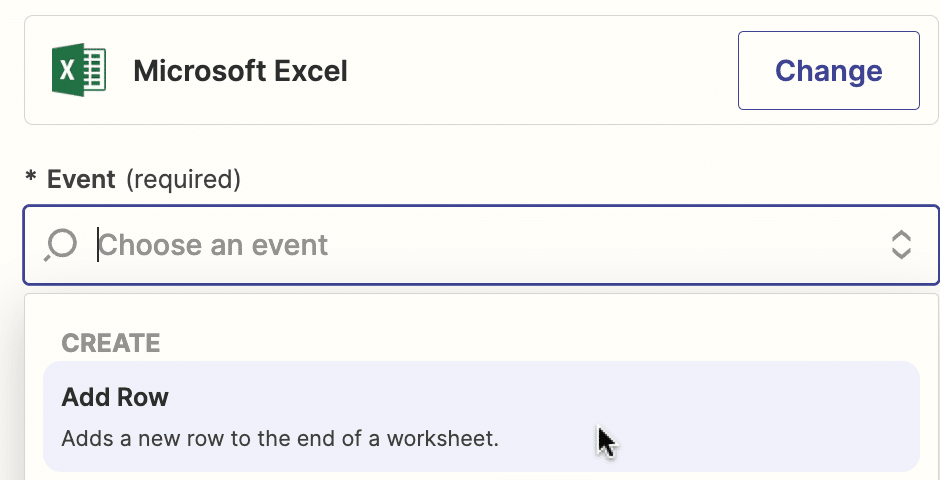
Select “Create Spreadsheet Row” as the action event.
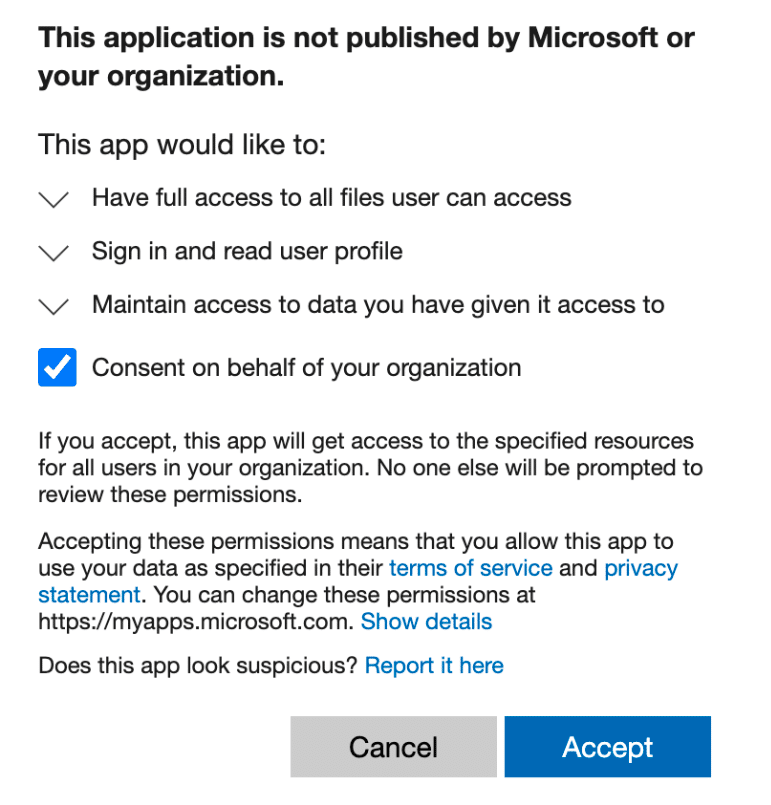
Follow the prompts to connect your Microsoft account.
From here:
- Map the data fields from LinkedIn Ads to the corresponding columns in your Excel spreadsheet.
- Test your Zap to ensure it’s working correctly.
- Turn on your Zap, and it will automatically add new Microsoft Ads data to your Excel spreadsheet as it comes in.
Pros:
- Automates data transfer between LinkedIn Ads and Excel
- No coding skills needed
- Customizable trigger options (daily, weekly, monthly)
Cons:
- Advanced features and high-volume tasks require a paid Zapier plan
- Less flexibility in customization compared to other methods
- Reliant on Zapier’s platform performance and stability
Connect LinkedIn Ads Data to Excel Today
Don’t let data silos hold you back. Start connecting your LinkedIn Ads data to Excel today and unlock the full potential of your campaigns. Your future self (and your boss) will thank you.
Ready to get started?
Visit Coefficient’s website to learn more and begin your free trial. Your LinkedIn Ads data is waiting.


