Most data questions in a business do not get answered. Not because the data does not exist, but because getting to it requires SQL skills, a data team, a ticket, and a wait. By the time the answer arrives, the decision has already been made on gut instinct.
Vibe analytics is the shift that changes that equation. It is an approach to data analysis where decision makers engage directly with data through AI-powered conversation, asking questions in plain English and getting answers from live data in minutes rather than days.
MIT Sloan formally defined vibe analytics in February 2026 as “an approach to data analysis that lets decision makers engage directly with data through AI-powered conversation.” This post covers what it is, how it works, what it requires to work well, and how to tell a genuine implementation from a fast wrong answer dressed up as an insight.
Where Vibe Analytics Came From
The concept borrows its name from vibe coding, a term Andrej Karpathy coined in early 2025 to describe directing AI with intent rather than explicit instructions. Data practitioners noticed the same dynamic applied to analysis: instead of writing SQL and configuring charts, you describe what you want to know and let the AI handle the mechanics. The practice spread through data communities across 2025 before MIT Sloan gave it a formal definition in February 2026.
The scale argument for why this matters comes from Dan Hockenmaier’s July 2025 essay: there are roughly 5 million people in the US using data to answer business questions every day, compared to about 2 million software engineers. Vibe analytics has a larger addressable population than vibe coding. That is why the enterprise data industry is paying attention.
What Vibe Analytics Actually Is
Vibe analytics is not a product category. It is a practice. It describes a way of working with data where the interface is conversation and the output is an insight, a chart, a model or a dashboard, generated from live data without the analyst writing a query.
The core shift is who does the mechanical work. In traditional analytics, a business user with a question routes it to a data analyst, who writes SQL, configures a visualization and returns an answer one to five days later. In a vibe analytics workflow, the business user asks the question directly. The AI translates it into a query, runs it against live data, and returns the output. The analyst, if involved, is reviewing and interpreting rather than wrangling.
What makes it vibe rather than just AI-assisted is the conversational, iterative nature of the interaction. You do not submit a form. You ask a question, get an answer, ask a follow-up, refine the filter, change the time period. The analysis develops through dialogue rather than a one-shot request.
| Vibe analytics lowers the floor for who can get an answer from data. It does not lower the bar for evaluating whether that answer is right. |
How Vibe Analytics Works
The mechanics follow a consistent loop regardless of the tool:
- Connect to a live data source. The system queries current data, not a cached export. This is the non-negotiable foundation. AI running analysis on a stale CSV is not vibe analytics. It is fast pattern-matching on old information.
- Ask a question in plain English. No SQL, no field mapping, no chart configuration. “Show me win rate by deal size for Q1 versus Q2, Enterprise segment only.” The intent is the input.
- The AI generates and runs the query. The system translates the question into a structured query, runs it against the live data source, and returns a result: a chart, a table, a summary or a calculated metric.
- Review and iterate. This is where the human stays in the loop. You evaluate the output, check it against what you know, and ask the follow-up. “What changed in Q2?” The system pulls activity and stage data and surfaces the pattern. The analysis develops through the conversation.
- Publish or act. If the output is useful to others, share it as a live dashboard via URL rather than a static export. The dashboard stays current as data refreshes. Nobody rebuilds it next week.
The human’s role in this loop is sense-maker, not data-puller. The AI handles the mechanics. The analyst handles the judgment: deciding what to ask, evaluating what comes back, and determining what to do with it.
What Vibe Analytics Is Not
There are four things worth being clear about before anyone builds a workflow around this practice.
- Not a replacement for data governance. Vibe analytics requires governed definitions to produce trustworthy outputs. If “revenue” means different things in Salesforce, HubSpot and your data warehouse, the AI surfaces the inconsistency rather than resolving it. Definitions are a human responsibility. The AI consumes them, it does not create them.
- Not always accurate. AI-generated analysis can be confidently wrong. The review step in the workflow above is not optional. Outputs need to be evaluated before they inform decisions. Vibe analytics lowers the effort to get an answer. It raises the responsibility to sanity-check it.
- Not a BI tool replacement. Traditional BI tools handle enterprise-scale reporting with governance, schema management, access controls and auditing. Vibe analytics handles speed and self-service. The two complement each other rather than replacing each other.
- Not one-off AI chat with a CSV. Pasting a spreadsheet into a generic AI chatbot and asking questions is not vibe analytics. It is session-based, not connected to live data, and produces no persistent output. A genuine vibe analytics workflow connects to a live data source and produces results that update as the data does.
Vibe Analytics Use Cases by Team
The practice applies across every function that uses data to make decisions. The common thread is recurring questions that currently require an analyst or a ticket to answer.
RevOps teams use vibe analytics for win rate analysis by segment, rep and quarter. Pipeline velocity modeling. Attribution analysis across marketing and sales touchpoints. Questions that used to take a two-day analyst build now take an afternoon without SQL. The pipeline review runs on answers, not exports.
Finance teams use it for monthly close variance analysis: “What drove the difference between forecast and actuals in operating expenses?” Budget versus actuals comparisons across departments. Cash flow trend analysis with drill-down into specific line items. The same governed data the data team built into the warehouse, accessible without a data team intermediary.
Marketing ops teams use it for channel performance comparisons across periods, MQL-to-SQL conversion rate analysis and ad spend efficiency by audience segment. Campaign decisions that previously waited for a weekly report now happen the same day the data is available. The question determines the timing, not the report schedule.
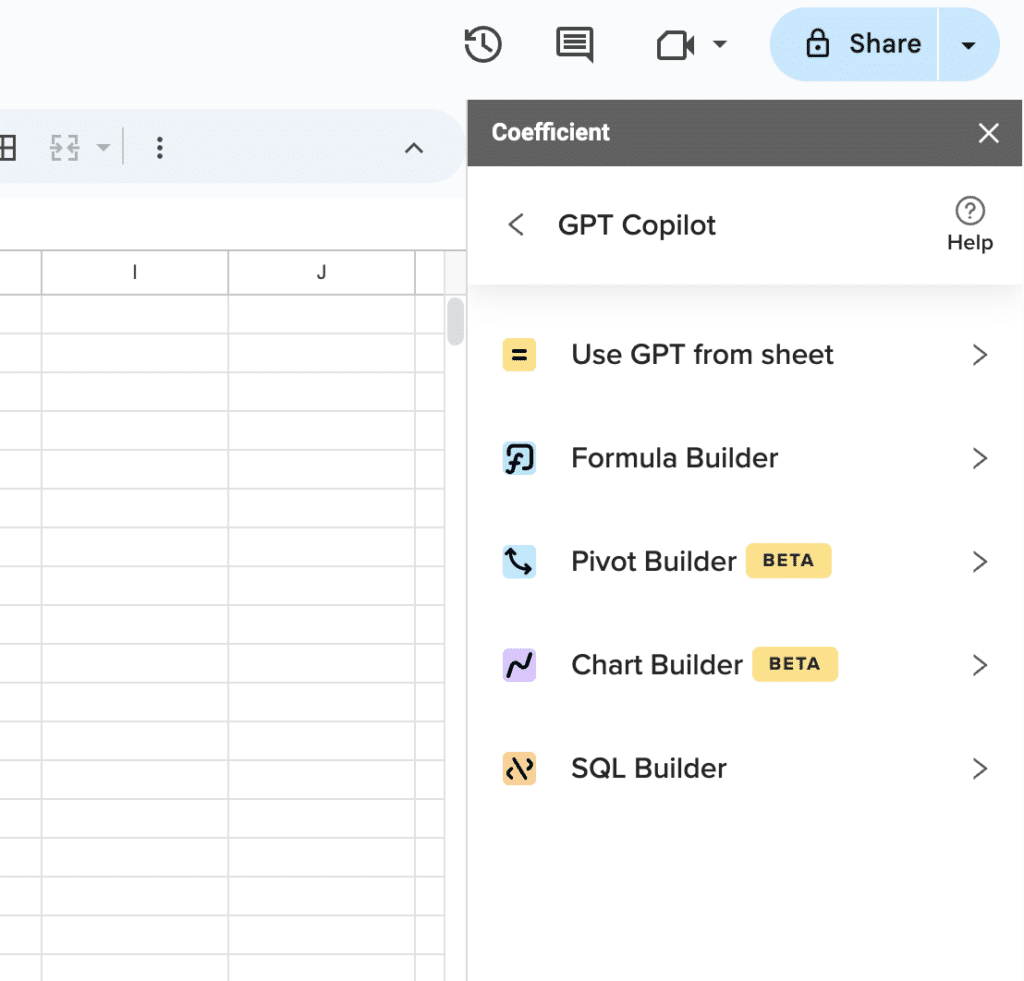
Supercharge your spreadsheets with GPT-powered AI tools for building formulas, charts, pivots, SQL and more. Simple prompts for automatic generation.

Data teams use vibe analytics to cut the grunt work out of exploratory data analysis. Writing initial queries to narrow down a dataset, generating first-draft visualizations, reducing the volume of self-service requests that otherwise land as support tickets. The data team stops being a reporting bottleneck and spends more time on the work that actually requires their expertise.
What Good Vibe Analytics Looks Like in Practice
Not every tool that claims to support vibe analytics delivers on the practice. Four markers distinguish a well-implemented workflow from a demo that falls apart on real data.
- Live data, not cached: Queries run against current data every time. Not a snapshot refreshed once a day at 3am. The dashboard someone opens at 9am reflects what happened through end of business the day before, at minimum.
- Traceable outputs: The user can see what query the AI ran and on what dataset. Outputs that cannot be traced back to a query are outputs that cannot be trusted.
- Iterative by design: The workflow supports follow-up questions, filter refinements and time period changes without starting over. One-shot generation is a prototype. Iterative conversation is a workflow.
- Governed definitions at the source: The metrics the AI uses are defined at the data source, not inferred from field names. Tools that surface governed semantic layers, like Snowflake Semantic Views, give the AI governed definitions to query rather than raw field names to guess at.
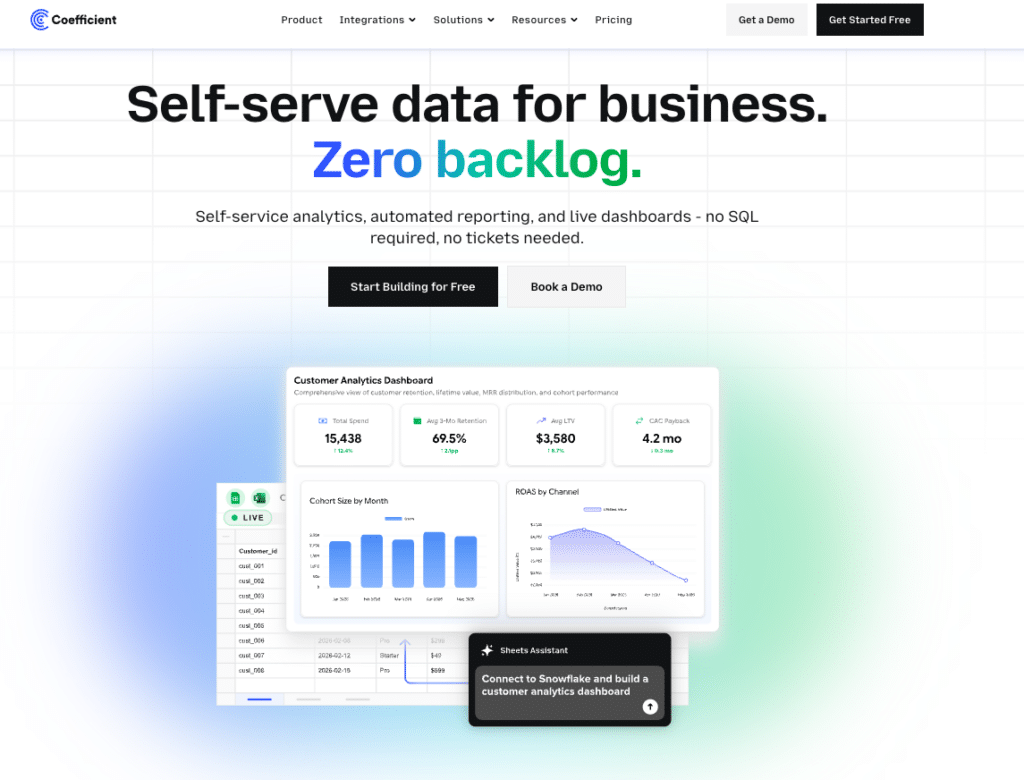
Coefficient’s Live Web Dashboards are built on this foundation. Live data from 150+ source systems flows into Google Sheets or Excel via scheduled auto-refresh. The AI chat layer builds BI-quality web dashboards from that live data in plain English. For teams connected to Snowflake, Coefficient surfaces Semantic Views directly, so the AI is querying governed metric definitions rather than raw column names. The governance the data team built into the warehouse flows through to the dashboard the business user creates in minutes.
Klaviyo applied this at scale. Their BI team extended live Snowflake data to 50+ business users across finance, marketing and RevOps without requiring SQL or BI tool licenses. Evan Cover, Director of BI Engineering and Governance: “We had to move fast, iterate, and ensure data from Snowflake was accessible for non-technical users.” Reports that previously took months to build were running in days. The governance held. The access expanded.
How to Get Started with Vibe Analytics
The path in is simpler than it sounds. Most teams overcomplicate the start by trying to instrument everything at once.
- Start with your data foundation. Connect your primary data sources to a live layer: CRM, ERP, data warehouse, ad platforms. Without live, governed data, vibe analytics produces fast but wrong answers. This step is non-negotiable.
- Pick one high-frequency question. Choose something your team asks every week: win rate by segment, CAC by channel, budget versus actuals for the current month. One question with a clear dataset. Not a dashboard covering everything.
- Ask it in plain English. Use an AI interface connected to that live data source. Review the output. Check the numbers against what you know. Validate the query logic if the tool exposes it.
- Iterate. Ask the follow-up. Refine the filter. Change the time period. This is where the value compounds. The speed of iteration is the point, not just the first answer.
- Publish. If the output is useful to others, share it as a live dashboard link rather than a static export. The dashboard stays current. Nobody rebuilds it next week.
Coefficient is free to get started. Connect your first data source and run your first vibe analytics query in minutes. Pre-built dashboard templates cover the most common operational reporting use cases so you are not starting from a blank sheet.
The Bottom Line
Vibe analytics is not a hype cycle. It is a practical shift in who can get answers from data and how fast. The technology exists. The tools exist. What most teams are still missing is the live data foundation that makes the AI outputs trustworthy rather than just fast.
Build that foundation first. The conversational interface on top of it is the easy part.
Not a standalone BI platform. Works inside Google Sheets and Excel. Try Coefficient free.