The common advice is that spreadsheets are the data silo. Move to a BI tool, migrate to a data warehouse, stop living in Excel. That advice misses the actual problem.
Spreadsheets are not the problem. Disconnected spreadsheets are. When a sheet is manually updated from a CSV export once a week by one analyst who is the only person who knows how it works, yes, that is a silo. But when that same sheet pulls live data from your CRM, your ERP and your marketing platform on an automated schedule that anyone on the team can access, it becomes something else entirely: the unified view that every BI tool promises and rarely delivers, built inside software your team already knows how to use.
This guide covers how to get there. Four steps to turn a disconnected spreadsheet into a real-time, multi-source data hub, without replacing the tools your team runs on.
What Actually Turns a Spreadsheet into a Data Silo
Not all spreadsheets are silos. The ones that are share four specific behaviors.
Manual exports on a schedule
Someone downloads a report from Salesforce or HubSpot, pastes it into a sheet and sends it around. The moment that file leaves the source system, it starts aging. By the time anyone acts on it, the data is hours or days behind reality.
One person owns the refresh
The analyst who built the model is the only one who knows how to update it. When they are out, the data goes stale. When they leave the company, the model becomes a black box no one trusts.
No path back to the source
Data flows one way: out of the system and into the sheet. When someone makes a correction in the spreadsheet, that change never makes it back to Salesforce or HubSpot or NetSuite. The source system and the sheet drift apart from the first edit.
Everyone has their own version
The RevOps team has their pipeline model. Finance has theirs. Sales leadership has a third. Each version uses slightly different filters, different cutoff dates, different definitions. No one is working from the same truth.
None of these are properties of spreadsheets as a format. They are properties of how disconnected spreadsheets get used. Fix the connection pattern and the silo disappears.
Step 1: Map Every Manual Export Your Team Runs
Before you can break a silo, you have to know where it is. Start by auditing every recurring data export your team produces each week. Every CSV download is a silo in the making.
For a typical RevOps team of three people, that audit usually turns up something like this:
Monday morning: someone downloads the Salesforce pipeline report and pastes it into the forecast model.
Tuesday: someone else exports HubSpot contacts to cross-reference against open opportunities.
Thursday: the weekly QuickBooks revenue export lands in the finance sheet, manually matched against the CRM data.
That is three separate exports, three frozen copies of three live systems, stitched together by hand every week. Each one a point of failure. Each one a source of version drift.
Write down every export your team runs, which system it comes from, who owns it and how often it gets refreshed. That list is your silo map. Each item on it is a connection to automate.
Derek Gregg, who manages revenue data across Salesforce, HubSpot and Looker, describes what the other side of this looks like:
“Coefficient lets me immediately pull data from multiple resources and manipulate it in a familiar spreadsheet. I’m using it for forecasting, sales comp reporting, pipeline management, sales planning, and so much more.”
— Derek Gregg, Salesforce AppExchange
That is not a different tool. That is the same spreadsheet, connected to live sources instead of frozen exports.
Step 2: Replace Each Export with a Live Connector
A live connector does something a CSV export cannot: it keeps the spreadsheet and the source system in sync automatically. When the data changes in Salesforce, the sheet updates. When a new deal closes in HubSpot, the sheet reflects it. No one has to remember to export. No one has to paste anything.
Here is how replacing one export works in practice.
You open Coefficient inside Google Sheets or Excel, select your data source: Salesforce, HubSpot, QuickBooks, NetSuite, Snowflake or any of the 150+ connected systems, and choose the objects or reports you want to import. You pick the fields, apply any filters you need and set a refresh schedule: hourly, daily or weekly. Coefficient pulls the data directly into the sheet. From that point on, it stays current on the schedule you set.
The first import takes a few minutes. Every refresh after that is automatic.
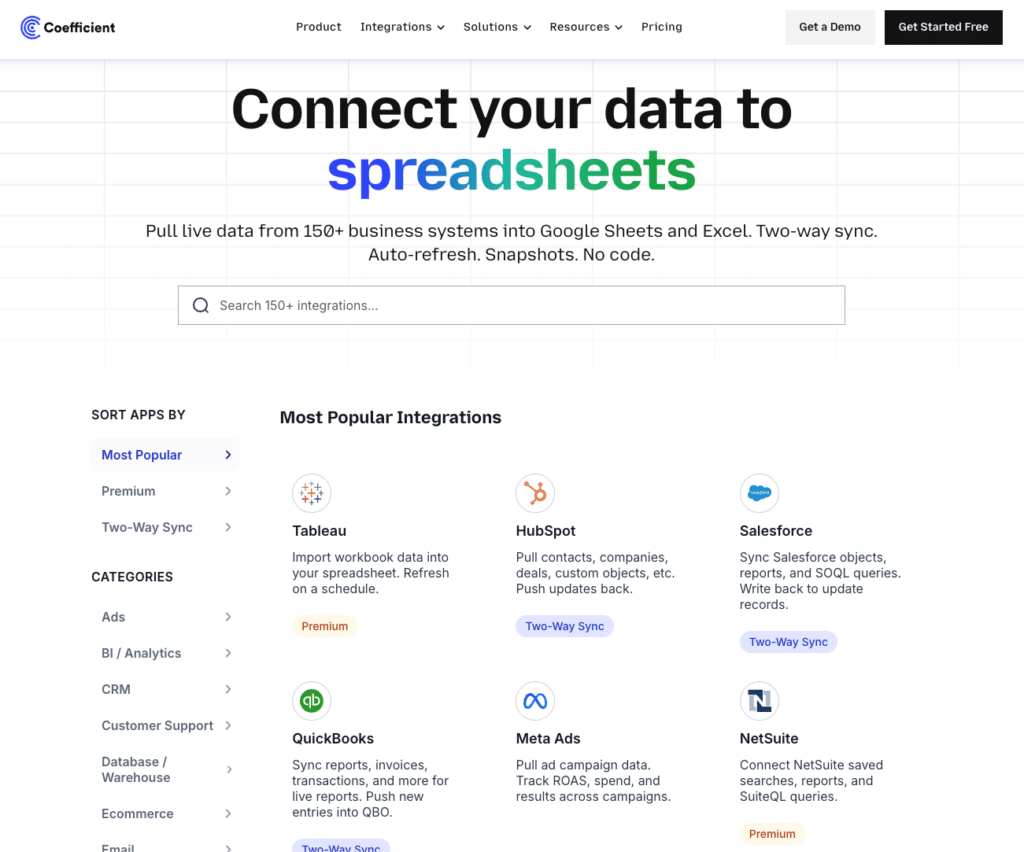
Coefficient starts free. Paid plans start at $49 per month with no per-user fees, which means your whole team can access the same live data without adding to the bill every time someone new needs a connection.
Vanessa van Straten, who manages dashboards pulling from Jira, Salesforce and MySQL, put it simply:
“I was constantly having to pull data manually from different sources and then compile it all myself. Now I just need to plug in a data source, and it pulls everything automatically on a customisable schedule.”
— Vanessa van Straten, Whizz Education — Microsoft AppSource
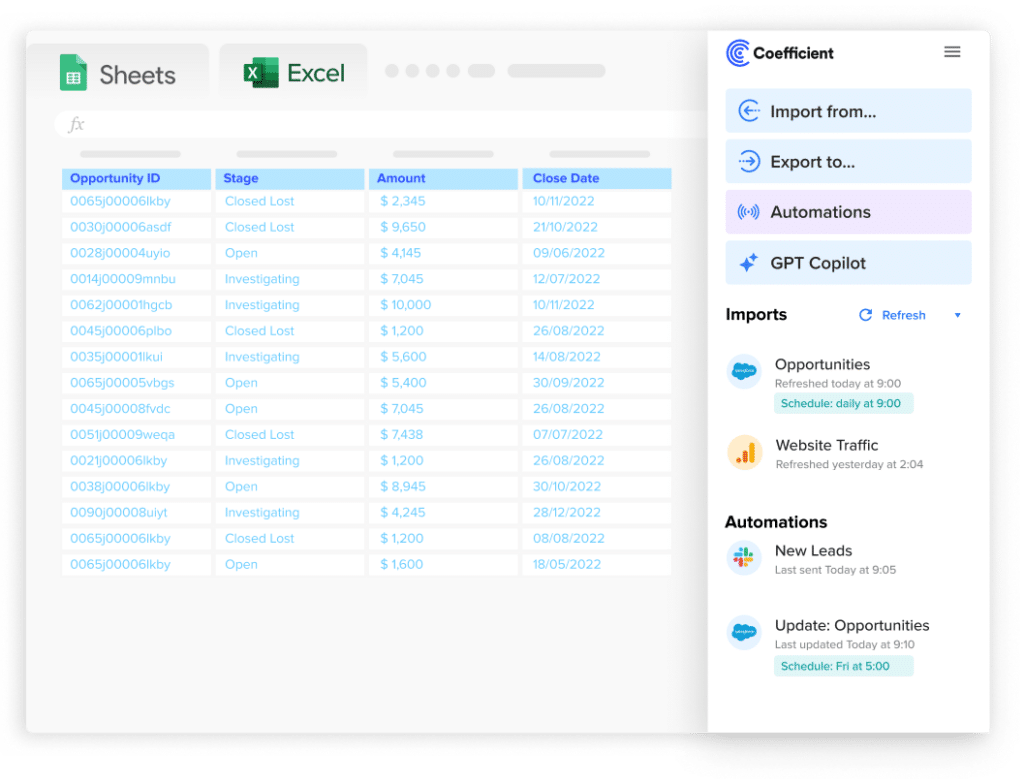
Stop exporting data manually. Sync data from your business systems into Google Sheets or Excel with Coefficient and set it on a refresh schedule.
Get Started
That shift, from manual compilation to automatic pulls, is what breaks the export habit at the root.
Step 3: Pull Every System into One Spreadsheet
Connecting one system is a start. It is not enough. Breaking data silos means connecting all the systems your team depends on, not just the easiest one.
The structure that works for most teams is straightforward. Each data source gets its own tab. Salesforce opportunities in one tab, HubSpot leads in another, QuickBooks invoices in a third. Then a fourth tab, the one everyone actually uses, pulls from all three using standard spreadsheet formulas. That tab becomes the unified view.
Because each import refreshes on its own schedule, the unified tab stays current without anyone touching it. The RevOps lead opens it Monday morning and the pipeline, lead volume and revenue data are already updated. No exports. No stitching. No version debate.
The same structure scales. A marketing team might connect Google Ads, HubSpot and Salesforce. A finance team might connect NetSuite, QuickBooks and Stripe. The pattern is the same: one tab per source, one summary tab that reads across all of them.
The result is not a dashboard you have to log into a separate tool to see. It is a live spreadsheet that your team already knows how to use, updated automatically, accessible to everyone who needs it.
Step 4: Enable Two-Way Sync so the Sheet Is Not a Dead End
A spreadsheet that only reads from source systems is better than a CSV export, but it still has one of the same problems: changes made in the sheet go nowhere. When someone corrects a deal stage, updates a contact field or adjusts a budget line, that change has to be manually re-entered in the source system. The sheet and the system drift apart from the first edit.
Two-way sync closes that gap. Coefficient’s write-back capability lets teams push changes from the spreadsheet directly back to Salesforce, HubSpot, QuickBooks, Snowflake and other connected systems. Make the change in the sheet, export it back to the source. The system of record stays current. The spreadsheet stops being a read-only view and becomes a working interface.
For RevOps teams doing bulk Salesforce updates, this replaces the entire export-edit-reimport cycle. For finance teams reconciling QuickBooks data, it means corrections flow back without manual re-entry. The spreadsheet becomes the place where work actually happens, not just where data gets reported.
Kristin Battaglini, who uses Coefficient across her team’s data and alerting workflows, captures what this feels like when it all comes together:
“Coefficient has helped me amplify the impact of my team and our data by enabling me to automate alerts to our Slack workspace. I love that Coefficient is simple, intuitive, and does not require developer capacity to implement. Of all the countless third party tools I use in my day to day work, Coefficient is by far my favorite.”
— Kristin Battaglini, Clayful Health
Simple, intuitive, no developer needed. That is the standard a connected spreadsheet should meet.
The Spreadsheet Was Never the Problem
Breaking down data silos with spreadsheets comes down to four steps: map every manual export, replace each one with a live connector, pull all your sources into one sheet, and enable two-way sync so changes flow back to the source.
None of this requires a new analytics platform, a data engineering team or anyone learning a new tool. It requires connecting the spreadsheets your team already uses to the systems they already depend on, and letting the automation handle the rest.
Coefficient is not a standalone BI platform and requires Google Sheets or Excel as the working environment. For teams who already live in spreadsheets, that is the point.
Start breaking down your data silos today: coefficient.io/get-started