

Choose and organize your data by determining what information you want to display and organizing it in a logical way
Input your data directly into cells, organizing it in rows and columns to mimic a table structure
Create headers by using the first row for column headers, making them stand out with bold text and different background colors
Format your table by adjusting column width, row height, font size and style for better readability
Apply visual enhancements using cell background colors to highlight important data and adding borders to define your table structure clearly
One of the most basic and useful features of Google Sheets is the ability to create tables. Tables are an easy and effective way to organize data, making it easier to read and analyze.
Creating a table in Google Sheets is a straightforward process that can be done in just a few steps.
This guide will walk you through step-by-step.
Understanding Google Sheets
Google Sheets is a powerful cloud-based spreadsheet software that allows users to create, edit and share spreadsheets online. It is a free tool provided by Google and can be accessed through any web browser.
Google Sheets offers a wide range of features like:
- Real-time collaboration: Google Sheets allows multiple users to work on a single spreadsheet simultaneously. Users can see changes made by others in real-time, making collaboration more efficient.
- Automatic saving: Google Sheets automatically saves changes made to a spreadsheet, ensuring that no data is lost.
- Templates: Google Sheets provides a variety of templates that users can choose from to create spreadsheets quickly. These templates include budget planners, calendars, and project management tools.
- Add-ons: Google Sheets has a wide range of add-ons that users can install to extend its functionality. These add-ons include tools for data visualization, project management, and data analysis.
Creating a Table in Google Sheets
Unlike some spreadsheet applications, Google Sheets doesn’t have a specific ‘Table’ feature. However, you can easily organize your data into a table-like structure. Here’s how:
Choosing Your Data
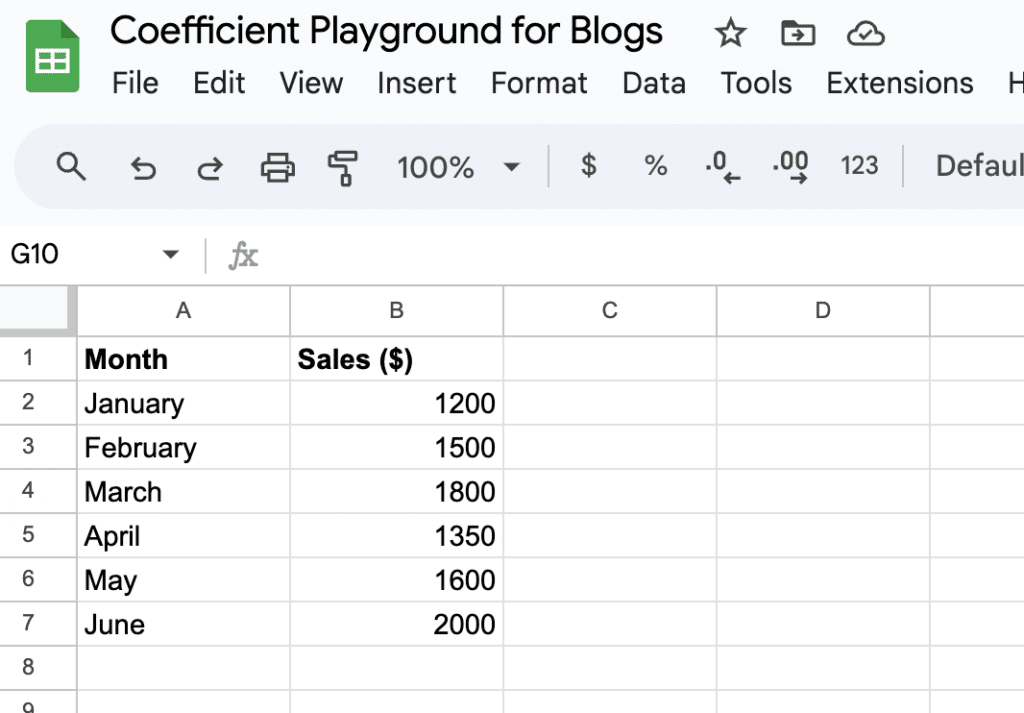
Before creating a table in Google Sheets, it’s important to choose the data you want to include. Determine what information you want to display in your table and organize it in a logical way.
Entering Data
Input your data directly into the cells of your Google Sheet. Organize your data in rows and columns to mimic a table structure.
To create a table in Google Sheets, users can follow a few simple steps. First, they need to enter the data they want to include in the table. Next, they can select the data and click on the “Insert” menu and choose “Table.” They can then customize the table by selecting the number of rows and columns, adding headers, and formatting the data.
Pro tip: If you’re pulling data from another system and copy-pasting or manually importing your data, you can 10x the speed of your data workflows with free data connectors, using a Google Sheets extension like Coefficient.
Coefficient offers data connectors for CRMs like Salesforce and HubSpot, marketing analytics platforms like GA4, Google Search Console and ads platforms, databases/data warehouses like Snowflake and PostgreSQL, and many more.
Once you import your data with Coefficient, you’ll have the option to keep your data on a refresh schedule so you’re tables are always live.
Inserting the Table [Updated May 2024]
Once you have your data organized, you can insert a table in Google Sheets.

Supercharge your spreadsheets with GPT-powered AI tools for building formulas, charts, pivots, SQL and more. Simple prompts for automatic generation.

To do this, click on the “+” button in the bottom left corner of the screen and select “Google Sheets” from the drop-down menu.
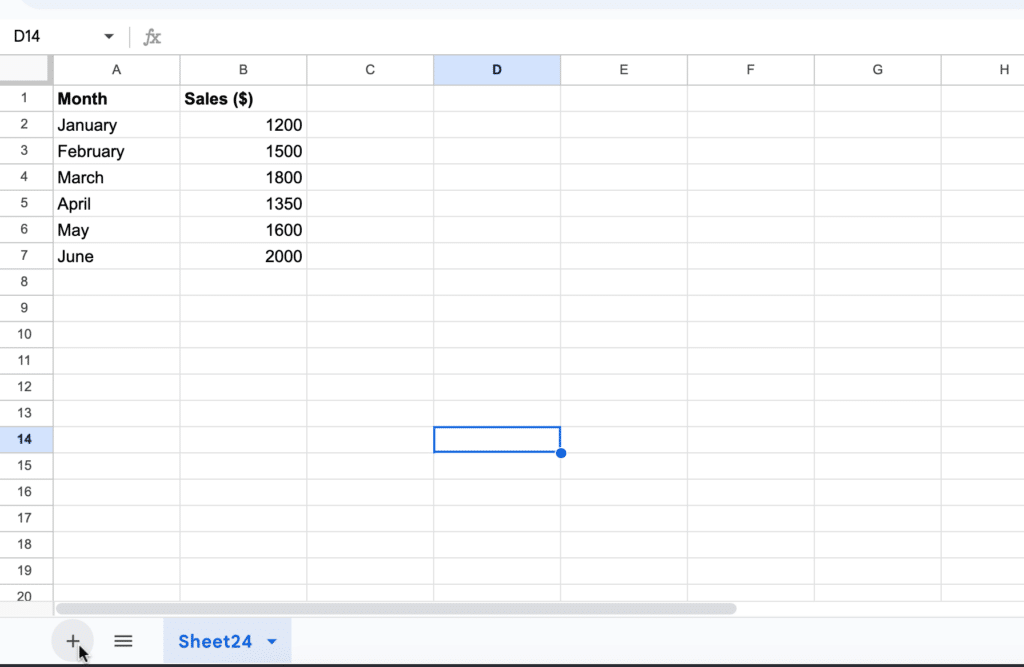
A new blank spreadsheet will open.
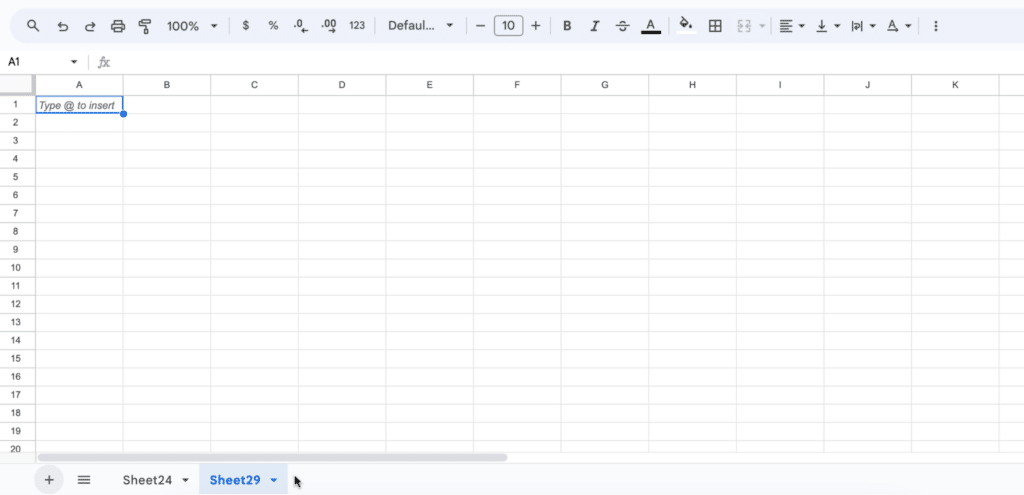
To insert a table, click on the “Insert” menu and select “Table.”
A pop-up window will appear where you can choose the number of rows and columns you want in your table. You can also choose whether to include headers and how to format your table.
Update – New way to create tables
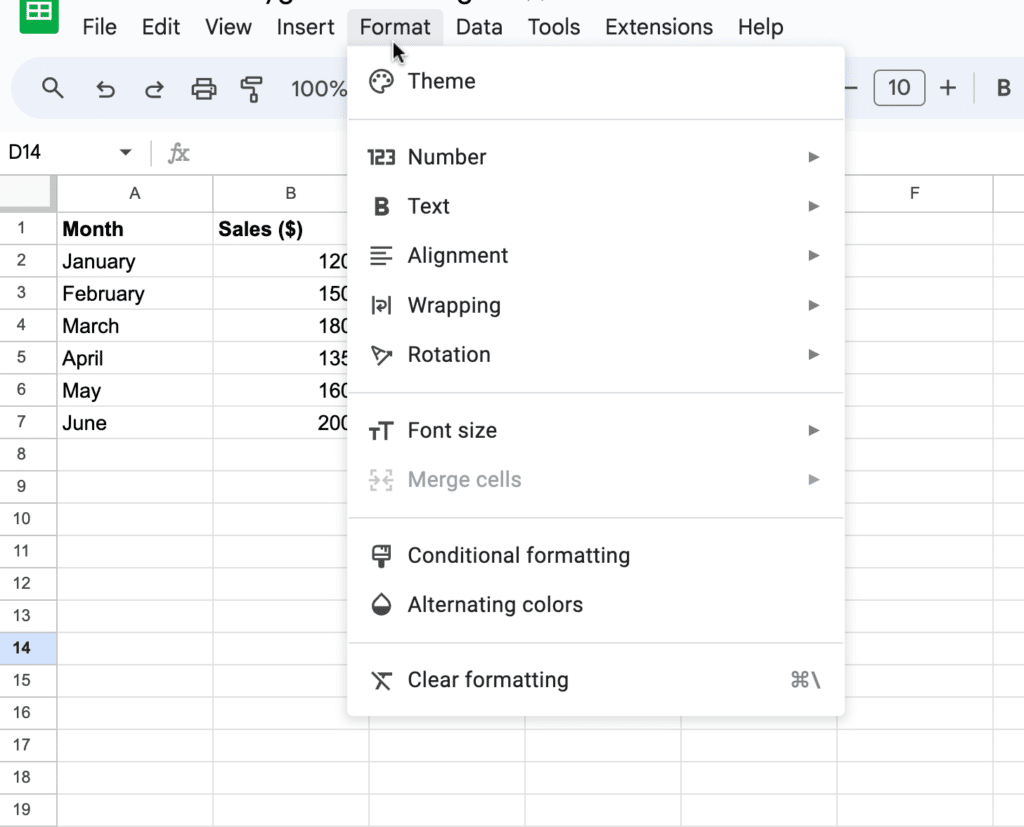
Starting May 2024, Google announced it has launched a new Tables feature which will allow you to create a table by just selecting the Format option in the Menu bar and choosing “Convert as Table”.
Disclaimer: This feature is expected to rollout completely by the end of June 2024.
Formatting the Table
After you have inserted your table into Google Sheets, you can format it to make it more visually appealing and easier to read. Here are some formatting options to consider:
- Headers: Use the first row as headers for your columns. You can make these stand out by bolding the text and using a different background color.
- Column Width and Row Height: Adjust these to ensure your data fits well and is easy to read.
- Font Size and Style: Choose a font that is clear and readable. Adjust the size for better visibility.
- Cell Background Color: Use colors to highlight important data or to differentiate between rows for better readability.
- Borders: Adding borders to cells can help define your table’s structure more clearly.
Advanced Formatting Options
Explore the “Format” menu for more advanced options like text alignment, number formatting, and conditional formatting to further customize your table.
By following these steps, you can create a table in Google Sheets that is organized, visually appealing, and easy to read.
Conclusion
By following these steps, you can effectively organize and present your data in a table-like format using Google Sheets. This approach enhances the visual appeal and readability of your data, making it easier to analyze and share.
Looking to level up your business data analysis game? Consider Coefficient.


