

Open your Google Slides presentation and click on the pie chart to select it
Click “Edit chart” to open the linked Google Sheets spreadsheet where the chart data is stored
Make changes to the data in the spreadsheet – update values, modify labels, or adjust the chart title
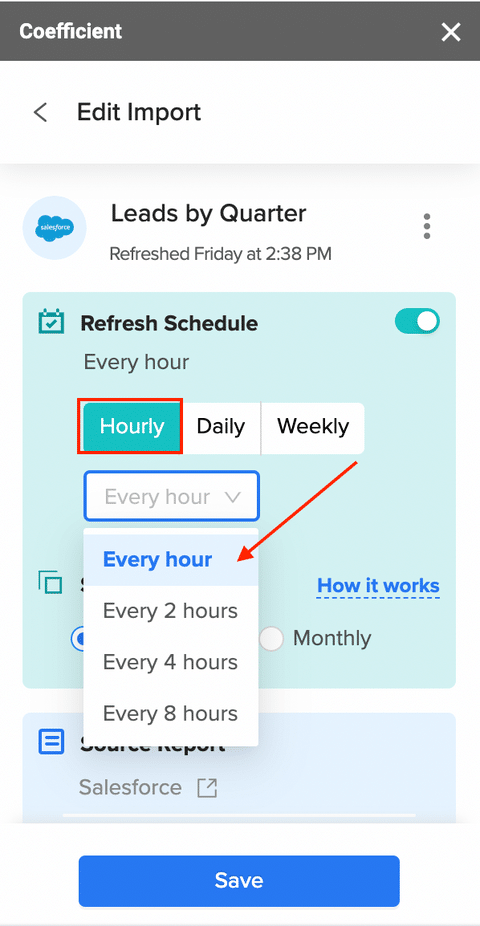
Set up automatic data refresh using Coefficient to keep your pie chart updated with live data on a schedule (hourly, daily, or weekly)
Return to Google Slides and your chart will automatically update to reflect the changes made in the spreadsheet
Pie charts are a great way to visualize data in Google Slides presentations, but editing and keeping them up-to-date can be time-consuming.
In this blog post, you’ll learn how to easily edit pie charts in Google Slides and keep them refreshed with live data using Coefficient.
Why Use Pie Charts in Google Slides?
Before diving into the editing process, let’s explore why pie charts are an excellent choice for presenting data in Google Slides:
- Visual Appeal: Pie charts are visually engaging and can make your data more attractive and memorable to your audience.
- Easy to Understand: The circular nature of pie charts makes it easy for viewers to understand the proportions and relationships between different categories or segments.
- Quick Comparisons: Pie charts allow for quick comparisons between various data points, enabling your audience to grasp the key insights at a glance.
- Storytelling: By highlighting specific slices or using colors strategically, you can use pie charts to tell a compelling story with your data.
Step-by-Step Guide: How to Edit a Pie Chart in Google Slides
Now that you understand the benefits of using pie charts in your presentations, let’s walk through the process of editing them in Google Slides.
Step 1: Open the Google Slides Presentation
Begin by opening the Google Slides presentation that contains the pie chart you want to edit.
If you haven’t created a pie chart yet, you can do so by clicking “Insert” > “Chart” and selecting the pie chart option.
Step 2: Select the Pie Chart
Click on the pie chart to select it. You’ll see a blue border appear around the chart, indicating that it’s ready for editing.
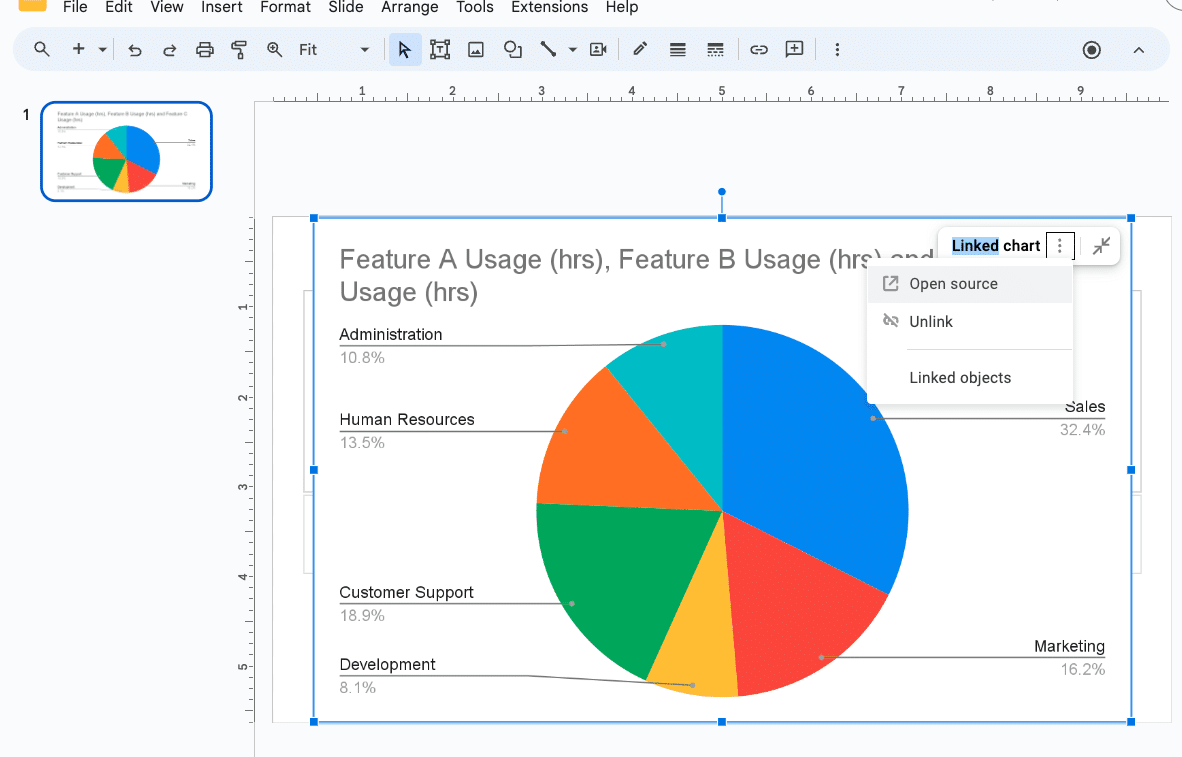
Step 3: Access the Chart Editor
With the pie chart selected, click on the “Edit chart” option that appears. This will open the linked Google Sheets spreadsheet where the chart data is stored.
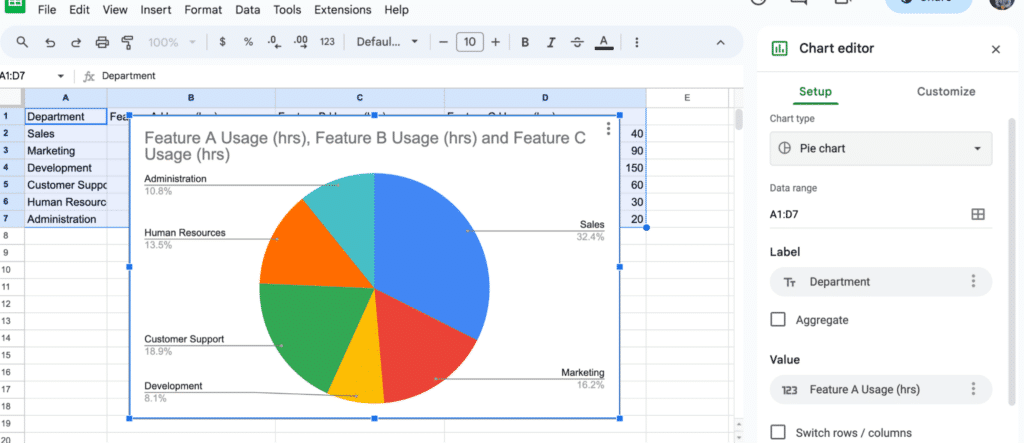
Step 4: Modify the Chart Data
In the Google Sheets spreadsheet, you can make various changes to the data that powers your pie chart. Here are some common modifications:
- Update Values: Change the numerical values in the spreadsheet cells to reflect the latest data.
- Add or Remove Data Points: Insert or delete rows to add or remove slices from your pie chart.
- Modify Labels: Edit the text in the label column to change the names of the categories or segments.
- Adjust Chart Title: Update the chart title to accurately reflect the data being presented.
Keeping Your Pie Chart Refreshed with Live Data Using Coefficient
Manually updating your pie chart data can be a hassle. That’s where Coefficient comes in to help you:
- Connect your data sources directly to the Google Sheets spreadsheet linked to your pie chart
- Set up automatic data refresh schedules (hourly, daily, or weekly)
- Ensure your embedded pie chart in Google Slides always displays the most current data
Here’s how to keep your pie chart refreshed with live data using Coefficient:
Install the Coefficient and connect to a data source like Salesforce, for example. Import your data set to the Google Sheets spreadsheet linked to your pie chart.

Supercharge your spreadsheets with GPT-powered AI tools for building formulas, charts, pivots, SQL and more. Simple prompts for automatic generation.

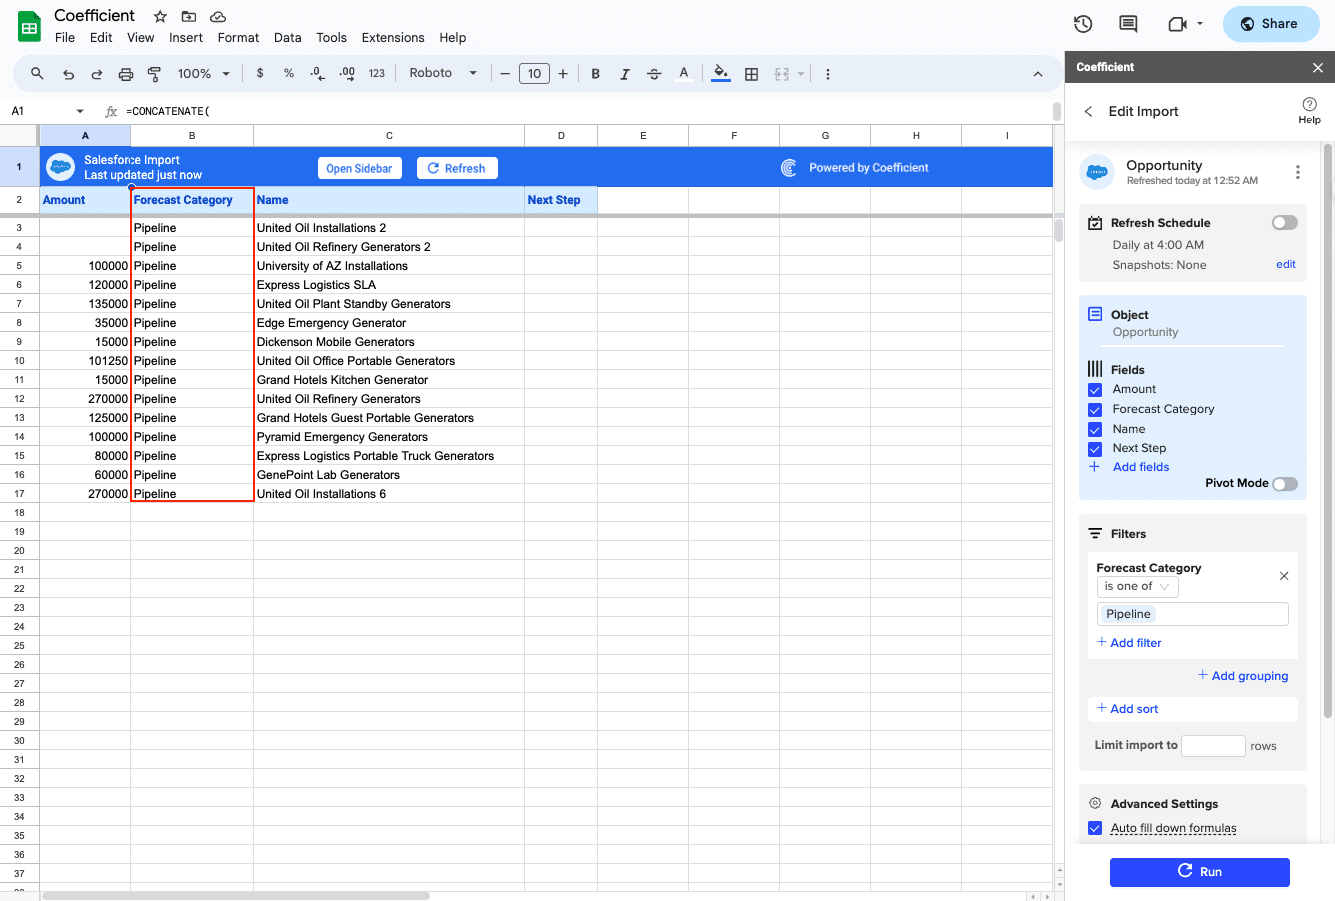
Set up an automatic data refresh schedule (hourly, daily, or weekly).
Create a pie chart and embed it into your Google Slides presentation, following these steps:
- Open your Google Slides presentation and navigate to the desired slide.
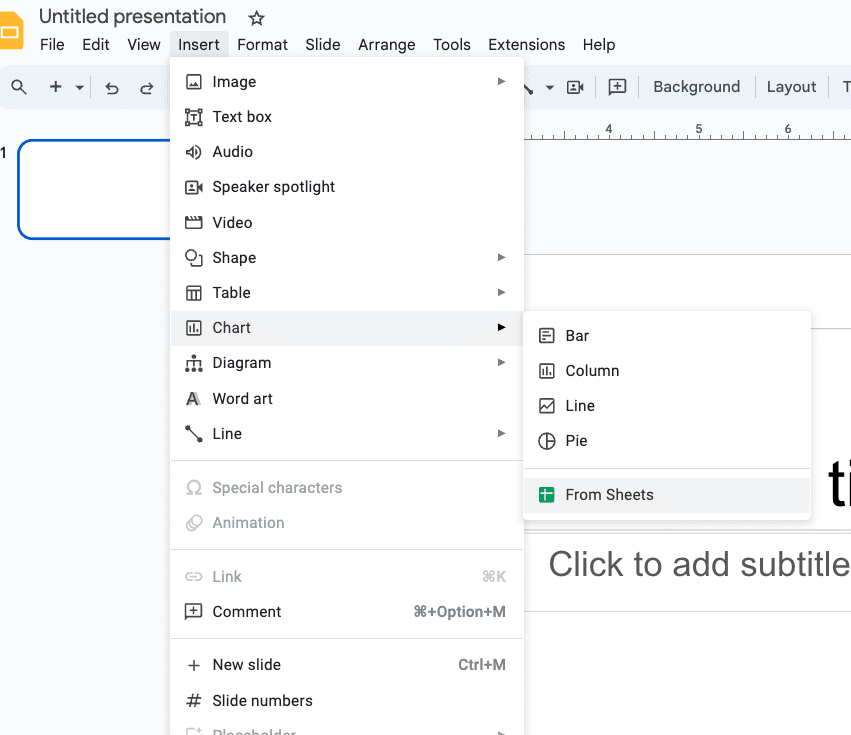
- Click “Insert” > “Chart” > “From Sheets” in the top navigation.
- Select the Google Sheets file and the pie chart you want to embed.
- Click “Import” to embed the chart in your slide.
And that’s it! You no longer need to worry about manually refreshing your data.
Your embedded pie chart in Google Slides will now update automatically whenever the linked data changes in your connected data source.
Tips for Effective Pie Charts in Google Slides
To make the most of your pie charts and ensure they effectively communicate your data insights, consider these tips:
- Keep it Simple: Limit the number of slices in your pie chart to avoid overwhelming your audience. If you have too many categories, consider grouping them or using a different chart type.
- Use Contrasting Colors: Choose colors that are easily distinguishable from one another to help viewers differentiate between slices.
- Include Data Labels: Add data labels and percentages to each slice to provide clear and precise information.
- Highlight Key Insights: Emphasize the most important or interesting slices by using bold colors, exploding them, or adding annotations.
- Tell a Story: Use your pie chart to tell a compelling story by arranging the slices in a meaningful order or using the chart title and legend to provide context.
Edit Pie Charts in Google Slide and Keep Them Updated with Coefficient
Editing pie charts in Google Slides is a simple process that can significantly improve your presentations.
By following the steps outlined in this blog post and using Coefficient to keep your charts refreshed with live data, you’ll be able to create compelling, data-driven presentations with ease.
Try Coefficient today and take your Google Slides presentations to the next level. Get started now.


