Google Sheets is a vital tool in the business operations of B2B SaaS companies, offering a robust “filter” function. This function is crucial for managing, analyzing, and extracting insights from substantial data sets.
This blog will cover how to apply the Google Sheets filter to your spreadsheet.
Understanding Google Sheets Filters
Purpose and Use
Google Sheets filters are powerful tools that allow users to quickly and easily narrow down datasets based on specified conditions.
They are particularly useful when working with large, complex datasets that require meaningful organization and analysis. By applying filters, users can focus on specific subsets of data without losing sight of the larger context, making it easier to derive insights or perform actions based on the filtered data.
One primary advantage of using the filter function over the regular filter view tool is that the function dynamically updates as the data changes, ensuring that users always have the most current and relevant information at their fingertips.
The feature is accessible through both the Google Sheets interface and through formulas utilizing the FILTER function.
Applying Google Sheets Filters: 5 Techniques
Let’s explore five key techniques for using Google Sheets filters to organize and visualize data.
We’ll be using a practical sample data set focused on Sales Data Analysis, which includes sales date, product, quantity sold, region, and revenue.
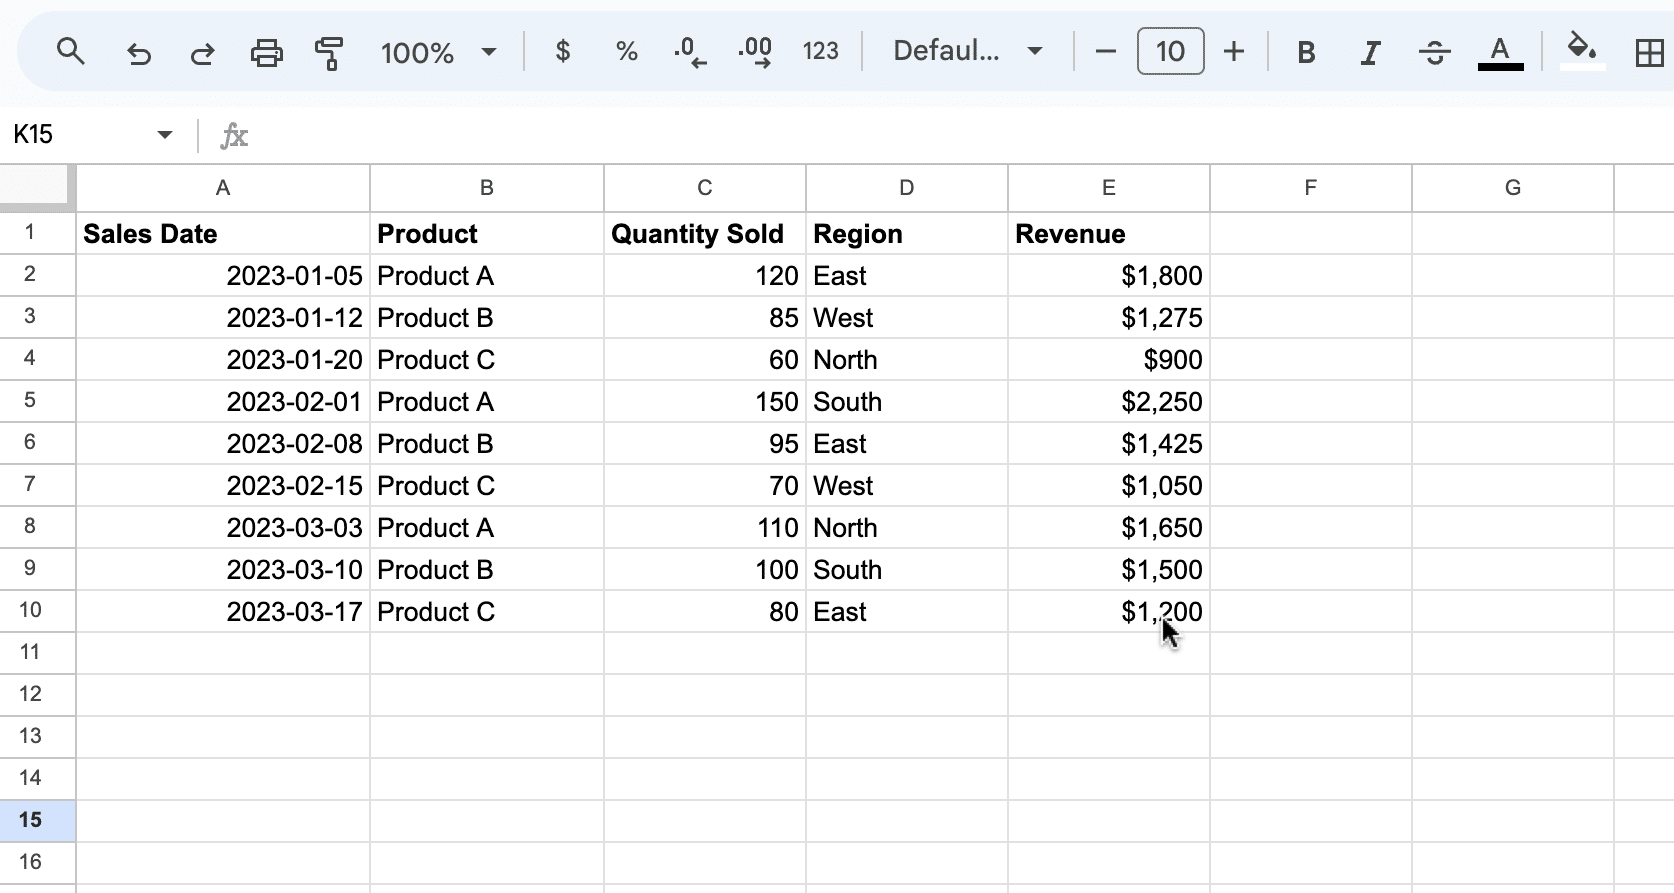
File Name for Dataset Screenshot: “Sample_Sales_Data_Set.png”
Alt Text for Dataset Screenshot: “Sample sales data set in Google Sheets showing columns for Sales Date, Product, Quantity Sold, Region, and Revenue
Filter Views
A filter view allows users to create, save, and apply multiple sets of filters on a single sheet without affecting the original data.
In this example, let’s create a view to show only sales from the “East” region.
Select the range A1:E10.
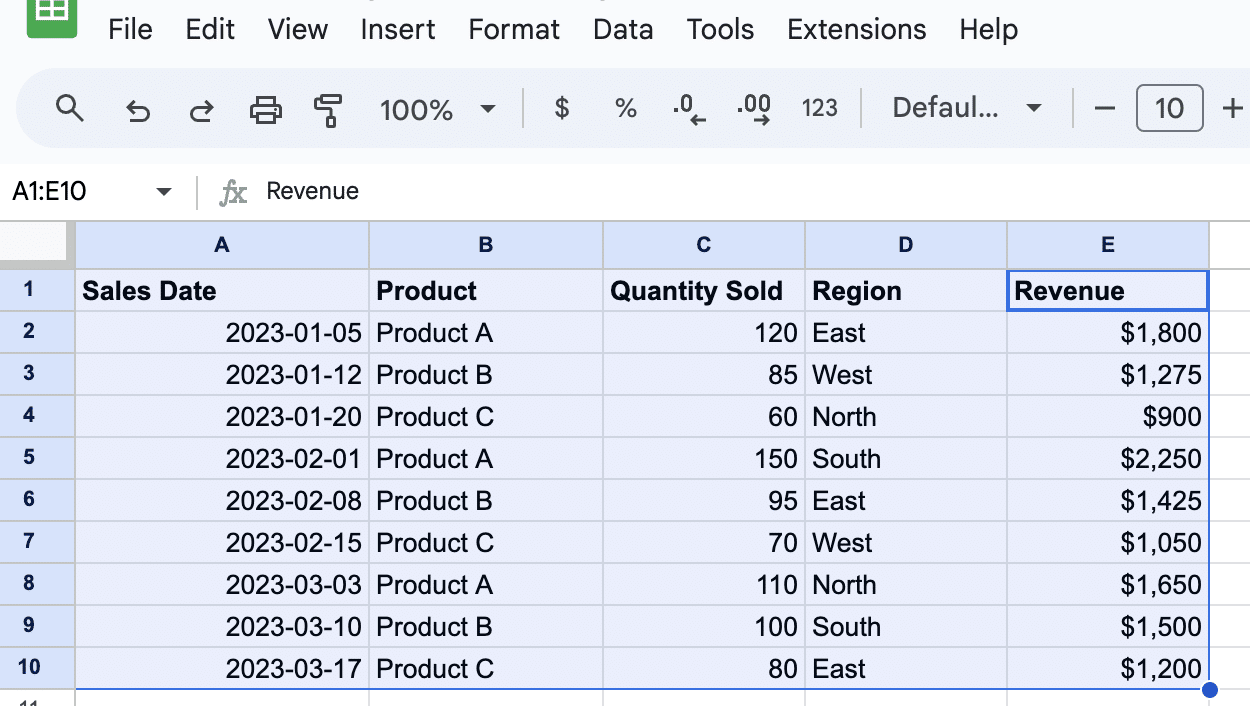
- File Name: “Select_Range_A1_E10.png”
- Alt Text: “Screenshot showing the selection of the data range A1:E10 in the Google Sheets Sales Data, highlighting the columns from Sales Date to Revenue.”
Go to Data > Filter views > Create new filter view.
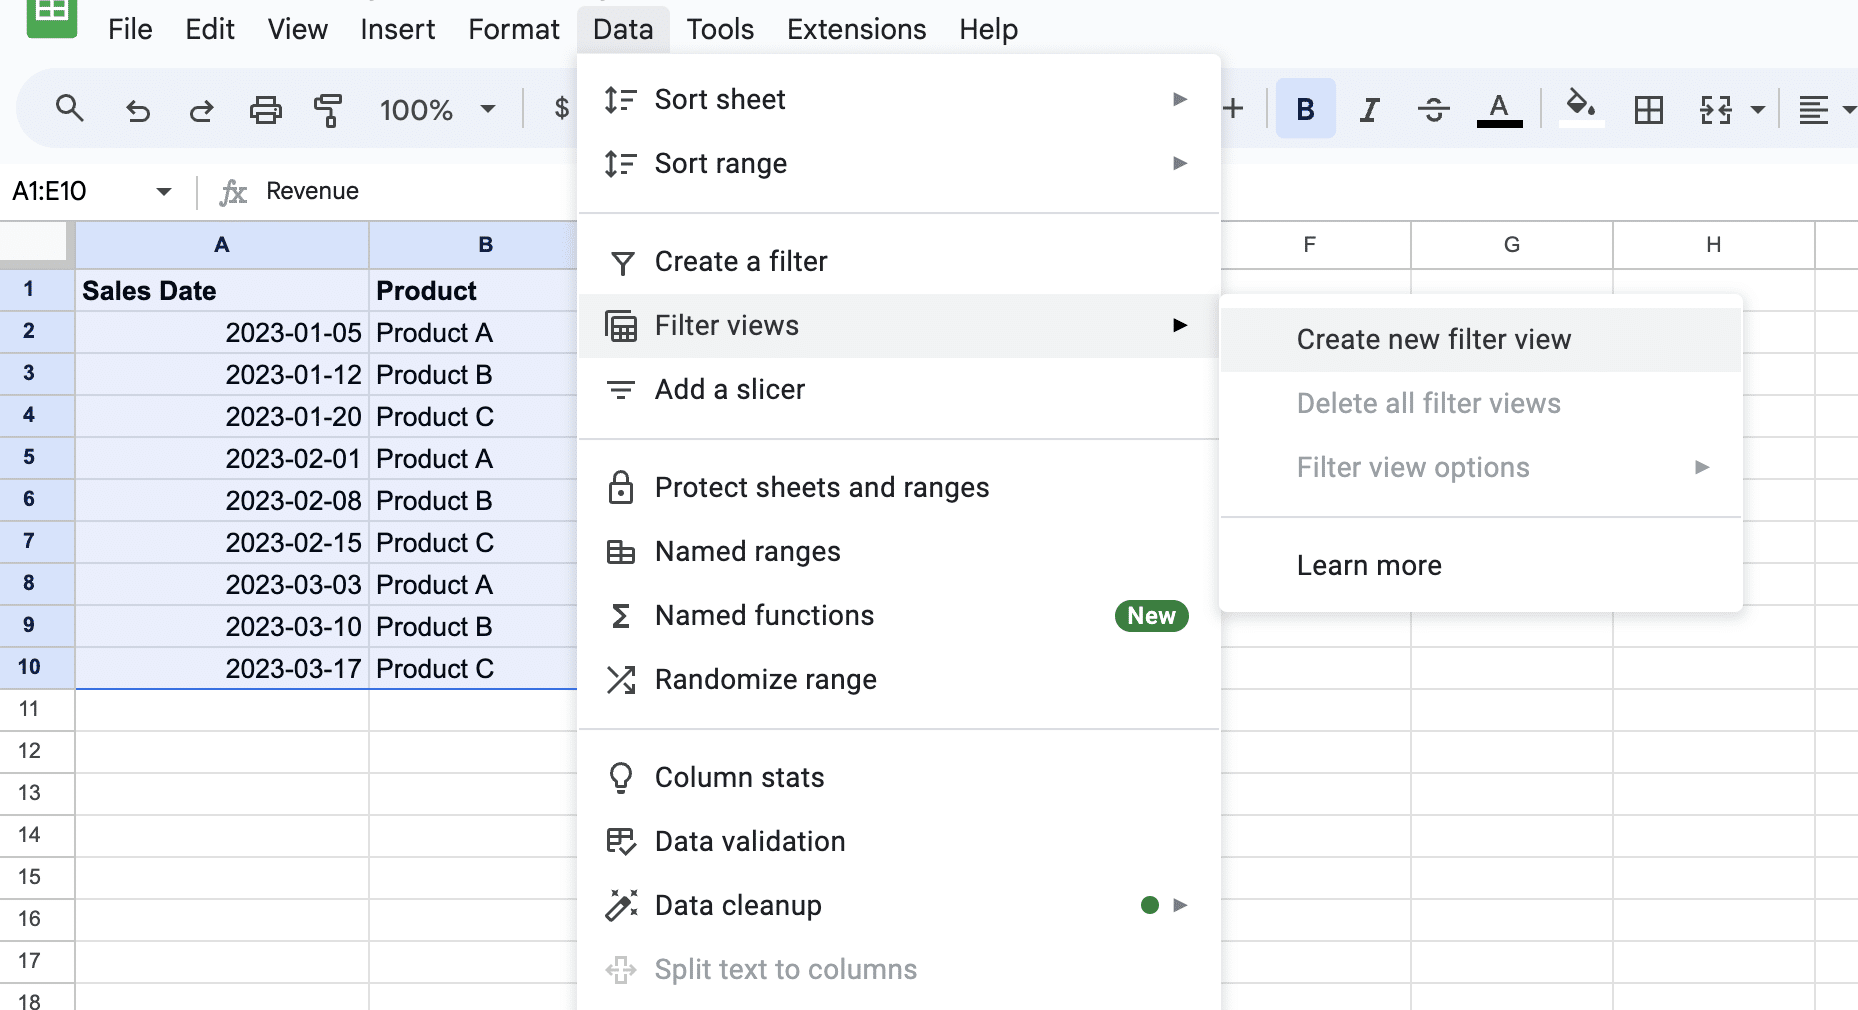
- File Name: “Access_Filter_View_Options.png”
- Alt Text: “Image displaying the navigation to Data > Filter views > Create new filter view in Google Sheets, indicating the process of initiating a new filter view setup.”
In the ‘Region’ column, click the drop-down arrow and select ‘East’.
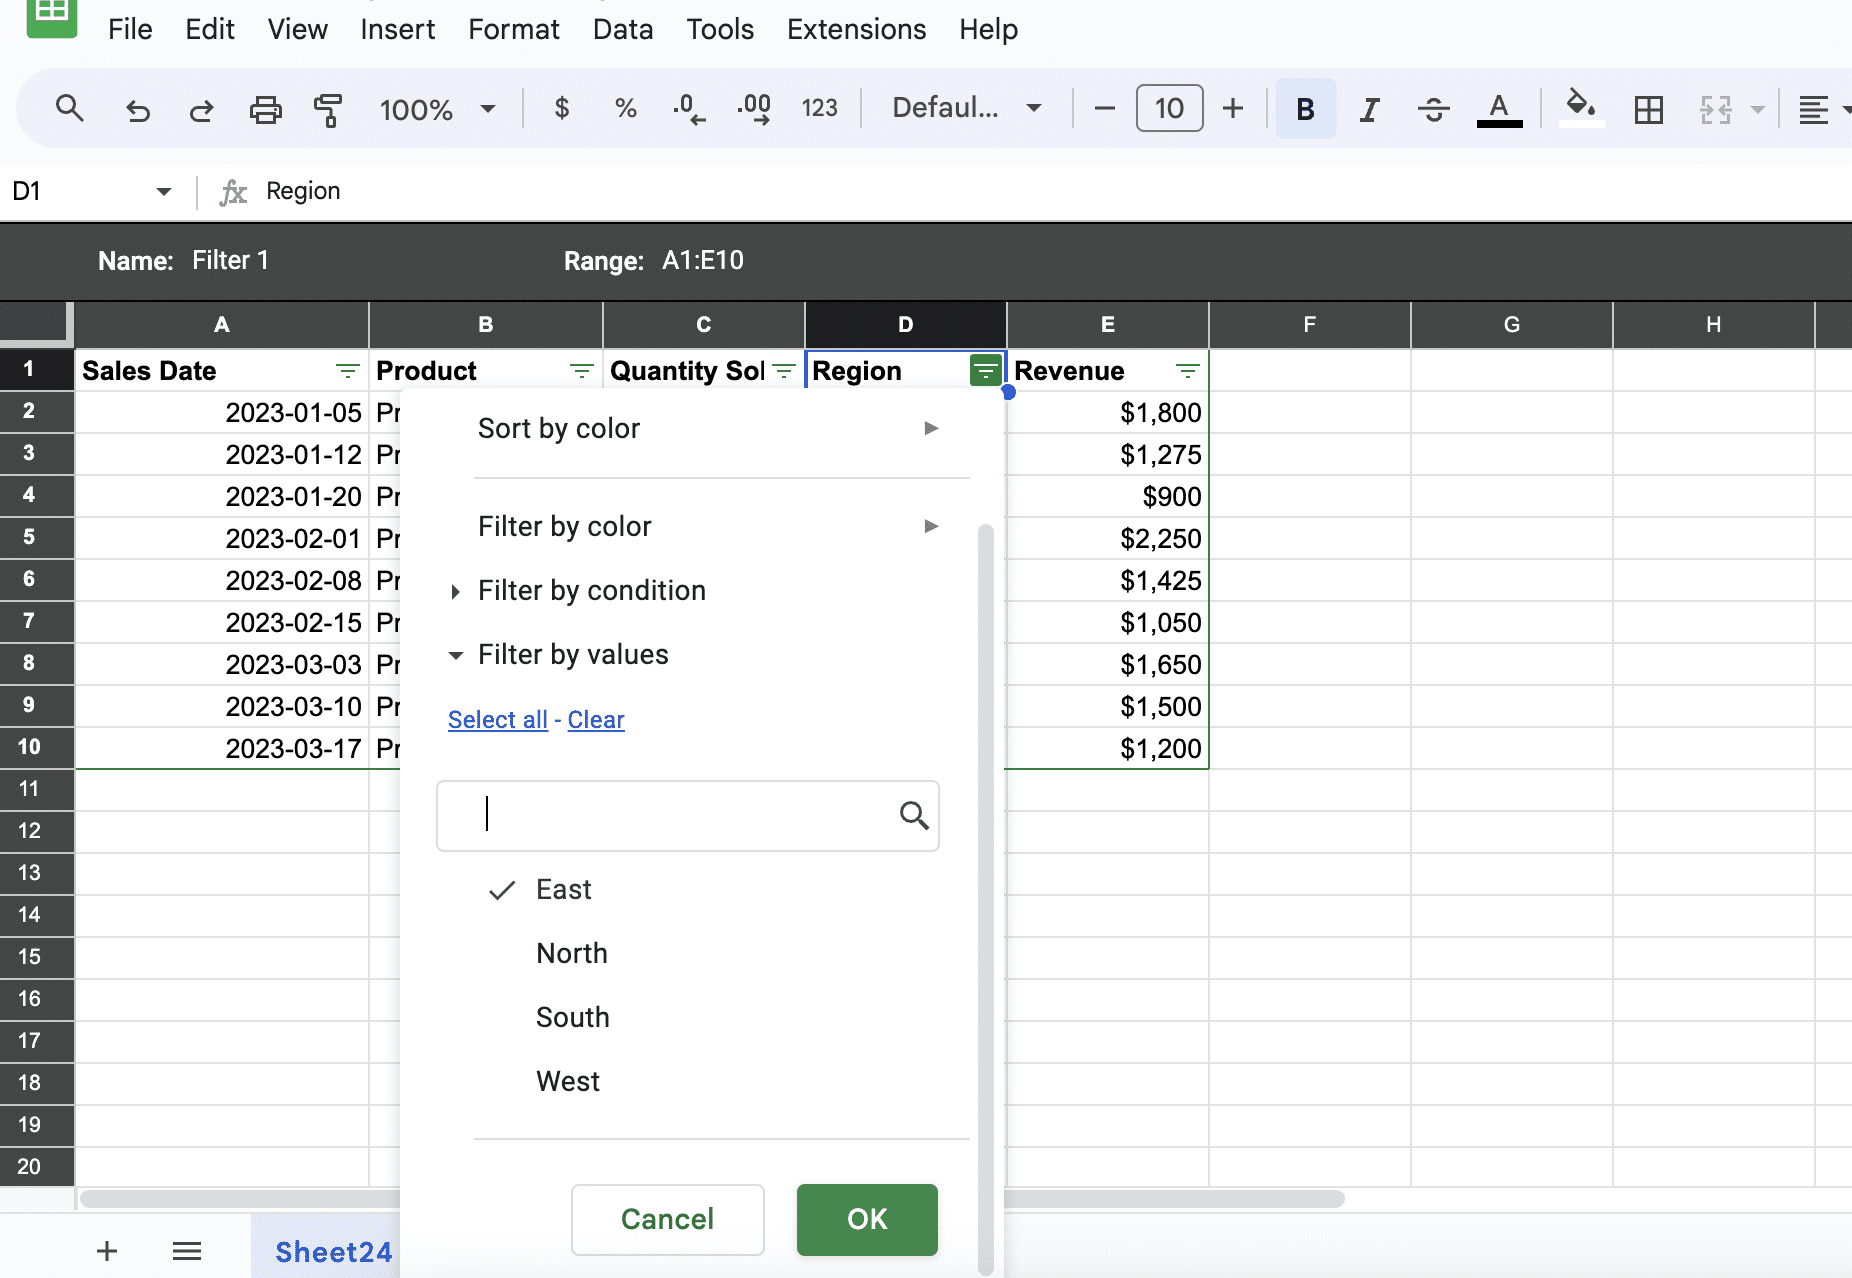
- file Name: “Setting_Filter_East_Region.png”
- Alt Text: “Screenshot capturing the moment of clicking the drop-down arrow in the ‘Region’ column and selecting ‘East’ to set up a region-specific filter in the sales data.”
Click ‘OK’ to apply the filter.
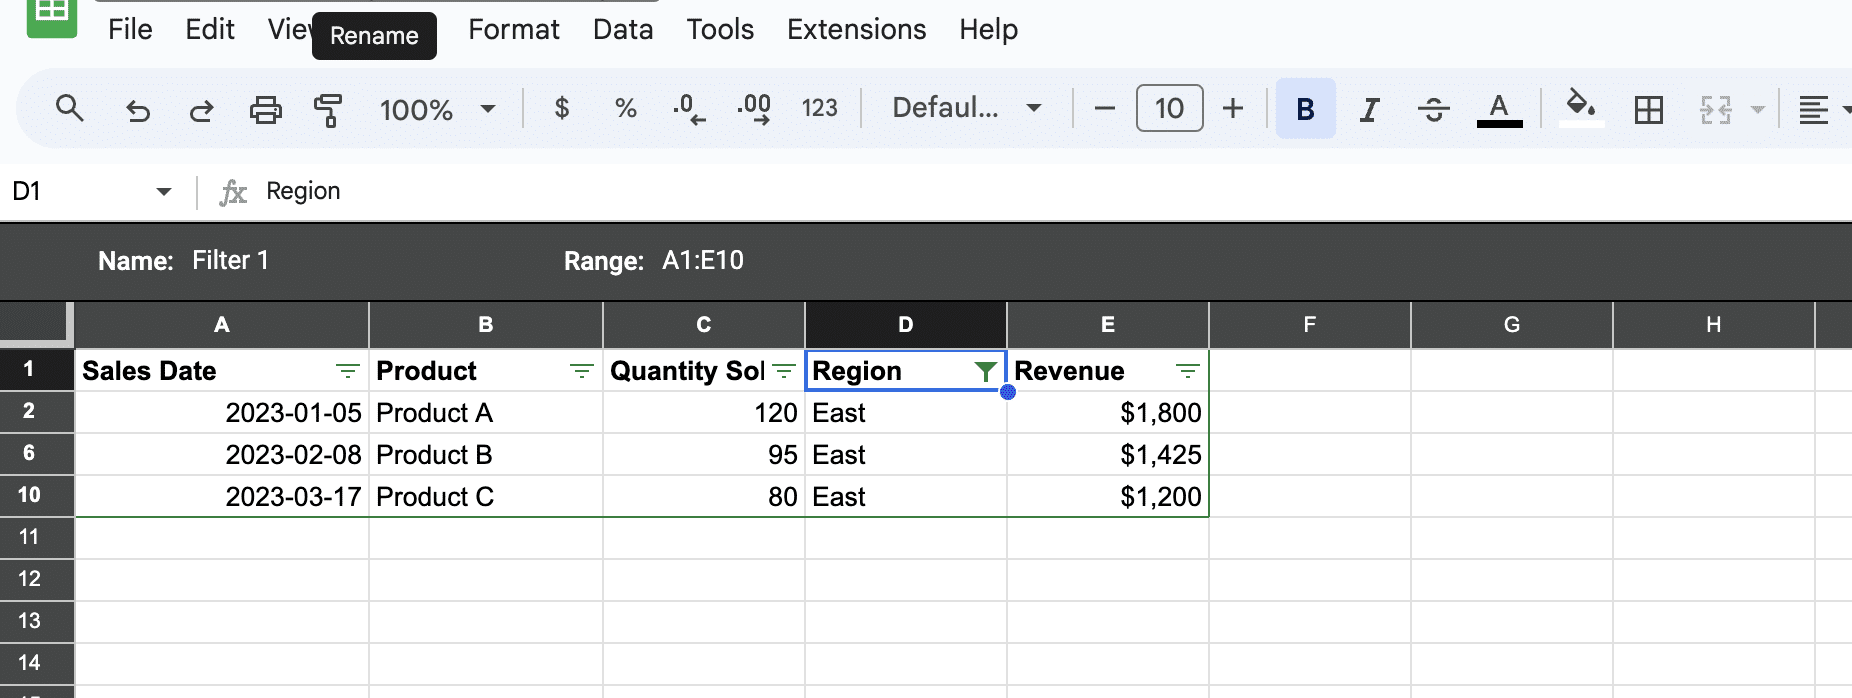
File Name for Screenshot: “Filter_View_East_Region.png”
Screenshot Recommendation: Capture the Google Sheets screen showing the filter view applied, displaying only the ‘East’ region sales data.
Filter Function
The FILTER function is a formula that filters data based on specified conditions.
The syntax is FILTER(source_data, condition1, condition2, …), and it returns a filtered version of the source data according to the conditions.
Let’s apply this to our Sales Data Analysis table to filter sales where ‘Quantity Sold’ is greater than 100.
In a new cell (for example, G2), type the formula: =FILTER(A2:E10, C2:C10 > 100)
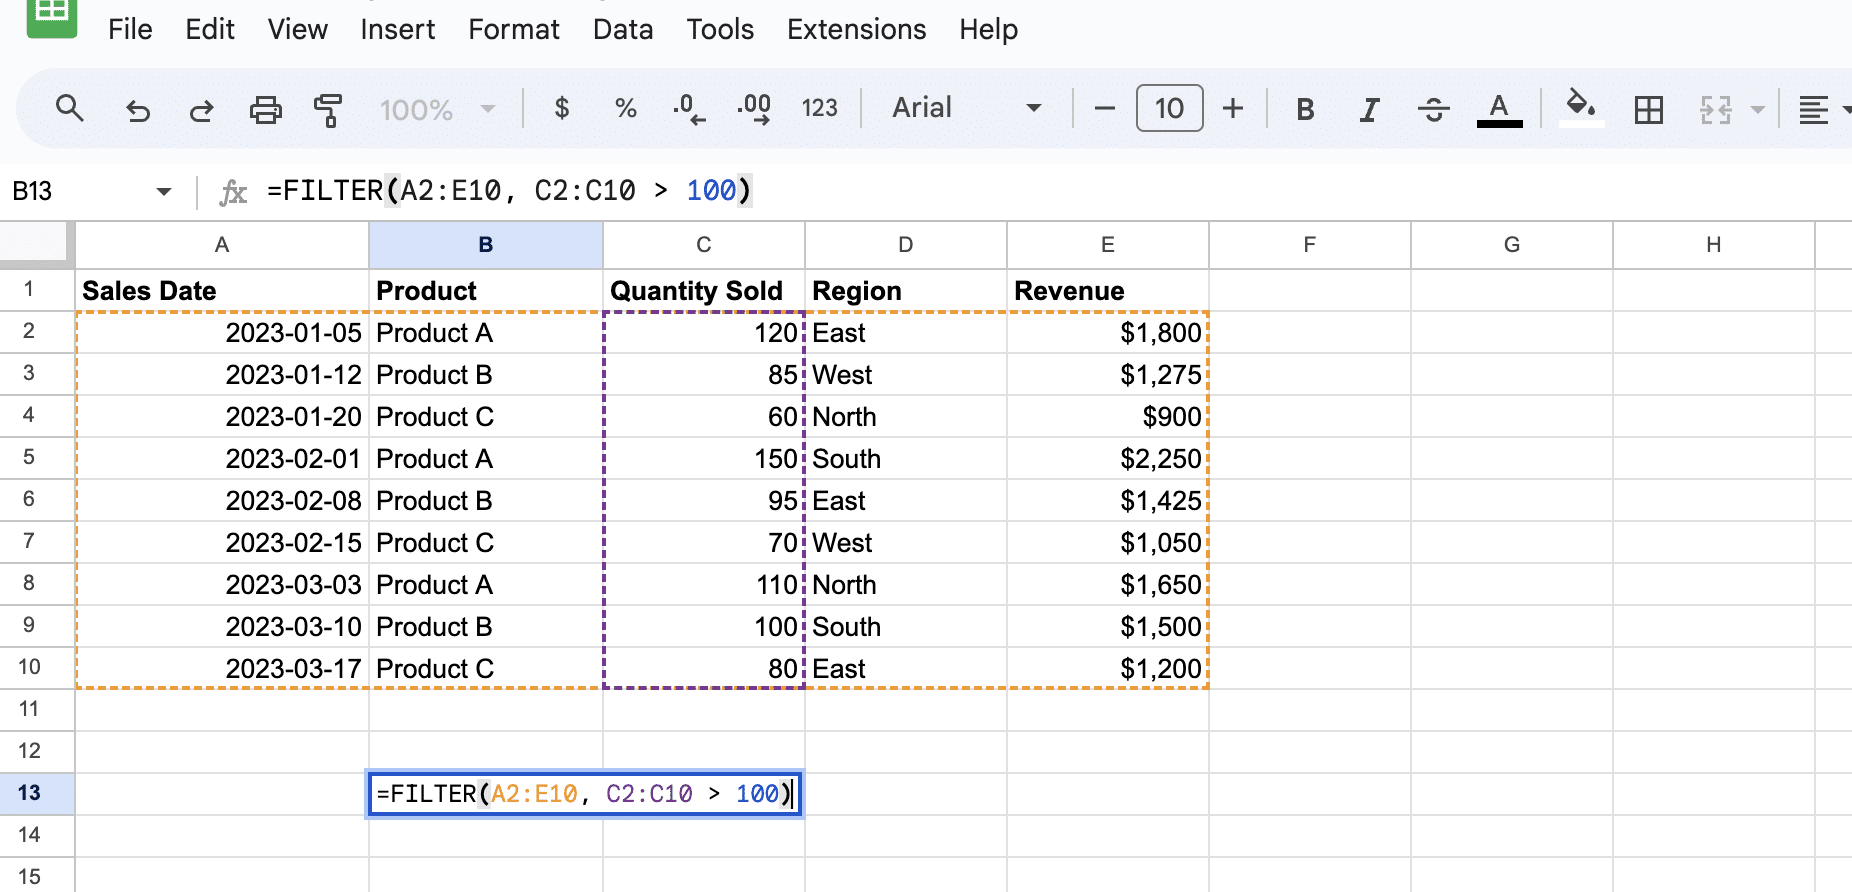
- File Name: “Typing_Filter_Formula_Sales_Data.png”
- Alt Text: “Image displaying the typing of the formula ‘=FILTER(A2:E10, C2:C10 > 100)’ in cell G2, aimed at filtering the Sales Data to show records where the quantity sold exceeds 100.”
Press Enter. This formula will show records where the quantity sold exceeds 100.
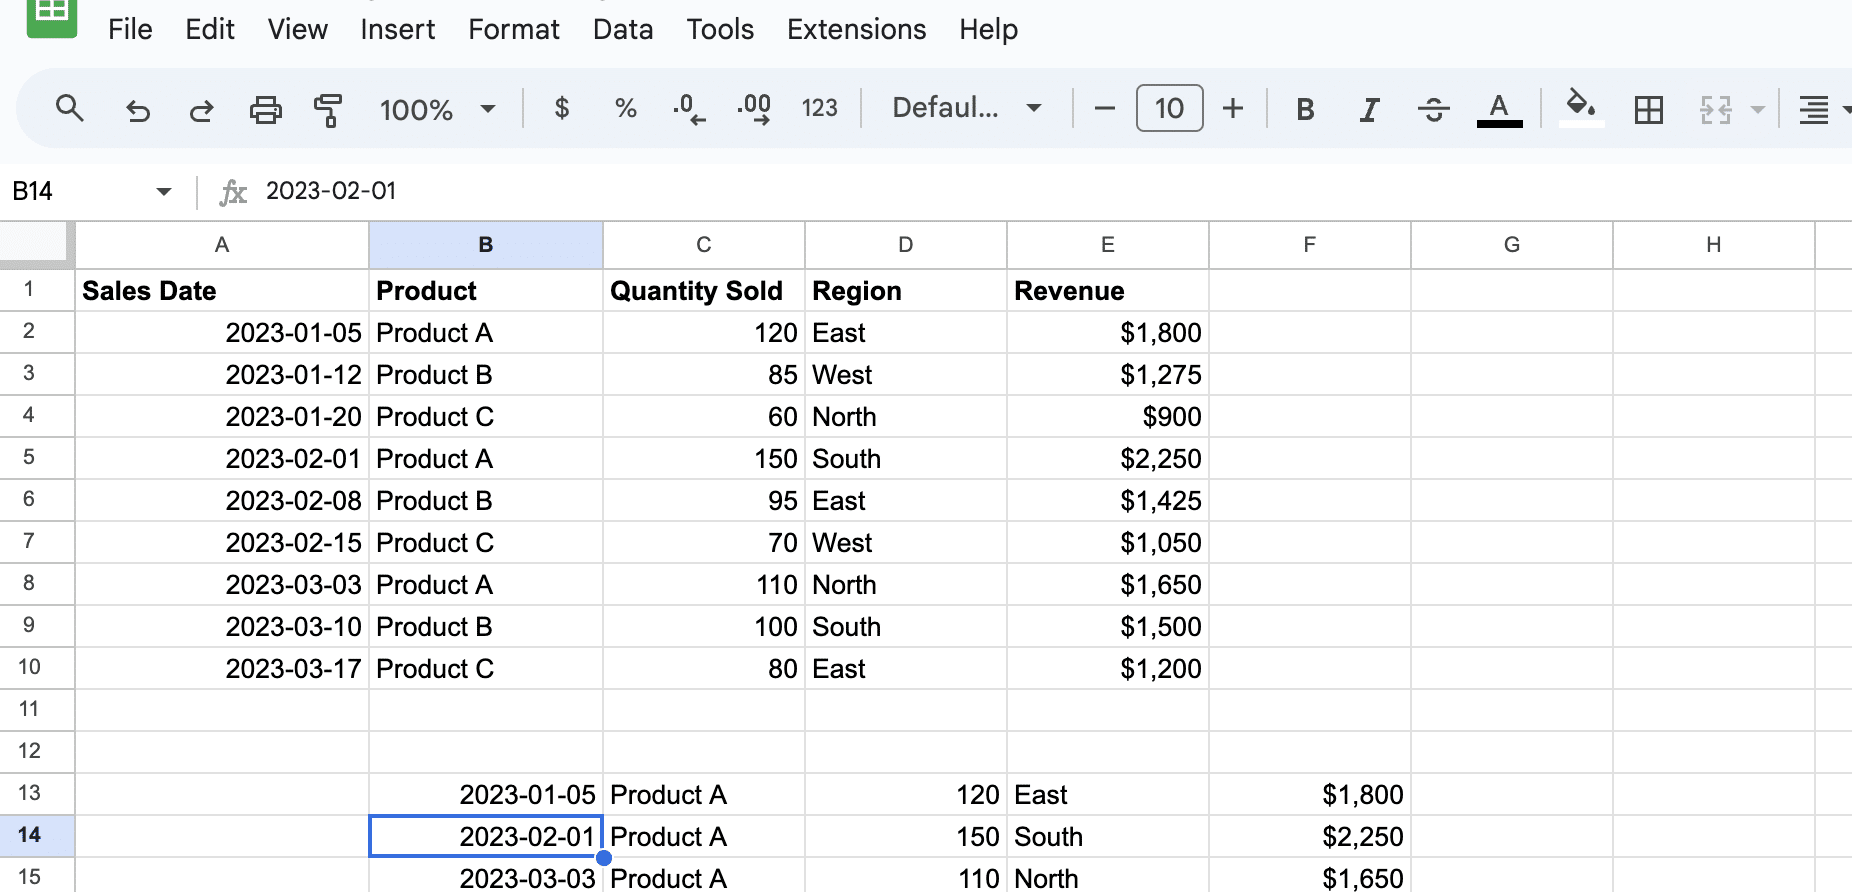
- File Name: “Applying_Filter_Sales_Data.png”
- Alt Text: “Screenshot illustrating the moment of pressing ‘Enter’ after inputting the filter formula, effectively filtering the Sales Data Analysis table to display only sales with a quantity sold greater than 100.”
Filtering by Conditions
Users can apply filters based on various conditions such as values, colors, or custom criteria like text or numerical comparisons.
To filter by condition, go to the top of the range and click on the “Filter” icon in the toolbar.
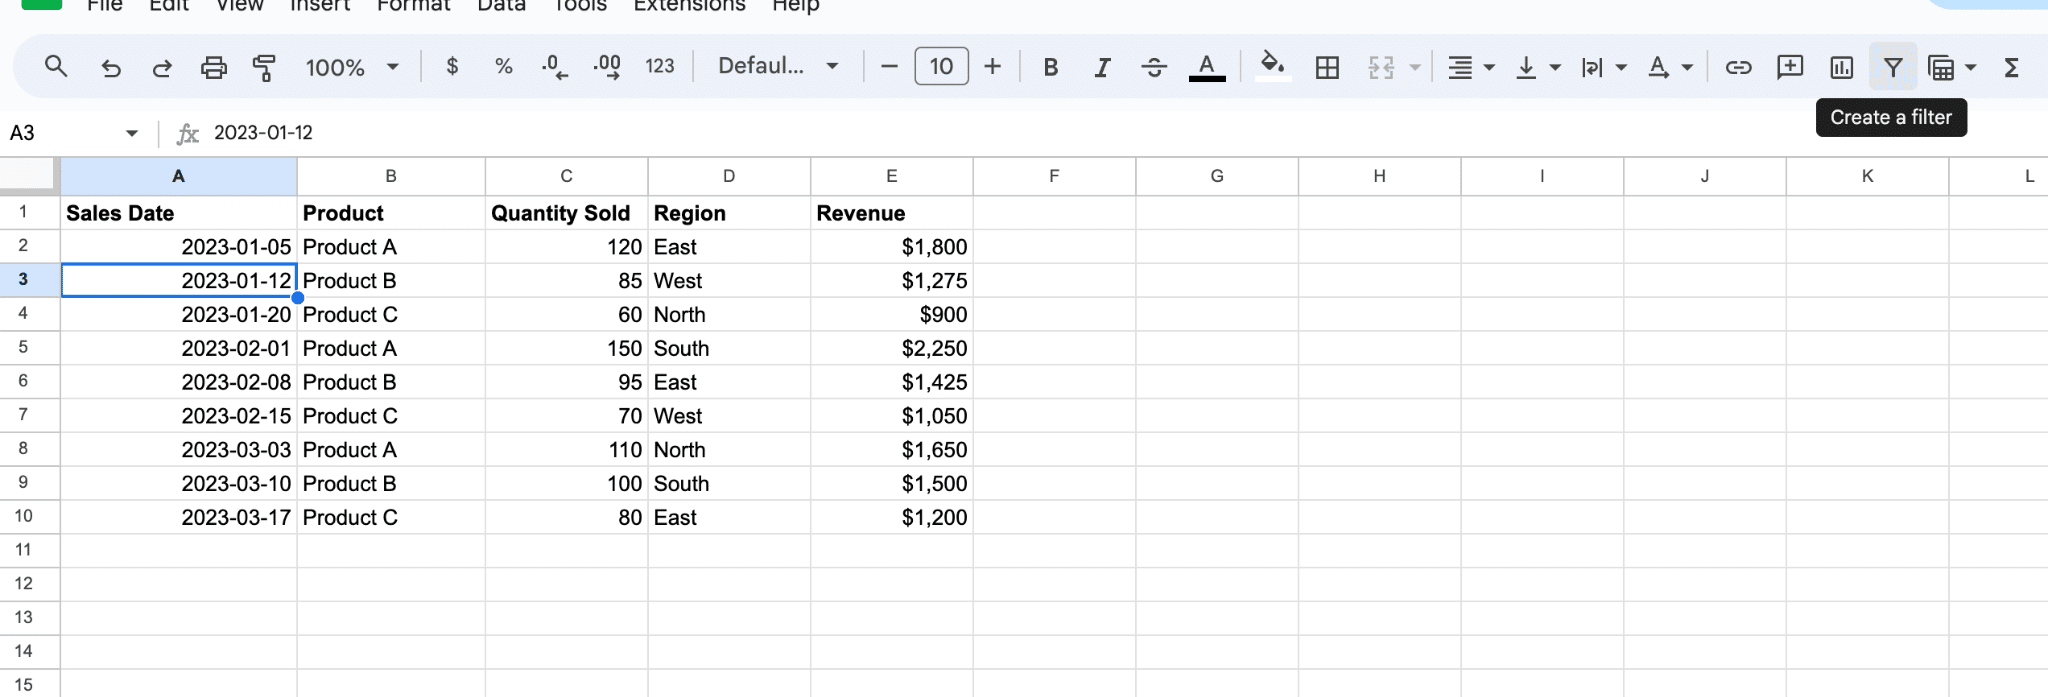
- File Name: “Activating_Filter_Tool.png”
- Alt Text: “Screenshot showing the selection of the ‘Filter’ icon in the Google Sheets toolbar, activating the filter functionality for the data range.”
Click the drop-down arrow in the ‘Quantity Sold’ column.
Supercharge your spreadsheets with GPT-powered AI tools for building formulas, charts, pivots, SQL and more. Simple prompts for automatic generation.

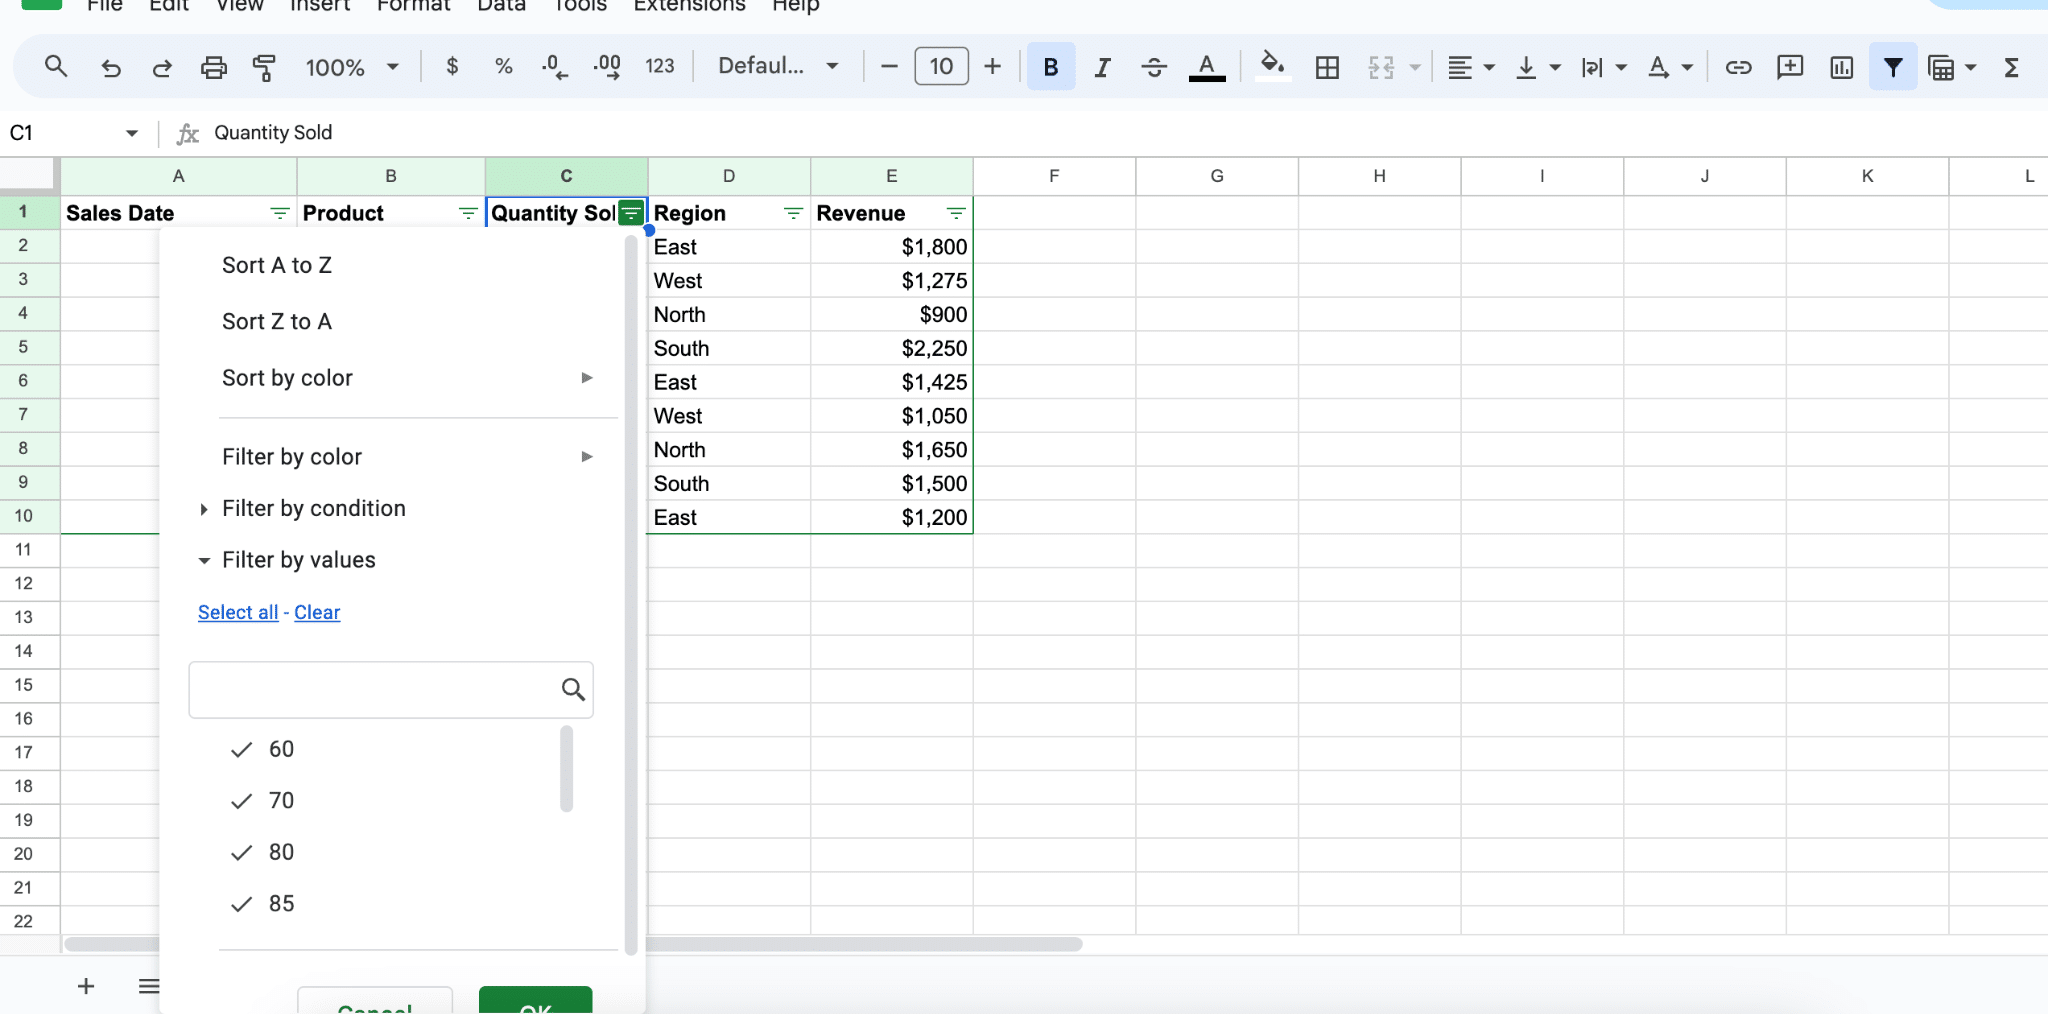
- File Name: “Quantity_Sold_Filter_Options.png”
- Alt Text: “Image depicting the action of clicking the drop-down arrow in the ‘Quantity Sold’ column, ready to set a condition for filtering.”
Choose ‘Filter by condition’ > ‘Greater than’ and enter ’80’.
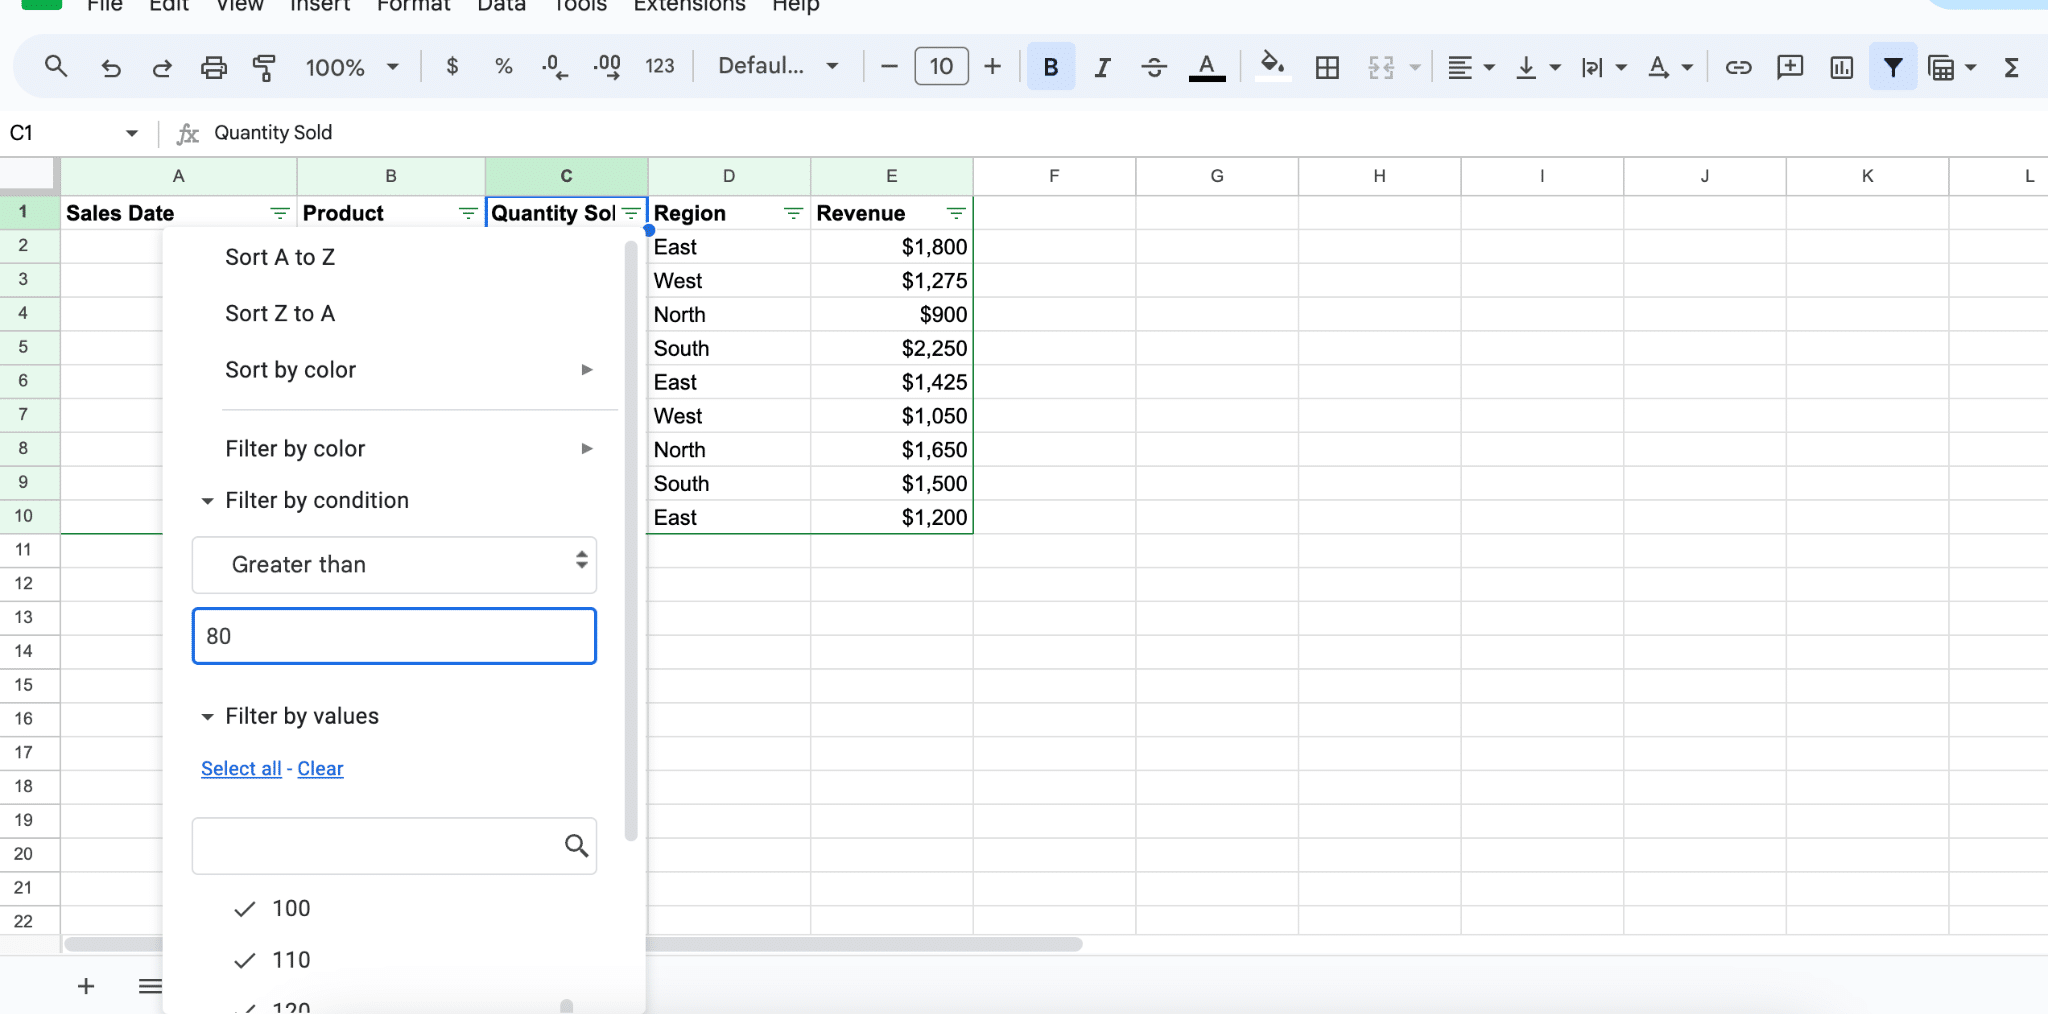
- File Name: “Setting_Filter_Condition_Quantity.png”
- Alt Text: “Screenshot capturing the filter menu where ‘Filter by condition’ is selected, followed by choosing ‘Greater than’ and entering ’80’, setting up the condition to filter sales with quantity sold greater than 80.”
Click ‘OK’. This will filter the data to only show rows where the quantity sold is more than 80.
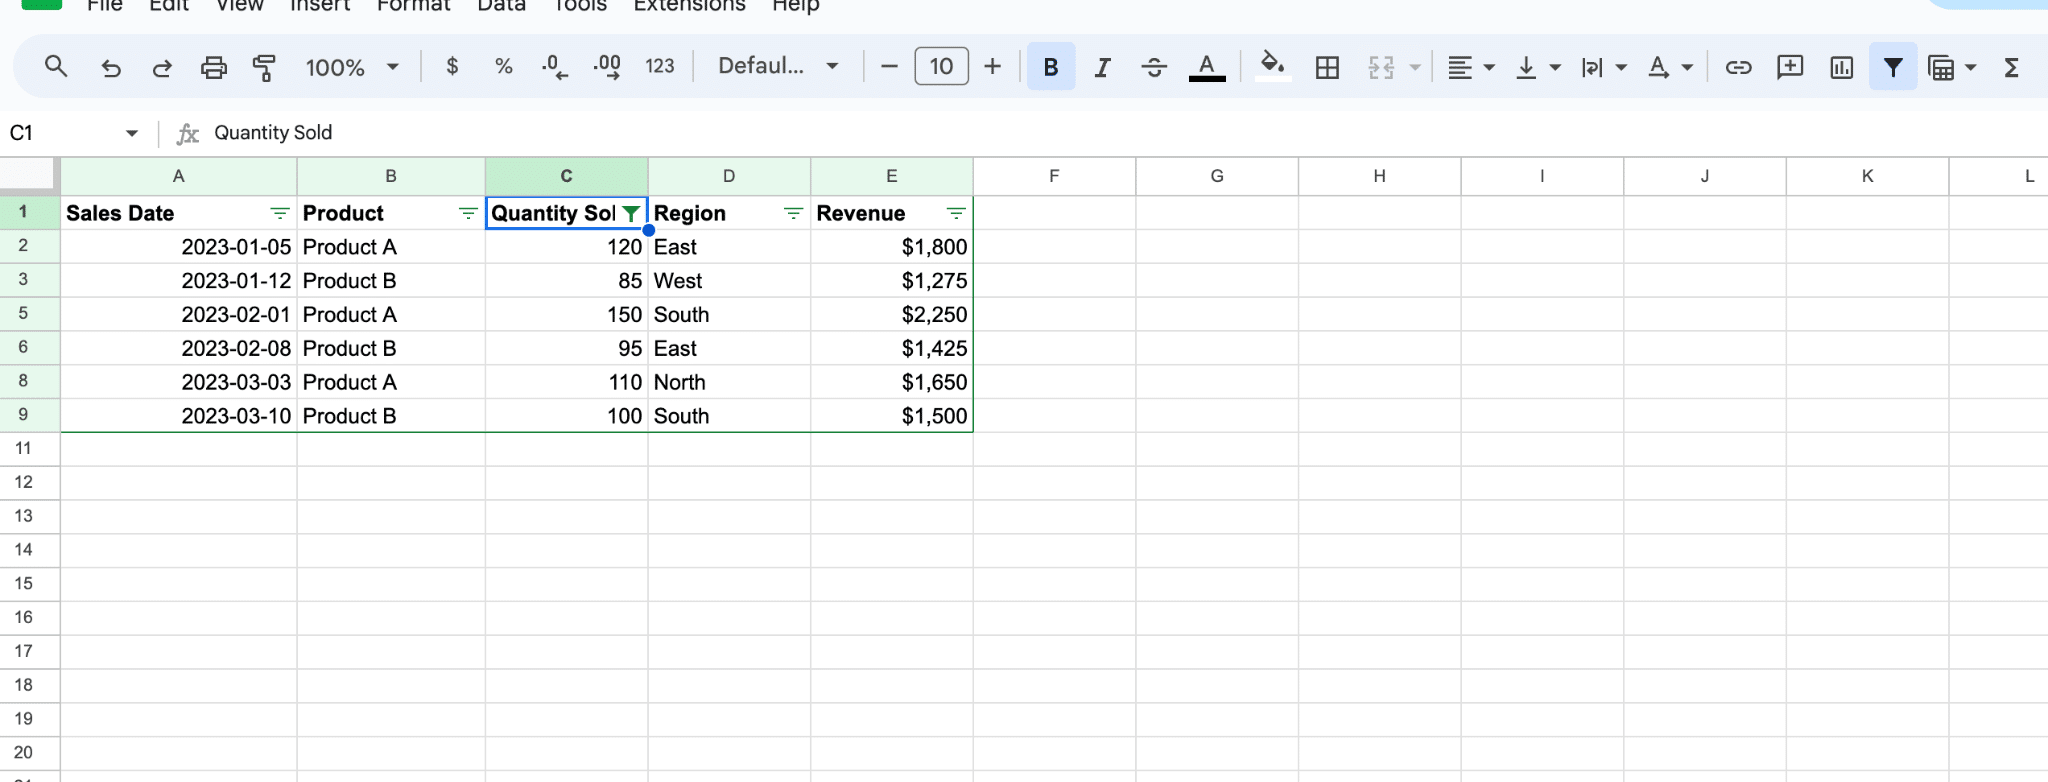
- File Name: “Applying_Filter_Condition.png”
- Alt Text: “Image showing the final step of clicking ‘OK’ to apply the filter, which will update the data to display only rows where the quantity sold is more than 80 in the Sales Data Analysis table.”
Filtering by Values
When using the FILTER function, users can filter the data based on the values within a specific range.
For instance, users can filter the Sales Data to show sales only for ‘Product A’ and ‘Product C’.
Click the drop-down arrow in the ‘Product’ column.
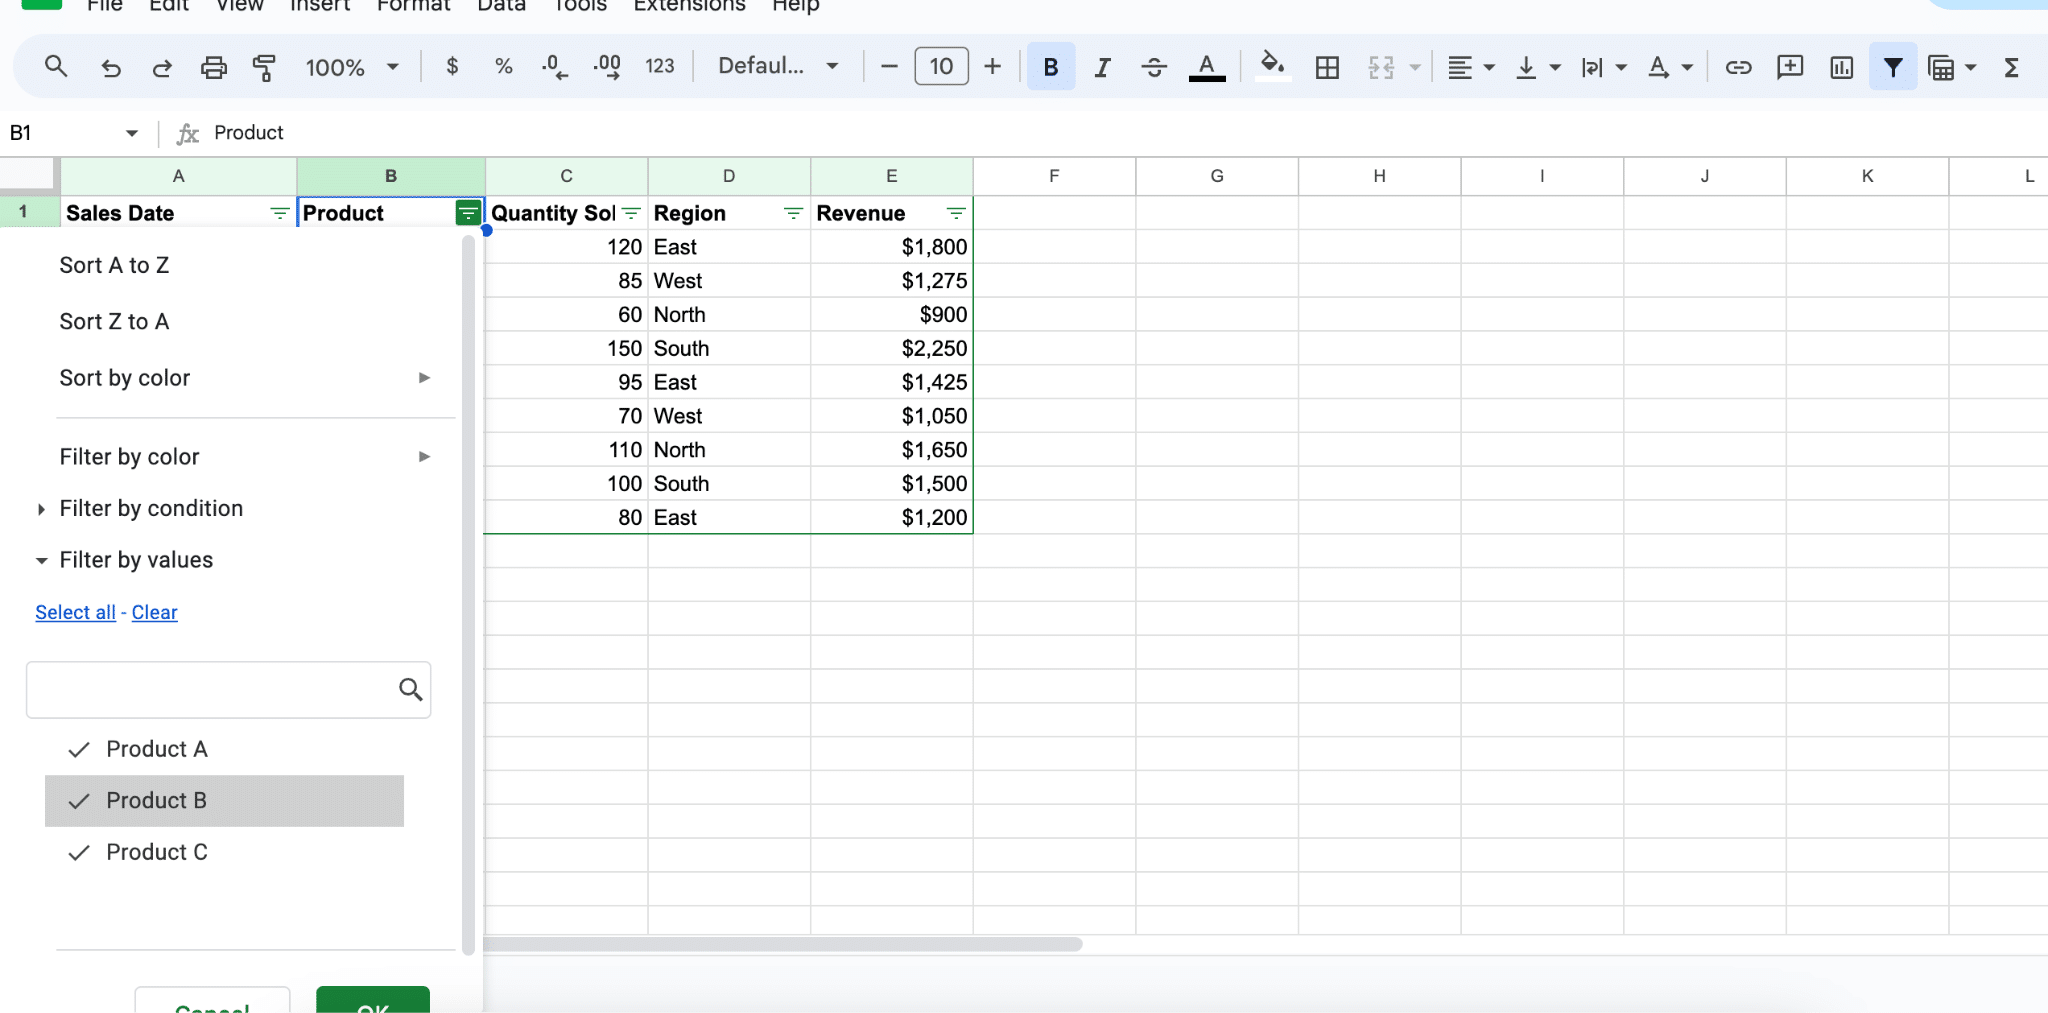
- File Name: “Accessing_Product_Column_Filter.png”
- Alt Text: “Screenshot displaying the action of clicking the drop-down arrow in the ‘Product’ column, opening the filter options for the product category in the Sales Data.”
Uncheck all products except for ‘Product A’ and ‘Product C’.
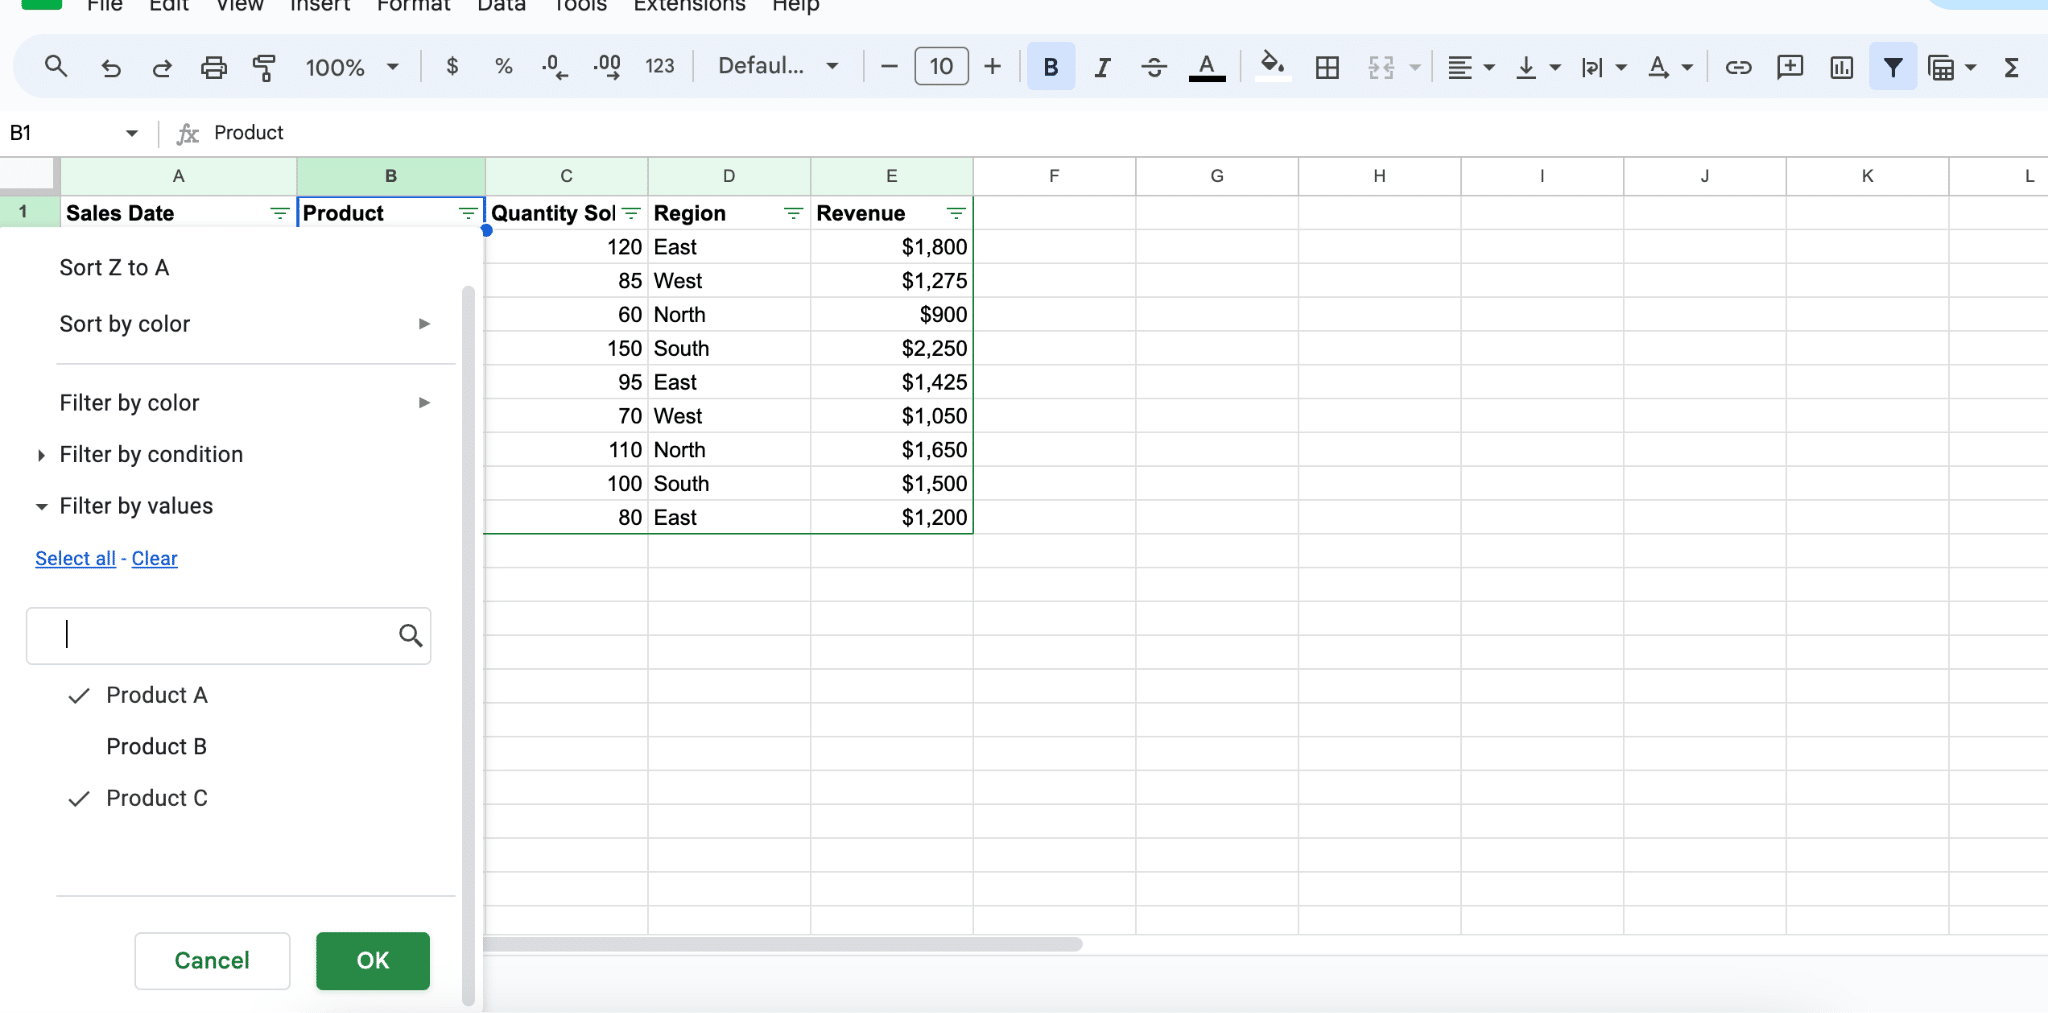
- File Name: “Selecting_Products_A_C_Filter.png”
- Alt Text: “Image showing the filter menu under the ‘Product’ column, with all products unchecked except for ‘Product A’ and ‘Product C’, preparing to filter the data for these specific products.”
Click ‘OK’.

- File Name: “Applying_Product_Filter.png”
- Alt Text: “Screenshot capturing the final step of clicking ‘OK’ to apply the filter, which will update the Sales Data to display only rows for ‘Product A’ and ‘Product C’.”
Multiple Conditions
The FILTER function also allows users to filter data based on multiple criteria or conditions, providing a more granular level of control over how the data is filtered.
As an example, we’ll filter the Sales Data to show sales in the ‘East’ and ‘South’ regions where the ‘Revenue’ is greater than $1,200.
Open the Budget Allocation sheet.
In a new cell (e.g., H2), type the formula:
=FILTER(A2:E10, (D2:D10 = “East”) + (D2:D10 = “South”), E2:E10 > 1200)
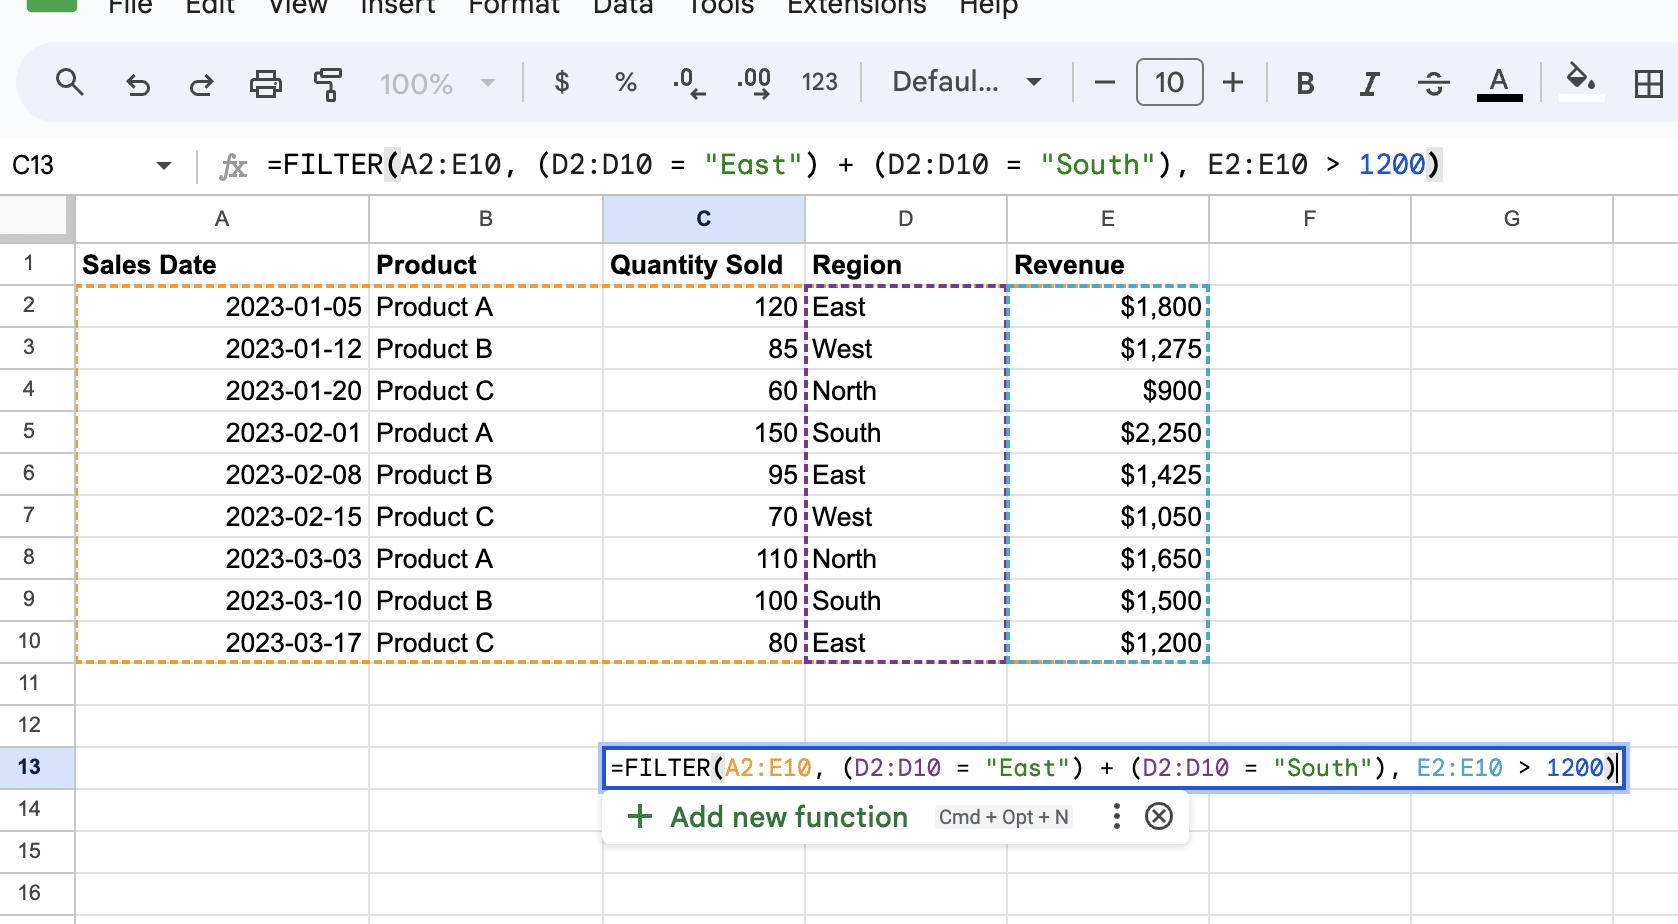
- file Name: “Entering_Multiple_Conditions_Formula.png”
- Alt Text: “Image showing the process of typing the formula ‘=FILTER(A2:E10, (D2:D10 = “East”) + (D2:D10 = “South”), E2:E10 > 1200)’ in cell H2, set to filter the Sales Data for ‘East’ and ‘South’ region sales with revenue over $1,200.”
Press Enter to display the departments that meet both conditions.
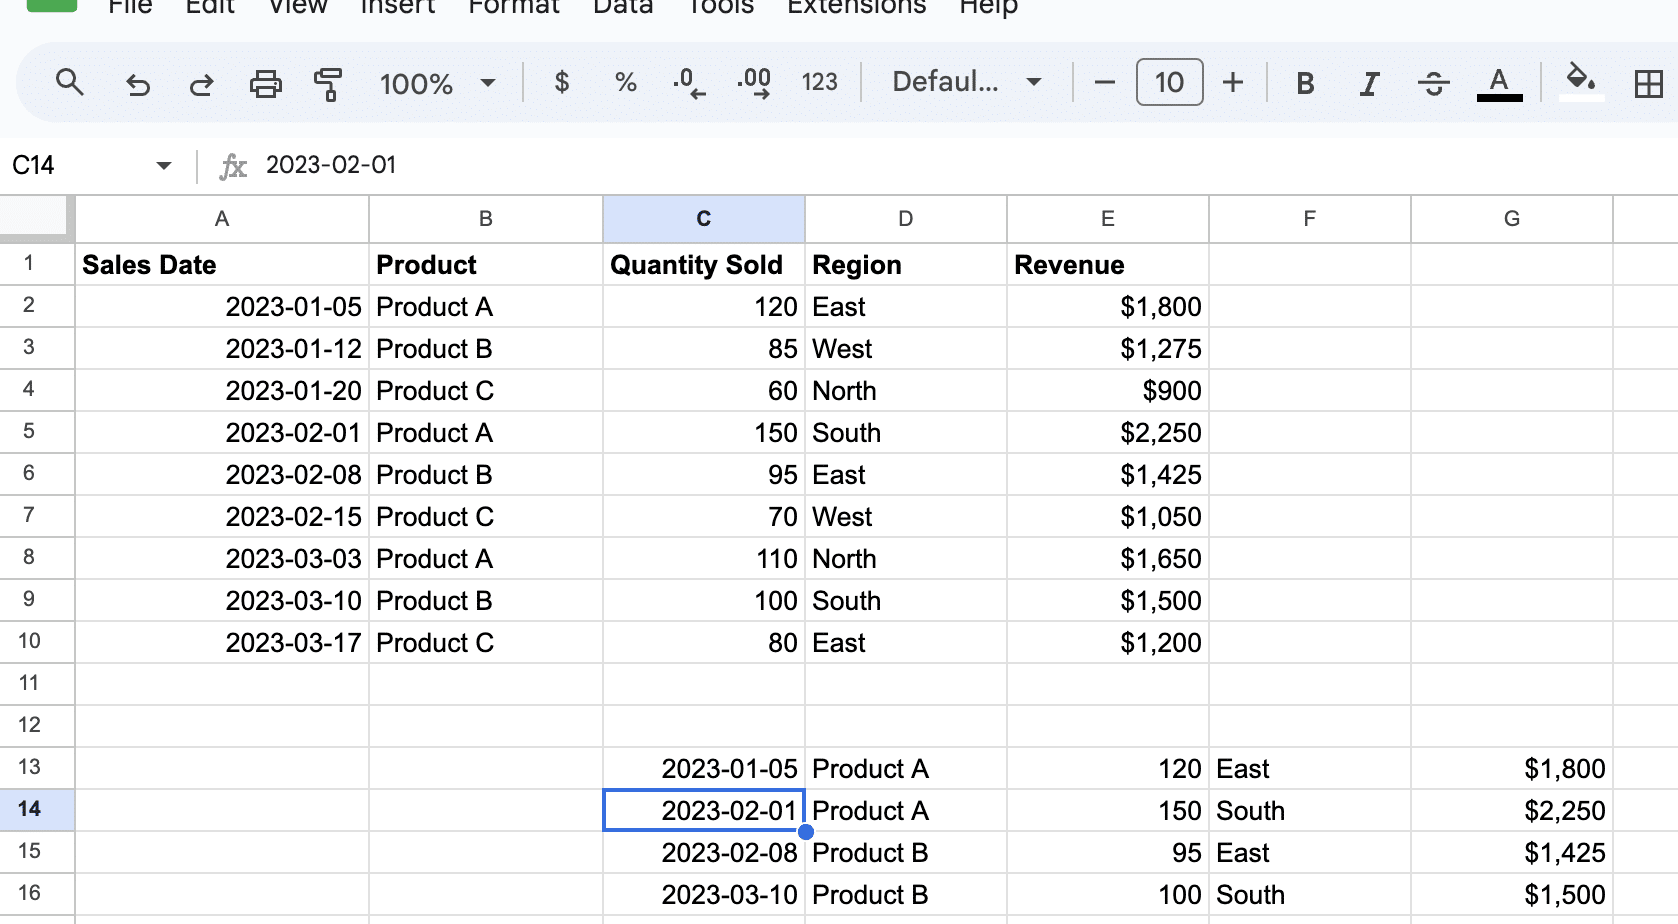
- File Name: “Applying_Multiple_Conditions_Filter.png”
- Alt Text: “Screenshot capturing the moment of pressing ‘Enter’ after typing the filter formula, filtering the Sales Data to show only sales from ‘East’ and ‘South’ regions with revenue exceeding $1,200.”
Troubleshooting Tips
When using advanced filters in Google Sheets, users may encounter hurdles. To prevent or address any issues, keep the following tips in mind:
- Make sure the data range is correct before applying a filter.
- If the FILTER function returns a “#N/A” error, it indicates that no values meet the specified conditions. Revaluate the criteria to ensure accuracy.
- When filtering both rows and columns, use the return value of one FILTER function as the range in another FILTER function.
- For color-based sorting, first create a filter, and then apply sorting by color, as described in the Google Sheets documentation.
Conclusion
Mastering the filter function in Google Sheets is crucial for efficient data management in B2B SaaS business operations.
For enhanced functionality, consider installing Coefficient, a spreadsheet connector integrating live data from various business solutions.
