Borders in Google Sheets improve data readability. Learn to apply and customize them effectively in this guide.
Adding and Adjusting Borders
When working with Google Sheets, adding borders to cells, rows, columns, or specific ranges can significantly enhance the professional appearance and organization of your data.
Basic Border Application
In Google Sheets, one can easily add borders through the toolbar at the top of the application. First, select the cell or range of cells where borders are needed.
Then, click on the borders icon in the toolbar to display a dropdown menu. From here, users can rapidly apply the default border, which is typically a thin, solid black line.
Customizing Border Styles
For a more tailored look, Google Sheets allows for customization of border styles. Within the border options, users can alter the color, thickness, and line style, choosing from solid, dashed, or dotted lines.
To customize the color, select the paint bucket icon to access a color picker where a custom color can be chosen, or choose from a palette of default options for a quick change.
Applying Borders to Specific Ranges
To apply borders to particular cells, columns, or rows within Google Sheets, simply highlight the targeted area.
Then, using the dropdown menu within the Format cells section on the toolbar or the sidebar, select which border style suits best, whether it be around the outer edges of the selected range or between individual cells within the range.
This level of control ensures that every bit of data is framed exactly as desired.
Advanced Border Features and Best Practices
When working with data sets in Google Sheets, enhancing sheets with advanced border features contributes to both aesthetics and functionality. By mastering conditional formatting, maintaining consistency in design, and resolving common border issues, users can transform their spreadsheets into professional and clear data representations.
Using Conditional Formatting for Borders
Conditional formatting allows users to automatically apply borders to cells based on specific criteria. For example, users can set formatting rules to underline certain data points that exceed a threshold value.
To execute this, users should navigate to the ‘Format’ menu and select ‘Conditional formatting’. Applying custom formulas can determine where and when the bottom border appears, serving as visual cues for quick analysis of data.

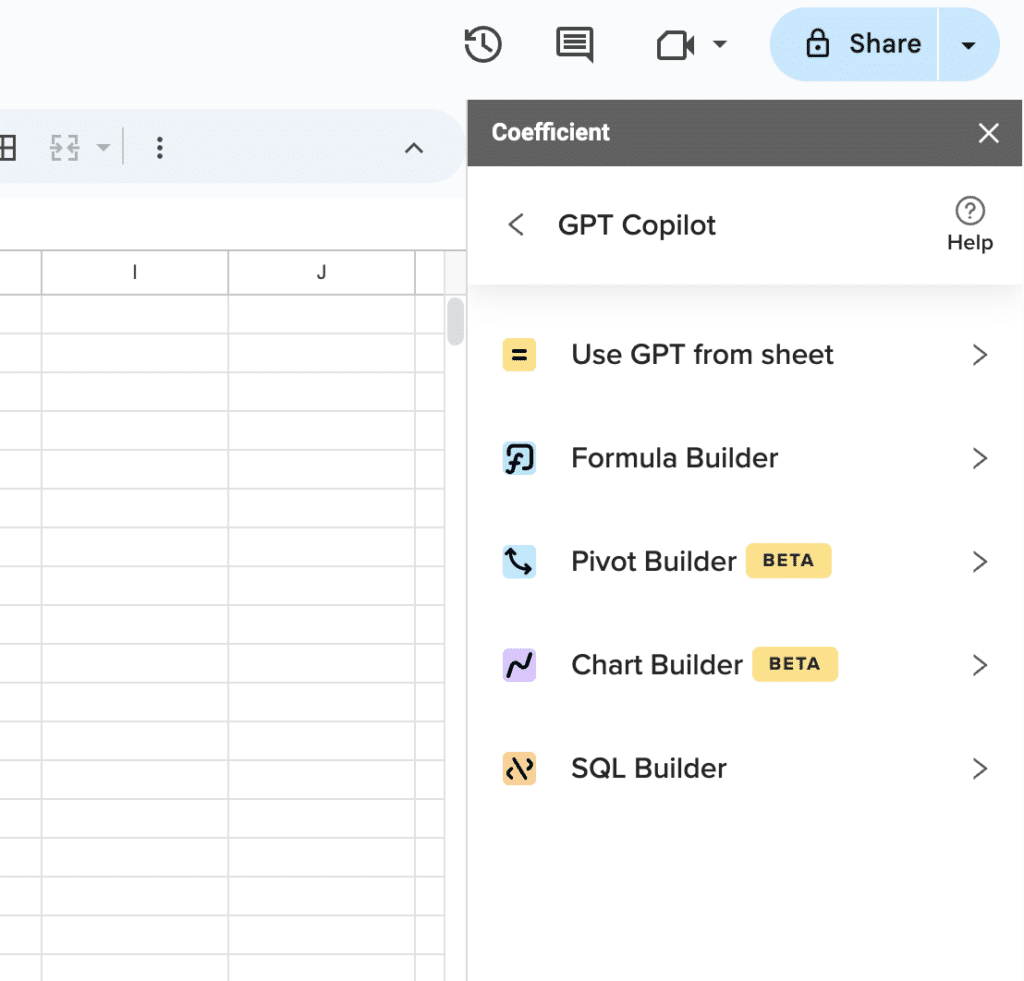
Supercharge your spreadsheets with GPT-powered AI tools for building formulas, charts, pivots, SQL and more. Simple prompts for automatic generation.

Enhancing Readability and Consistency
Readability and visual appeal go hand in hand. Consistent application of cell borders in Google Sheets ensures data is easy to follow. Users can customize border styles, colors, and thickness to categorize and delineate data.
For maintaining uniformity, the ‘Paint Format’ tool can replicate specific border styles across multiple cells. Selecting the formatted cell and clicking this tool, users can then apply the style to other cells with a single click, promoting visual consistency.
Troubleshooting Common Border Issues
Users may encounter problems when trying to add, remove, or customize borders. Common issues include borders not appearing as expected or incorrect application of styles. To troubleshoot, users should check the range of cells selected before modifying borders.
Keyboard shortcuts can also prove useful; for instance, pressing Ctrl + \ will remove borders quickly.
Conclusion
Mastering borders in Google Sheets enhances data presentation.
For more advanced data management, consider installing Coefficient for seamless integration with Google Sheets.


