Track your store’s performance. Take your business to the next level.
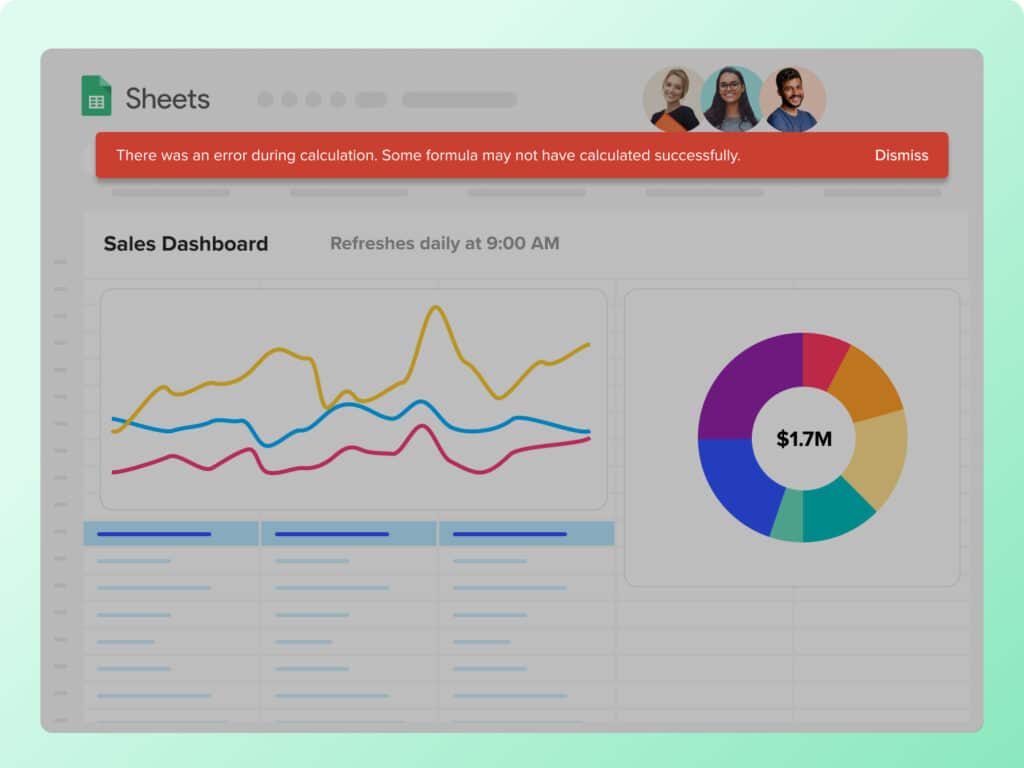
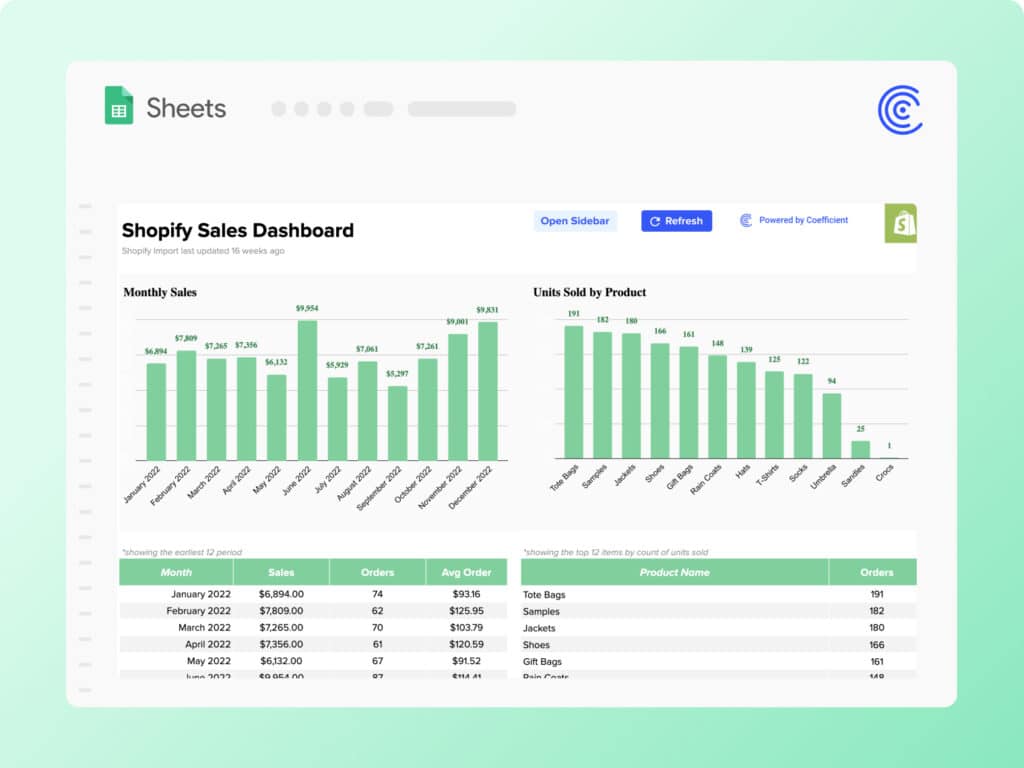
Monitor your store’s sales and product performance with our Shopify Sales Dashboard for Google Sheets. Visualize your core Shopify metrics automatically, and build your own customizations on top of our free template.
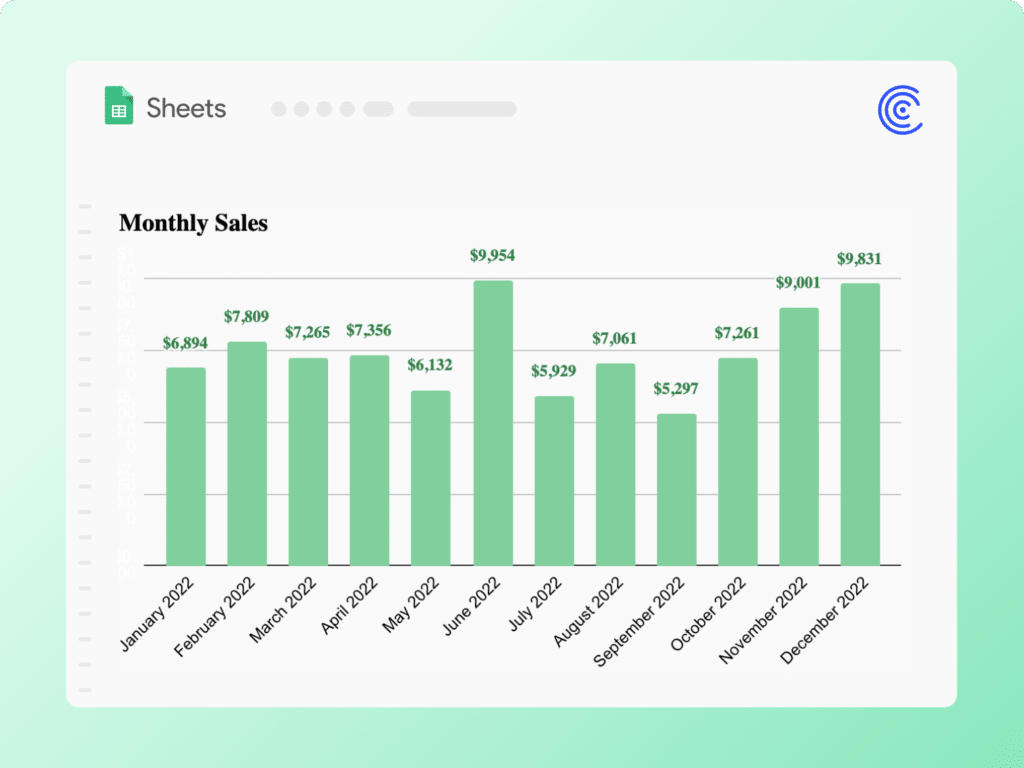
- View revenue and order count by month, product, and country
- Easily adjust dashboards by adding custom fields
- Filter dashboards for specific time periods, geographic locations, and more
- Import other data sources or Shopify reports to enhance your analysis
What Are the Different Types of Sales Reports in Shopify?
- Finances Report: Provides an overview of your sales, payments, pending payments, and account information such as your Shopify fees. You can view different finance reports based on your channels within your Shopify account, including your online shop, any physical stores that you use Shopify Point of Sale software for, and apps, or Facebook or Pinterest sales that are linked.
- Sales Reports: Details all the information related to the orders that have been placed. You can view your sales by month, hour, channel, location (for Point of Sales), staff, and by product. You can find some key metrics like average order value, gross sales, and net sales in this report. And you can view the ‘Sales by traffic referrer’ report, which breaks down where your customers come from.
- Customers Report: Offers insights on your customers over time, customers by expected value, and new customers by country. Within these reports, you can see useful metrics such as average order count, average order total, and expected purchase value.
- Acquisition Reports: Reports under acquisition cover visits over time, visitors by the referrer, visitors by marketing campaign, and visitors by location. These reports don’t show converted sales, or the number of orders, just people that have viewed your website.
- Behavior Reports: Behavior reports help you to understand how your customers and visitors to your Shopify store interact with it, such as what they’re searching for, which pages they visit, and how they’re viewing your sho
- Custom Reports: Users on the Advanced Shopify or Shopify Plus plan can create their own custom reports based on their unique business needs.
How Do I See Total Sales by Product in Shopify?
- Log in to your Shopify account: Open your web browser and navigate to the Shopify login page. Enter your credentials to log in to your account.
- Navigate to the Analytics section: Once you’re logged in, look for the “Analytics” option in the left-hand side menu. Click on it to open the Analytics section.
You’ll see a widget on the homepage that displays total sales at a glance. In order to filter by product, you’ll need to get a more granular view of your data with Shopify’s “Total Sales” report.
- Open the Reports Subsection: In the Analytics section, you’ll find a subsection labeled “Reports.” Click on this to open it.
- Find the Sales by Product Report: In the Reports subsection, you’ll find a variety of different reports. Search for “Sales by product” in the search bar and click on it.
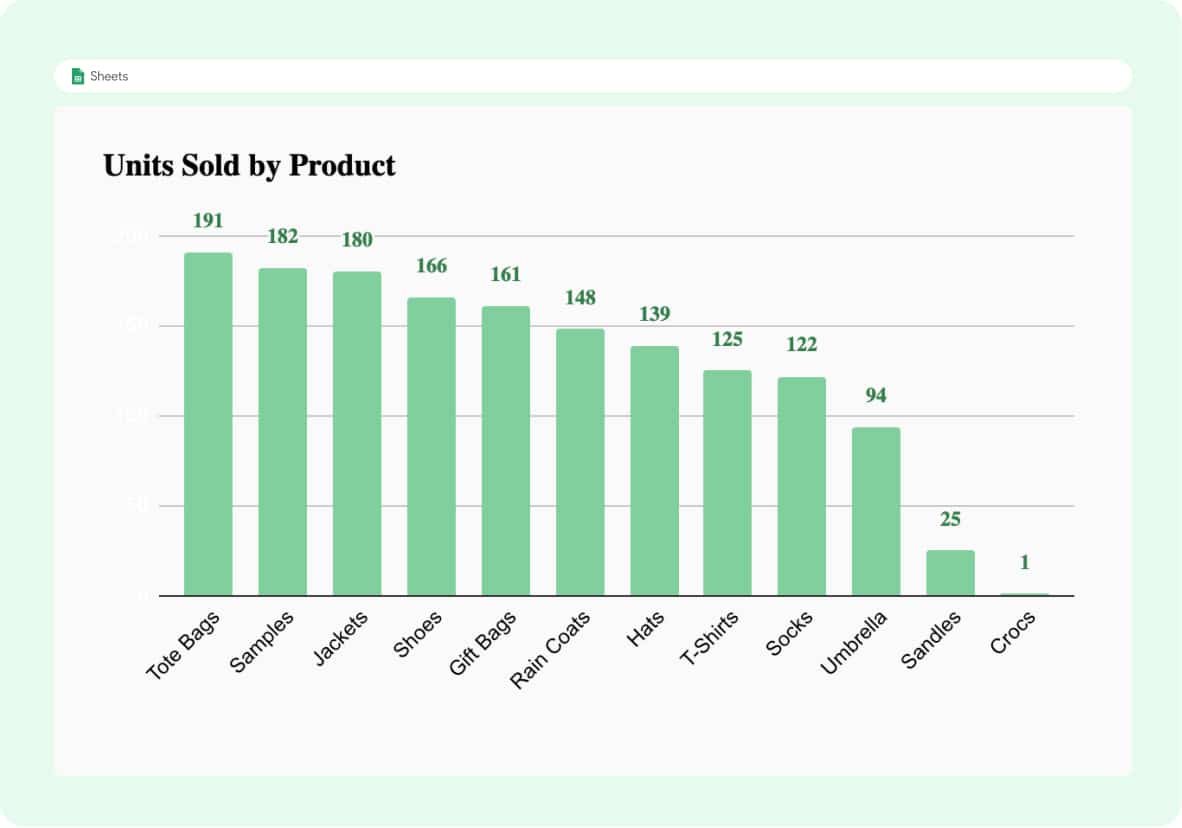
- View Your Sales Data: The “Sales by product” report will show you a detailed breakdown of your sales by each individual product. You can see the total sales for each product, as well as the number of units sold.
You can now filter and sort your data by time period or by product. If you want to analyze your sales data further, you can export the report as a CSV file. Look for the “Export” button at the top of the report, click on it, and choose the “Export as CSV” option. Upload that file to your spreadsheet for further analysis.
Note: Coefficient streamlines this entire process. Simply launch one of our pre-built Shopify reports and dashboards for Google Sheets and connect your live Shopify data in one-click.
Limitations of Shopify Sales Reports
Shopify sales reports, while useful, do have some limitations:
- Inaccurate Metrics: Shopify’s sales report may not always provide accurate metrics. For instance, it may not accurately track customer behavior or provide complete insights on key metrics like Average Order Value (AOV) and Customer Lifetime Value (LTV).
- Limited Customer Reports: Shopify’s customer reports are limited to only 250,000 customers. For businesses with a larger customer base, this can be a significant limitation.
- Cross-Domain and Subdomain Tracking Issues: Shopify’s checkout process sends customers to a Shopify domain (checkout.shopify.com), which can cause visitor sessions to end suddenly, affecting the accuracy of tracking and sales attribution.
- Limited Product Analytics: While Shopify analytics shows how your products performed over the last 90 days, it still has limitations in providing insightful data.
How Can I Create Custom Sales Dashboards?
Most CRMs have built-in dashboards but are rigid, offering little in terms of customization and only a few metrics. For this reason, many choose to create dashboards in Google Sheets.
- Identify Key Metrics: Before you start building your sales dashboard, identify the data points and metrics you want to track. Consider where your data will come from, who the dashboard is for, how often you’ll need to update it, and what specific metrics show up often in your reports.
- Import Your Data: There are multiple ways to import your data into Google Sheets: copy-paste, uploading CSVs – or, even more simply, use Coefficient.
- Build Your Dashboard: A sales dashboard can include many components and sections. Starting with a template you can build on makes things significantly easier. From there you can add custom metrics you wish to track such as total revenue, win ratio, and lost vs. won deals.
- Visualize Your Data: There are a wide variety of charts and graphs you can use to represent your data. Most sales charts are visualized as funnel diagrams, Sankey diagrams, bar charts, or pie charts.
- Format and Organize Your Sales Dashboard: Apply your desired formatting and customizations and organize your charts in a way that best suits users and your target audiences.
Note: Refer to this article for a more detailed walkthrough. Building a customer dashboard is a time-consuming task, which is why Coefficient offers a range of dashboards that can be customized to suit your needs.
What Metrics Should a Shopify E-commerce Store Track?
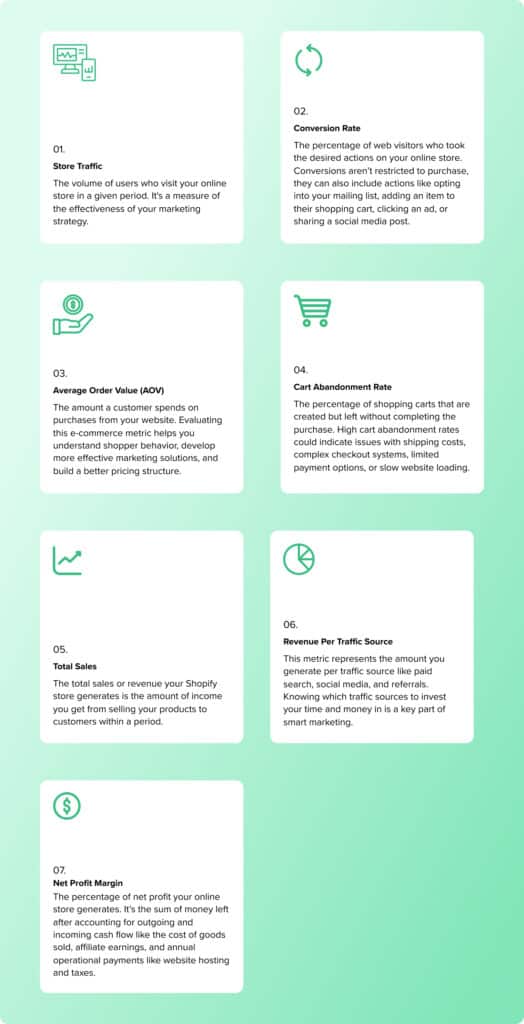
- Store Traffic: The volume of users who visit your online store in a given period. It’s a measure of the effectiveness of your marketing strategy.
- Conversion Rate: The percentage of web visitors who took the desired actions on your online store. Conversions aren’t restricted to purchase, they can also include actions like opting into your mailing list, adding an item to their shopping cart, clicking an ad, or sharing a social media post.
- Average Order Value (AOV): The amount a customer spends on purchases from your website. Evaluating this e-commerce metric helps you understand shopper behavior, develop more effective marketing solutions, and build a better pricing structure.
- Cart Abandonment Rate: The percentage of shopping carts that are created but left without completing the purchase. High cart abandonment rates could indicate issues with shipping costs, complex checkout systems, limited payment options, or slow website loading.
- Total Sales: The total sales or revenue your Shopify store generates is the amount of income you get from selling your products to customers within a period.
- Revenue Per Traffic Source: This metric represents the amount you generate per traffic source like paid search, social media, and referrals. Knowing which traffic sources to invest your time and money in is a key part of smart marketing.
- Net Profit Margin: The percentage of net profit your online store generates. It’s the sum of money left after accounting for outgoing and incoming cash flow like the cost of goods sold, affiliate earnings, and annual operational payments like website hosting and taxes.