Testimonial

"Coefficient's Google Sheets templates are the next step in spreadsheet evolution–connected spreadsheets. Connected sheets mean faster, better, and more accurate analysis by everyone–especially if you can't code!"
Evan Cover
Director, BI Engineering and Governance, Klaviyo
Monitor Win-Loss Rates Effortlessly. Boost Sales Performance Rapidly.
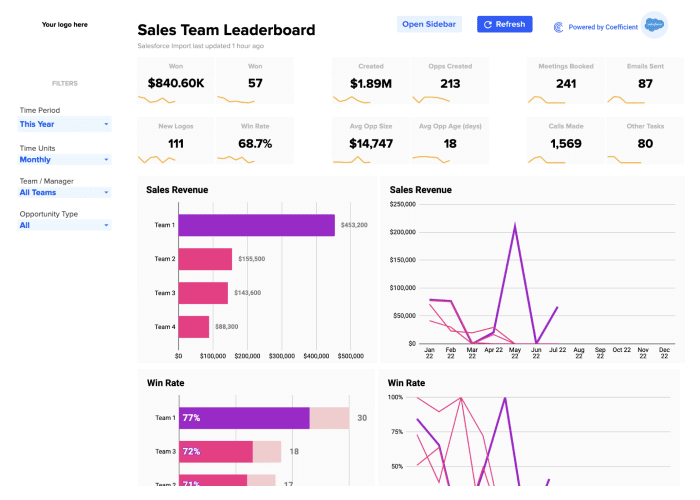
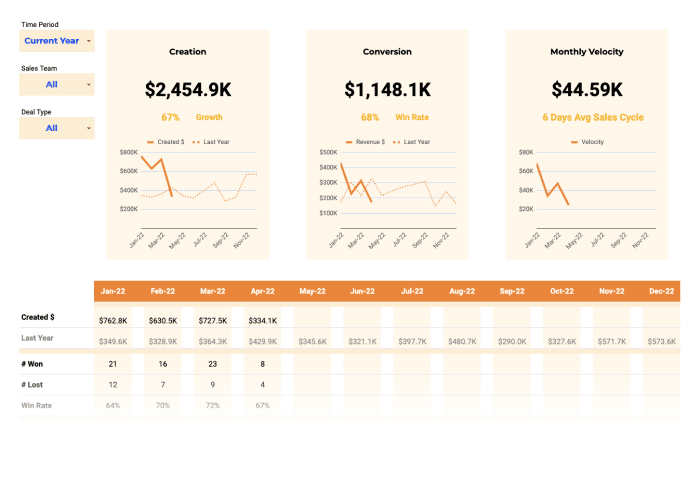
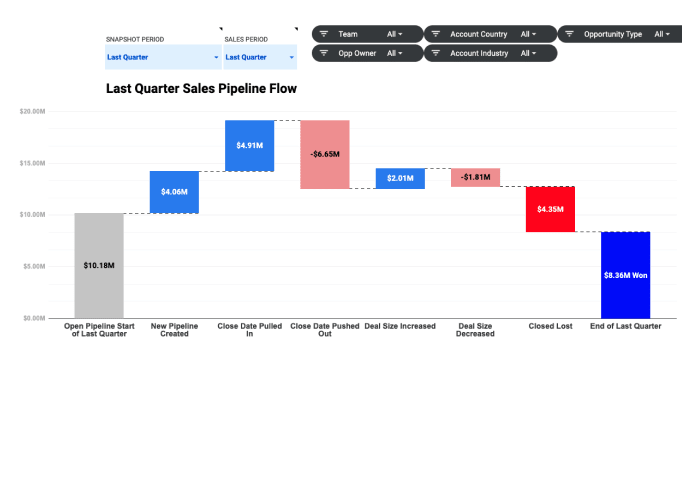
Optimize your sales strategy with our Pipedrive Win-Loss Analysis Dashboard, offering a complete, real-time view of your win-loss rates across multiple factors, all inside Google Sheets.
The Pipedrive Win-Loss Analysis Dashboard empowers you to supercharge your sales operation:
- Monitor win rates across company, team, and individuals over time and swiftly identify performance trends to capitalize on wins or avert losses
- Generate a detailed list of recently lost opportunities, understanding the reasons behind each failure to adjust sales tactics
- Receive instant updates with Slack or email alerts for every won/lost deal, ensuring you stay on top of your sales game
- Save a copy of this template for each sales team leader or for each individual sales rep
Download our Pipedrive Win-Loss Analysis Dashboard to understand deal trajectories and improve your sales strategy.