
In today’s digital marketing landscape, understanding LinkedIn metrics is essential. This guide focuses on the importance of LinkedIn impressions and the benefits of tracking these metrics using Google Sheets.
For marketers looking to enhance their LinkedIn strategy, this information is key to making informed decisions and improving their online presence.
Benefits of Tracking LinkedIn
LinkedIn impressions represent the total number of times your content appears in someone’s feed. This number is crucial as it directly relates to the visibility and reach of your posts.
By monitoring impressions, you gain insights into how often your content is being seen, which is vital for understanding your content’s impact on LinkedIn.
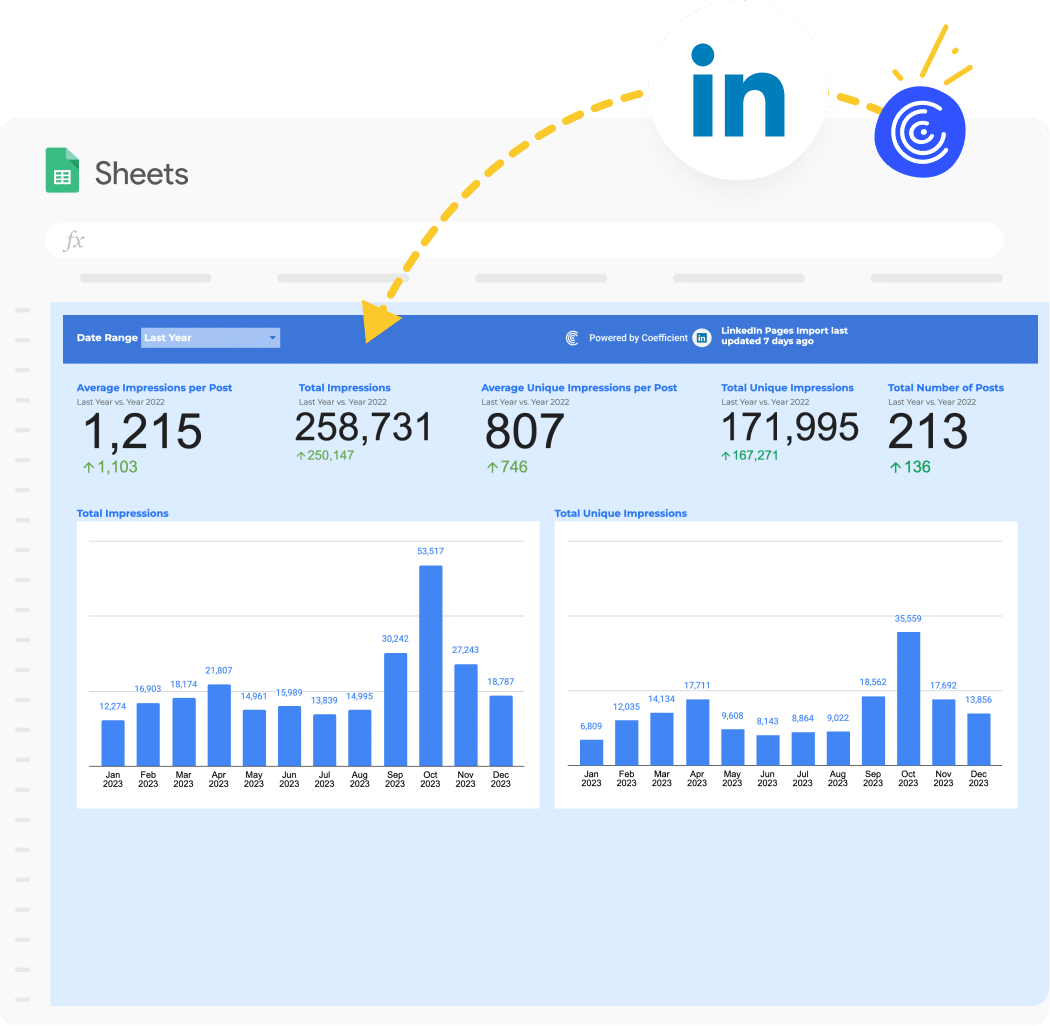
- Impressions per Post: Reflects the total visibility of individual posts, indicating how well each piece of content performs.
- Unique Impressions per Post: This metric offers a more nuanced view, showing how many unique LinkedIn members have seen your post. It’s essential for understanding your actual reach beyond repeated views by the same users.
- Total Impressions: Summarizes the overall visibility of all your content, helping you gauge the broad impact of your LinkedIn presence.
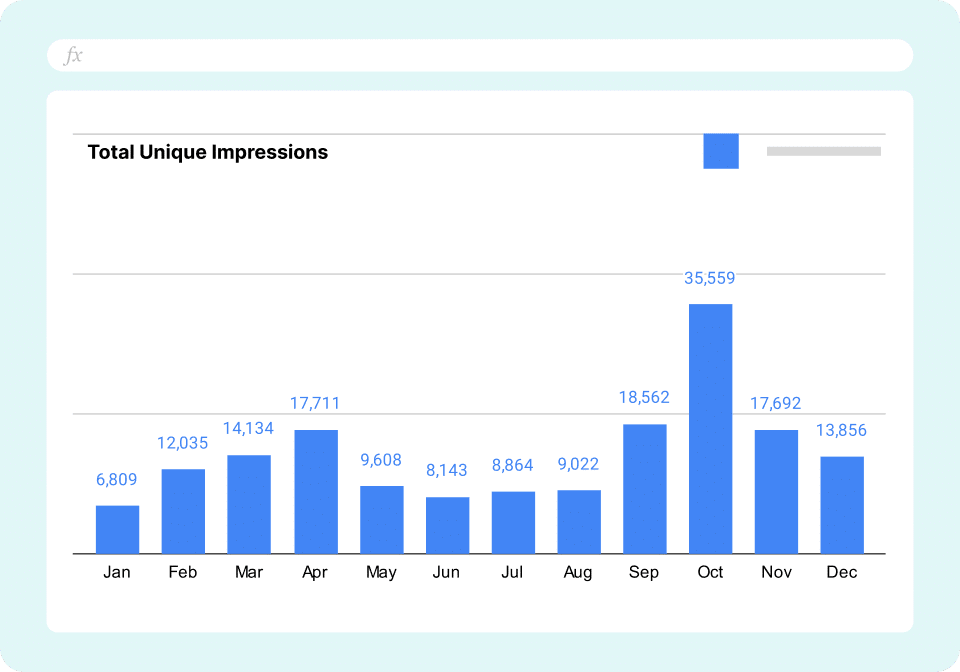
- Total Unique Impressions: This aggregates the unique views across all posts, providing a clearer picture of your diverse audience.
Analyzing Impact
Tracking these metrics allows you to see not just how many people you’re reaching, but also how your audience interacts with your content.
You can identify trends and patterns, such as what type of content resonates most with your audience or what times yield the highest impressions. This data helps in making informed decisions about content strategy, enhancing both engagement and visibility.
Strategic Posting and Engagement
Understanding when your audience is most active on LinkedIn allows you to optimize your posting schedule for maximum impact.
By aligning your posts with peak activity times, you increase the likelihood of higher impressions and engagement. Regular monitoring of impressions helps in fine-tuning your posting strategy to match audience preferences.
Impressions vs. Views vs. Reach
It’s important to differentiate between these metrics:
- Impressions: The total number of times your content appears on screens.
- Views: In the context of videos and articles, views are counted when a user engages with the content for a specified duration or clicks to read an article.
- Reach: Often synonymous with unique impressions, reach measures the number of unique users who have seen your content.
Advantages of Tracking LinkedIn Impressions in Google Sheets
Centralized Data Management
Using Google Sheets to track LinkedIn impressions brings the advantage of centralized data management. It allows marketers to consolidate data from various campaigns into one easily accessible location.
This centralization simplifies the process of comparing different metrics, identifying trends, and making data-driven decisions.
- Integration with LinkedIn Analytics: Google Sheets can be seamlessly integrated with LinkedIn Analytics, enabling automatic data import. This reduces manual entry errors and saves time.
- Historical Data Analysis: It allows for the storage and analysis of historical data, providing a comprehensive view of performance over time.
Customizable Analysis
One of the primary benefits of Google Sheets is its high degree of customization. Marketers can create custom dashboards and reports tailored to their specific needs.
- Personalized Dashboards: Users can design dashboards that highlight the metrics most relevant to their goals.
- Advanced Data Manipulation: Google Sheets offers advanced functions for data sorting, filtering, and visualization, enabling deeper insights into LinkedIn metrics.
Ease of Sharing and Collaboration
Google Sheets facilitates collaboration among team members, regardless of their location. This feature is especially beneficial for marketing teams that need to work together on content strategies and review performance metrics.
- Real-Time Collaboration: Multiple users can work on the same document simultaneously, making it easier to update and share insights in real time.
- Access Control and Sharing: Users can control who has access to the data, ensuring sensitive information remains secure while still being collaborative.
Real-time Updates and Accessibility
The ability to update data in real time and access it from anywhere is crucial for timely decision-making in the fast-paced world of social media marketing.
- Automatic Updates: Data can be set to update automatically, ensuring that the latest information is always available.
- Accessibility Across Devices: Google Sheets can be accessed from any device with an internet connection, providing flexibility and convenience for users.
Conclusion
tracking LinkedIn impressions in Google Sheets provides marketers with critical insights for strategic decision-making. It’s a straightforward approach to understanding audience engagement and optimizing content performance.
Download Coefficeint’s LinkedIn Impressions template for Google Sheets today to streamline your tracking process and elevate your LinkedIn strategy.
