Google Ads reporting often involves manual data extraction and time-consuming analysis. Third-party reporting tools simplify this process with automated data collection, customizable dashboards, and advanced analytics. Here are the top Google Ads reporting tools to boost your advertising performance and save time.
Google Ads Reporting Tools Side-by-Side
| Feature | Coefficient | Looker Studio | Tableau | Power BI | Whatagraph |
| Row Limits / Export Limits | Unlimited (Pro) | 100M rows | Unlimited | 1M rows (Free) | 1M rows |
| Data Sources | 50+ | 800+ | 100+ | 100+ | 40+ |
| Builder License Cost | $99/mo | Free | $75/mo | $10/mo | $223/mo |
| Viewer License Cost | Free | Free | $15/mo | Free | Included |
| AI Functionality | Yes | Limited | Yes | Yes | No |
| Refresh Frequency | Hourly | Daily | Real-time | 8/day (Free) | Daily |
| Alerts | Yes | No | Yes | Yes | Yes |
| Security | SOC 2 Type II | Google Cloud | SOC 2 Type II | SOC 2 Type II | SOC 2 Type I |
1. Coefficient: Seamless Google Ads Data Integration for Spreadsheets

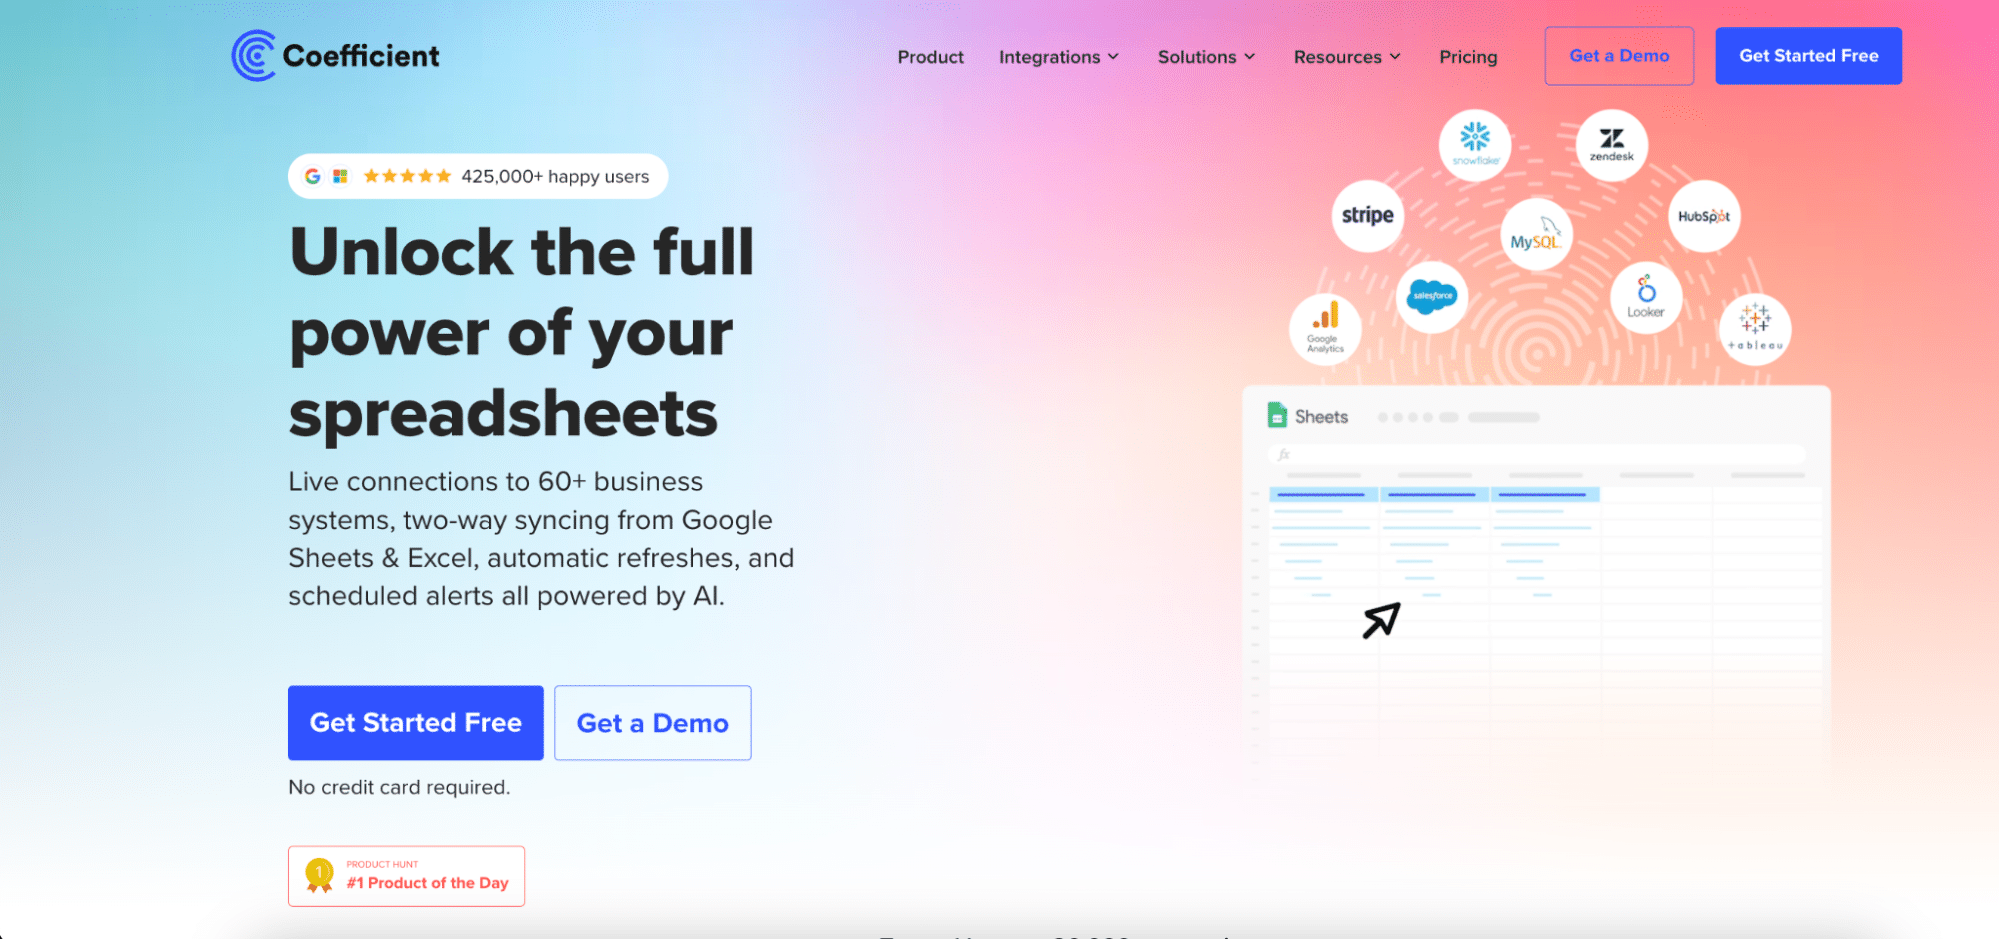
Coefficient is a powerful Google Ads reporting tool that integrates directly with Google Sheets and Excel. It offers real-time data syncing, automated report distribution, and the ability to push data back to source systems, making it suitable for businesses of all sizes.
Highlights of Coefficient
- Direct integration with Google Ads and 50+ other data sources
- Real-time data refresh and automated report distribution
- Customizable dashboards and templates for quick reporting
Pros
- Seamless spreadsheet integration: Coefficient’s native integration with Google Sheets and Excel allows users to work with familiar tools while accessing real-time Google Ads data.
- Automated workflows: Set up automatic data refreshes and report distribution to save time and ensure stakeholders always have access to the latest information.
- Customizable reporting: Create tailored reports and dashboards that align with your specific KPIs and business objectives.
Cons
- Learning curve: While user-friendly, new users may need some time to fully utilize all of Coefficient’s features and capabilities.
- Dependency on spreadsheets: Users who prefer standalone BI tools might find the spreadsheet-based approach limiting for certain advanced analytics tasks.
Pricing
As of August 2024, Coefficient offers the following pricing tiers:
- Free Plan: $0/month (up to 3 data sources, 5,000 rows, 50 manual refreshes/month)
- Starter Plan: $49/month (3 data sources, 500 refreshes/month)
- Pro Plan: $99/month per user (6 data sources, unlimited imports, hourly refreshes)
- Enterprise Plan: Custom pricing (fully customized solutions)
What do users say about Coefficient?
Positive review: “Coefficient has revolutionized our Google Ads reporting process. The ability to automatically refresh data in our spreadsheets has saved us hours each week and improved our decision-making.” – Sarah T., Marketing Manager (Source: G2)
Critical review: “While Coefficient is great for spreadsheet users, it took our team some time to fully leverage all its features. A steeper learning curve than expected.” – Michael R., PPC Specialist (Source: Google Workspace Marketplace)
Support
Coefficient offers tiered support options:
- Standard Support: Available for all plans, includes email support during business hours and access to online resources.
- Premium Support: Available for higher-tier plans, offers faster response times and priority support via phone or chat.
- Enterprise Support: Included with the Enterprise Plan, provides 24/7 support with a dedicated technical account manager.
2. Looker Studio: Google’s Free Data Visualization Platform

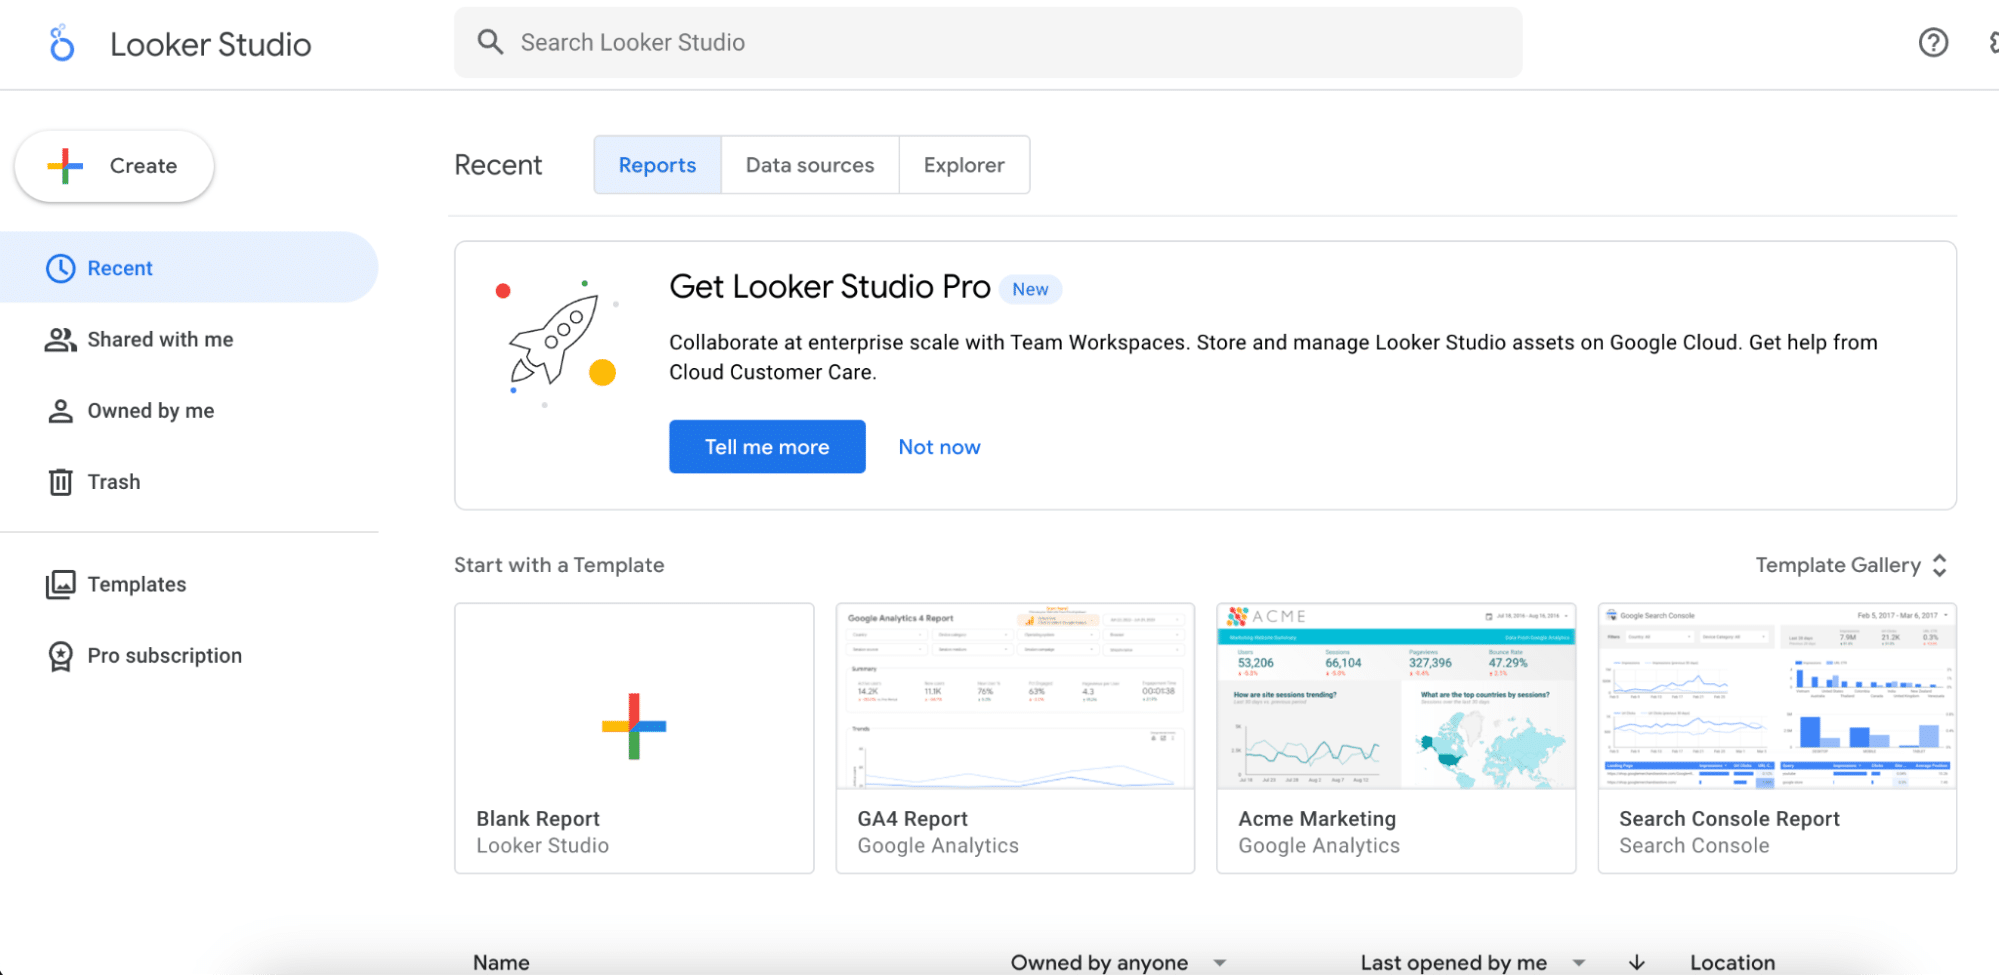
Looker Studio (formerly Google Data Studio) is a free data visualization tool that offers robust Google Ads reporting capabilities. It’s part of the Google ecosystem and provides an intuitive interface for creating interactive dashboards and reports.
Highlights of Looker Studio
- Native integration with Google Ads and other Google services
- Drag-and-drop report builder for easy customization
- Collaborative features for team-based reporting
Pros
- Cost-effective solution: As a free tool, Looker Studio offers significant value for businesses of all sizes looking to visualize their Google Ads data.
- Seamless Google integration: Direct connection to Google Ads and other Google services ensures easy data access and real-time updates.
Cons
- Limited advanced features: Some users may find the free version lacking in advanced analytics capabilities compared to paid alternatives.
- Learning curve for non-Google users: Those unfamiliar with Google’s ecosystem might need time to adapt to Looker Studio’s interface and functionality.
Pricing
As of August 2024, Looker Studio offers the following pricing tiers:
- Looker Studio (Free Version): $0
- Looker Studio Pro: Starts at $9 per user per month
- Custom Enterprise Plans: Pricing varies based on usage and organizational needs
What do users say about Looker Studio?
Positive review: “Looker Studio has transformed our Google Ads reporting. The ability to create visually appealing dashboards for free is a game-changer for our small business.” – Emily L., Digital Marketing Coordinator (Source: G2)
Critical review: “While Looker Studio is great for basic reporting, we found it lacking in some advanced features we needed for in-depth PPC analysis.” – Alex K., PPC Manager (Source: TrustRadius)
Support
Looker Studio provides the following support options:
- Standard Support: Included with Free and Pro versions, offering online support via help center and community forums.
- Premium Support: Available with Enterprise Plans, including priority access to Google Cloud Customer Care and dedicated account management.
3. Tableau: Powerful Data Visualization for Advanced Users

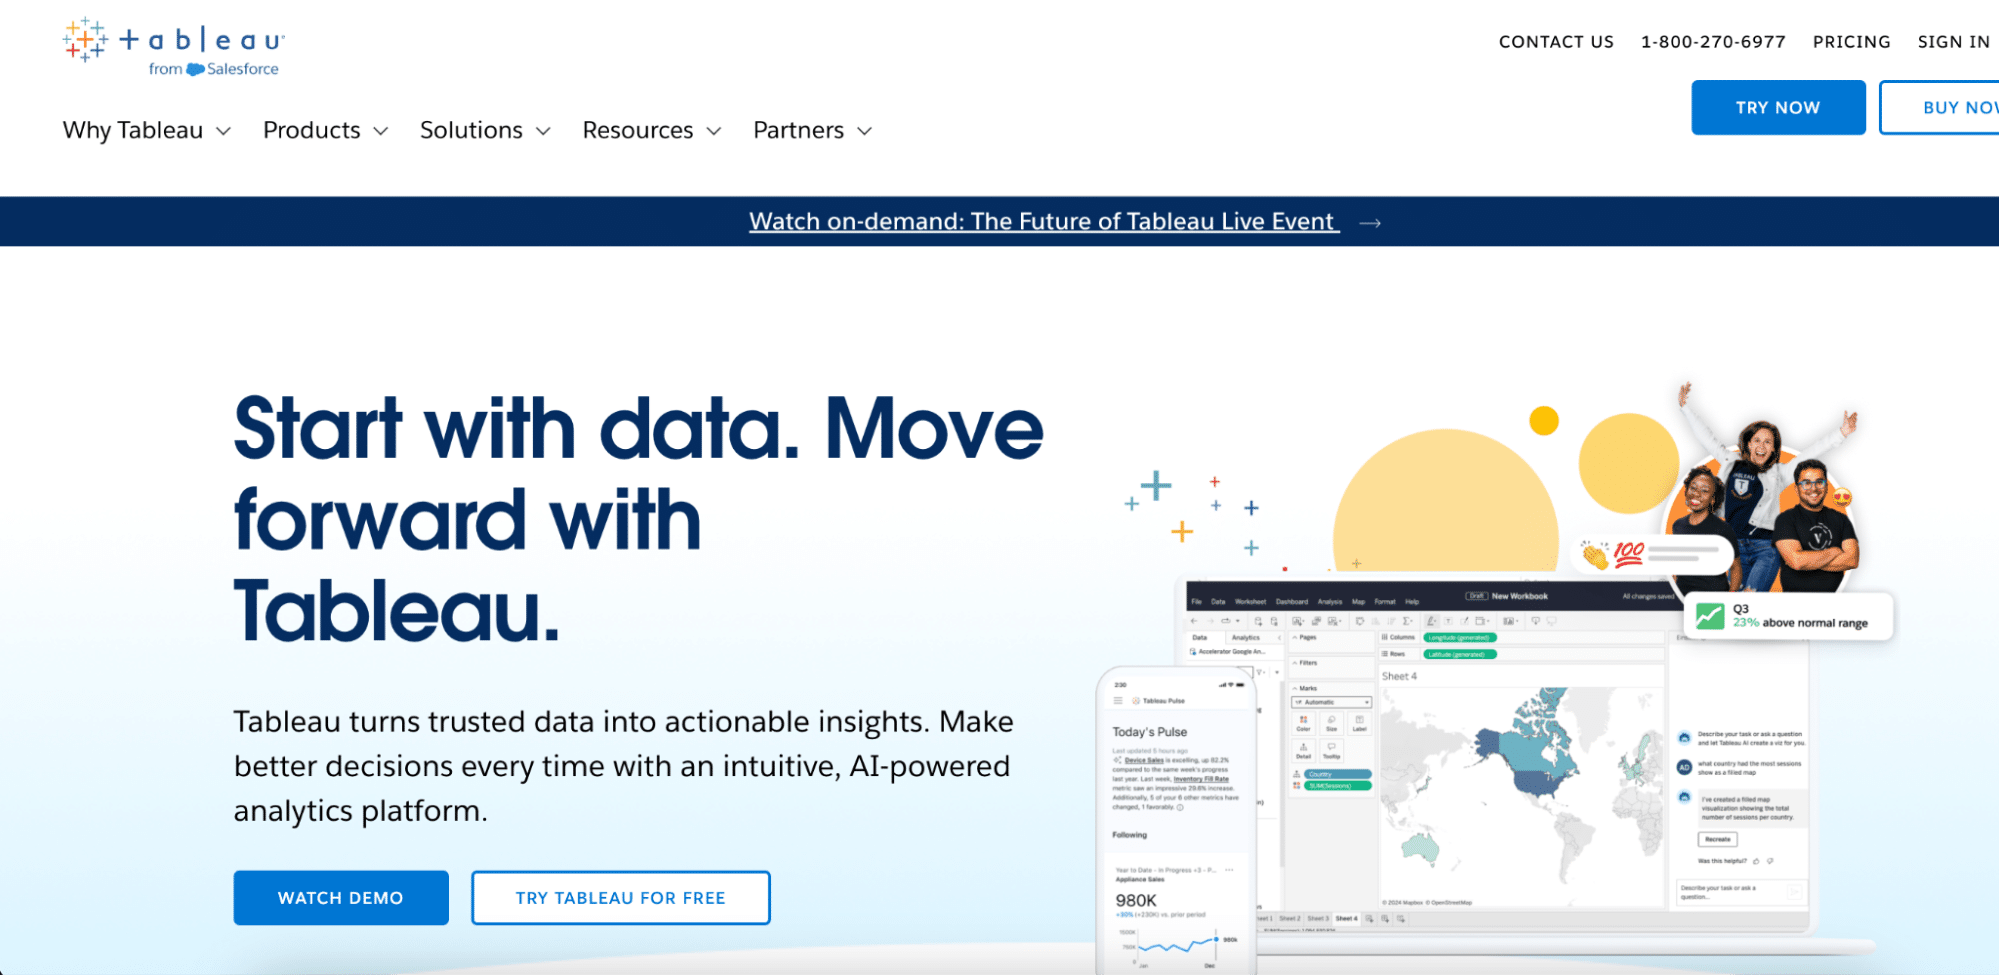
Tableau is a comprehensive business intelligence tool that offers extensive Google Ads reporting capabilities alongside advanced data analysis features. It’s designed for larger organizations with complex reporting needs and users who require deep analytical capabilities.
Highlights of Tableau
- Advanced data visualization capabilities
- Powerful data blending and analysis features
- Extensive customization options for reports and dashboards
Pros
- Comprehensive analytics: Tableau offers advanced data analysis features that go beyond basic Google Ads reporting, allowing for deeper insights.
- Scalability: Suitable for businesses of all sizes, from small teams to large enterprises with complex data needs.
Cons
- Steep learning curve: Tableau’s powerful features come with a steeper learning curve, which may be challenging for new users.
- Higher cost: Compared to some alternatives, Tableau can be more expensive, especially for smaller businesses or individual users.
Pricing
As of August 2024, Tableau offers the following pricing tiers:
- Tableau Creator: $75 per user per month (billed annually)
- Tableau Explorer: $42 per user per month (billed annually)
- Tableau Viewer: $15 per user per month (billed annually)
- Enterprise Plans: Custom pricing for large deployments
What do users say about Tableau?
Positive review: “Tableau has revolutionized our Google Ads reporting. The depth of analysis and customization options are unparalleled.” – David R., Business Intelligence Analyst (Source: G2)
Critical review: “While Tableau is powerful, it took our team several months to become proficient. The learning curve is steep for non-technical users.” – Lisa M., Marketing Director (Source: TrustRadius)
Support
Tableau provides the following support options:

Stop exporting data manually. Sync data from your business systems into Google Sheets or Excel with Coefficient and set it on a refresh schedule.
Get Started
- Standard Support: Included with all licenses, offering access to online resources and basic email/chat support.
- Premium Support: Available with Enterprise Plans, providing 24/7 technical support and a dedicated account manager.
- Advanced Management: Add-on for Enterprise Plans with enhanced security and compliance features.
4. Power BI: Microsoft’s Comprehensive Business Analytics Solution

Power BI is Microsoft’s business analytics tool that offers robust Google Ads reporting capabilities alongside a wide range of data analysis features. It integrates seamlessly with other Microsoft products and provides AI-powered insights for data analysis.
Highlights of Power BI
- Seamless integration with Microsoft ecosystem
- AI-powered insights and natural language querying
- Extensive data modeling capabilities
Pros
- Microsoft integration: Power BI works seamlessly with other Microsoft products, making it an excellent choice for businesses already invested in the Microsoft ecosystem.
- AI-driven insights: Leverages AI to uncover hidden patterns and provide automated insights from Google Ads data.
Cons
- Complex for beginners: Power BI’s extensive features can be overwhelming for users new to data analysis and visualization.
- Limited free version: The free version has restrictions on sharing and collaboration, which may not be suitable for team-based reporting.
Pricing
As of August 2024, Power BI offers the following pricing tiers:
- Power BI Free: $0 per user per month
- Power BI Pro: $10 per user per month
- Power BI Premium Per User: $20 per user per month
- Power BI Premium Per Capacity: Starts at $4,995 per capacity per month
- Power BI Embedded: Variable pricing based on usage
What do users say about Power BI?
Positive review: “Power BI has transformed our Google Ads reporting. The ability to create interactive dashboards and perform deep data analysis in one tool is invaluable.” – Mark S., Data Analyst (Source: G2)
Critical review: “While Power BI is powerful, we found the learning curve to be steep. It took our team considerable time to fully leverage its capabilities for Google Ads reporting.” – Rachel K., Marketing Manager (Source: TrustRadius)
Support
Power BI provides the following support options:
- Standard Support: Available with all plans, including access to Microsoft knowledge base and community forums.
- Priority Support: Available for Premium and Enterprise plans, offering faster response times and dedicated support channels.
5. Whatagraph: Streamlined Agency-Focused Reporting Tool

Whatagraph is a reporting tool designed specifically for marketing agencies and professionals. It offers simplified Google Ads reporting with a focus on client-ready presentations and automated report generation, catering to the unique needs of agency workflows.
Highlights of Whatagraph
- Agency-focused features like white-labeling and client management
- Pre-built report templates for quick setup
- Automated report scheduling and distribution
Pros
- Agency-friendly: Whatagraph’s features are tailored for agency use, including white-labeling and client management tools.
- Easy setup: Pre-built templates and intuitive interface allow for quick report creation, ideal for users who need to generate reports quickly.
Cons
- Limited customization: Compared to more robust BI tools, Whatagraph may offer fewer options for advanced customization and data analysis.
- Higher cost for small teams: The pricing structure may be less cost-effective for very small teams or individual users.
Pricing
As of August 2024, Whatagraph offers the following pricing tiers:
- Essential Plan: $223 per month (billed annually)
- Advanced Plan: $335 per month (billed annually)
- Custom Plan: Custom pricing
What do users say about Whatagraph?
Positive review: “Whatagraph has streamlined our Google Ads reporting process. The pre-built templates and automated scheduling save us hours each week.” – Jessica L., Agency Account Manager (Source: G2)
Critical review: “While Whatagraph is great for quick reports, we found it lacking in some advanced analysis features we needed for in-depth Google Ads performance evaluation.” – Tom R., PPC Specialist (Source: Capterra)
Support
Whatagraph provides the following support options:
- Standard Support: Included with all plans, offering live chat and access to help center resources.
- Priority Support: Available with Advanced and Custom plans, providing faster response times and personalized onboarding.
Choosing the Right Google Ads Reporting Tool for Your Needs
Selecting the ideal Google Ads reporting tool depends on your specific requirements, budget, and technical expertise. Coefficient offers a balance of powerful features and user-friendly interface, making it an excellent choice for businesses seeking seamless spreadsheet integration and automated workflows. For a firsthand experience of how Coefficient can transform your Google Ads reporting, start your free trial today.

