AI was supposed to end the data problem. You bought the tools, migrated to the cloud, hired the analysts. Yet your CFO and your CRO walked into last quarter’s board meeting with two different ARR numbers. Your FP&A team is still on version seven of a forecast model last refreshed three weeks ago. And the revenue dashboard your ops lead built looks nothing like the one finance owns.
The spreadsheet stack that was supposed to be replaced is still running the business. The difference is it is now disconnected from more systems than ever.
Here is the uncomfortable truth: the problem was never spreadsheets. The problem is disconnected spreadsheets. Every CSV export, every manual copy-paste, every schedule-based report that runs once a week and sits stale for six days is a broken link in what should be a live data chain. In 2026, with AI tools feeding on your financial data to build forecasts and surface anomalies, those broken links do not just slow you down. They poison the output.
This article covers exactly what financial data silos are costing you, why they are not just a technology problem, and five practical steps to eliminate them without asking your finance team to abandon the tools they already use.
- What Financial Data Silos Are Actually Costing You
- Why Financial Silos Are Different from Every Other Kind
- The Six Root Causes of Financial Data Silos
- Five Steps to Eliminate Financial Data Silos Without Replacing Your Spreadsheets
- Where AI Fits and Where It Breaks Without Unified Data
- What Teams Who Have Done This Are Saying
- The Bottom Line
What Financial Data Silos Are Actually Costing You
Research puts the average cost of data silos at $7.8 million per year in lost productivity for mid-size organizations. That number includes duplicated analysis, delayed decisions, and manual reconciliation work that never should have existed in the first place. IDC data shows that data professionals spend 30% of their working week doing nothing but chasing and cleaning data caused by disconnected systems.
For finance teams, the cost compounds in three specific ways.
Duplicated analysis
When your finance team cannot access the same data as RevOps, they build their own version. RevOps builds theirs. The VP of Sales builds a third. Each team spends hours every week maintaining a model that is, at best, slightly different from the others. When those models produce different outputs, the disagreement burns meeting time, erodes trust, and delays decisions.
Delayed decisions
A financial model refreshed weekly is already four days stale by Wednesday. A pipeline report exported on Monday is fiction by Thursday as deals move, close or drop. Fast-moving businesses cannot make confident decisions from last week’s data, but that is exactly what most finance and RevOps teams are working with on any given day.
Broken AI pipelines
This is the cost that barely existed three years ago and now defines the AI era. Every AI forecasting tool, anomaly detector and natural language query engine you have bought or are considering runs on your financial data. Feed it siloed, stale, inconsistent data and it produces siloed, stale, inconsistent outputs, with confidence. The model does not know your NetSuite export from last Tuesday does not match your Salesforce numbers from this morning. It trusts whatever you feed it.
Why Financial Silos Are Different from Every Other Kind
Marketing silos hurt campaign reporting. Operations silos slow down logistics. Financial data silos do something more damaging: they undermine the single source of truth that everyone in the organization is supposed to be steering by.
Consider three scenarios that play out in finance teams every quarter.
The board meeting number problem
Finance closes the books and produces an ARR number. RevOps has a pipeline report that implies a different number. Sales leadership has a forecast built from a model they maintain independently. All three are defensible. All three are wrong in relation to each other. The CFO has to decide which one to present, knowing someone in the room will push back with a different figure from their own spreadsheet.
The stale model problem
An FP&A analyst builds a revenue forecast in Excel. It is excellent work: detailed assumptions, scenario logic, well-structured formulas. But it was last refreshed ten days ago because the underlying data has to be manually exported from three systems. By the time the model is presented, the assumptions are already outdated. The forecast is a snapshot of a world that no longer exists.
The AI confidence problem
Your team starts using an AI forecasting tool. It connects to your data warehouse. It runs a model. It produces a projection with a confidence interval and a clean visualization. What it does not tell you is that the underlying data it consumed was an export from last Tuesday, that the Salesforce opportunities table and the NetSuite revenue table use different definitions of Closed Won, and that two of the largest deals in the pipeline had stage changes after the last export ran. The output looks authoritative. The input was siloed data dressed up as truth.
The Six Root Causes of Financial Data Silos
Financial data silos do not appear because teams are careless. They appear because the default behavior of every system in the stack is to hold its data separately, and because the default behavior of every analyst is to export that data into a spreadsheet to work with it. These six patterns are behind almost every finance silo we see.
The CSV export habit
Every time someone downloads a report from Salesforce, NetSuite or QuickBooks to analyze in a spreadsheet, they create a frozen copy of the data at that moment in time. The original system moves on. The spreadsheet does not. That export is a silo the moment it leaves the system.
No unified import method
Finance teams typically connect to different systems using different methods: one tool for the CRM, another for the ERP, a manual process for the data warehouse. Because each connection works differently, data never lands in the spreadsheet in a consistent format, and combining it requires manual work every time.
Per-user and per-connection pricing
Many data connector tools charge per connection or per seat. This pushes teams to connect as few systems as possible and share access as little as possible. The pricing model creates the silo by making it expensive to eliminate it.
Manual refresh cycles
A connected spreadsheet that requires someone to click refresh is not much better than a CSV. If the refresh depends on a person remembering to do it, the data is stale within hours. Finance teams running weekly reporting cycles are working with data that is up to six days old at the moment of use.
Spreadsheet sprawl
Every analyst builds their own model. Every team maintains their own version. Without a single canonical model connected to live sources, the number of slightly different versions multiplies until no one can agree on which one is right. Each version is its own silo.
Session-based AI tools
Tools like ChatGPT and Claude can connect to a data warehouse for one-off analysis. But those sessions are not persistent. They do not maintain live, scheduled, governed data pipelines. Close the laptop and the connection ends. The next session starts fresh, often from a different snapshot. Session-based AI is not a substitute for a persistent, scheduled data layer.
Five Steps to Eliminate Financial Data Silos Without Replacing Your Spreadsheets
The answer is not to abandon spreadsheets. Finance teams run on them. The flexibility, the formula logic, the ability to model scenarios and share results: none of that exists in a BI tool dashboard. The answer is to connect the spreadsheets your team already uses to every system they depend on, and keep that connection live.
Here is how to do it in five steps.
Step 1: Replace every CSV export with a live connector
Audit every recurring data export your finance or RevOps team runs each week: Salesforce pipeline reports, NetSuite GL exports, QuickBooks P&L downloads. Each one is a silo in waiting. Replace each export with a direct live connection from the source system to the spreadsheet.
Coefficient connects 150+ business systems, including Salesforce, HubSpot, QuickBooks, Snowflake and NetSuite, directly to Google Sheets and Excel. No export, no intermediary, no frozen copy. The data in the spreadsheet is the data in the system.

Step 2: Set refresh schedules that match data velocity
A live connection without a scheduled refresh still goes stale. The key is matching refresh frequency to how fast the underlying data moves. Pipeline data changes daily: refresh daily or hourly. Financial period-close data moves monthly: a scheduled monthly snapshot is sufficient. Coefficient supports refresh schedules from hourly to weekly, configurable per import.

The goal is a spreadsheet that is never more than one refresh cycle behind the source system, without anyone having to remember to update it.
Step 3: Pull every system into one spreadsheet
Connecting one system is a start. Breaking silos means connecting all of them. A finance team that pulls Salesforce pipeline, NetSuite actuals and QuickBooks cash flow into three separate tabs of one spreadsheet has already built something more useful than any single-system export.
Each import lands in its own tab. A summary or dashboard tab pulls from all of them using standard spreadsheet formulas. The result is a unified financial view that updates automatically on the schedule you set, without anyone stitching exports together by hand.

Stop exporting data manually. Sync data from your business systems into Google Sheets or Excel with Coefficient and set it on a refresh schedule.
Get Started
Step 4: Enable two-way sync so the spreadsheet is not a dead end
A spreadsheet that only reads from source systems is still a one-way tool. When finance makes an adjustment: correcting a deal stage, updating a budget line, flagging an exception, that change needs to flow back to the system of record. Otherwise the spreadsheet and the source system drift apart immediately.
Coefficient’s write-back capability lets teams push changes from the spreadsheet back to Salesforce, HubSpot, QuickBooks, Snowflake and other systems directly. The spreadsheet becomes a two-way interface, not a read-only export.
Step 5: Publish a single shared live dashboard so everyone sees the same number
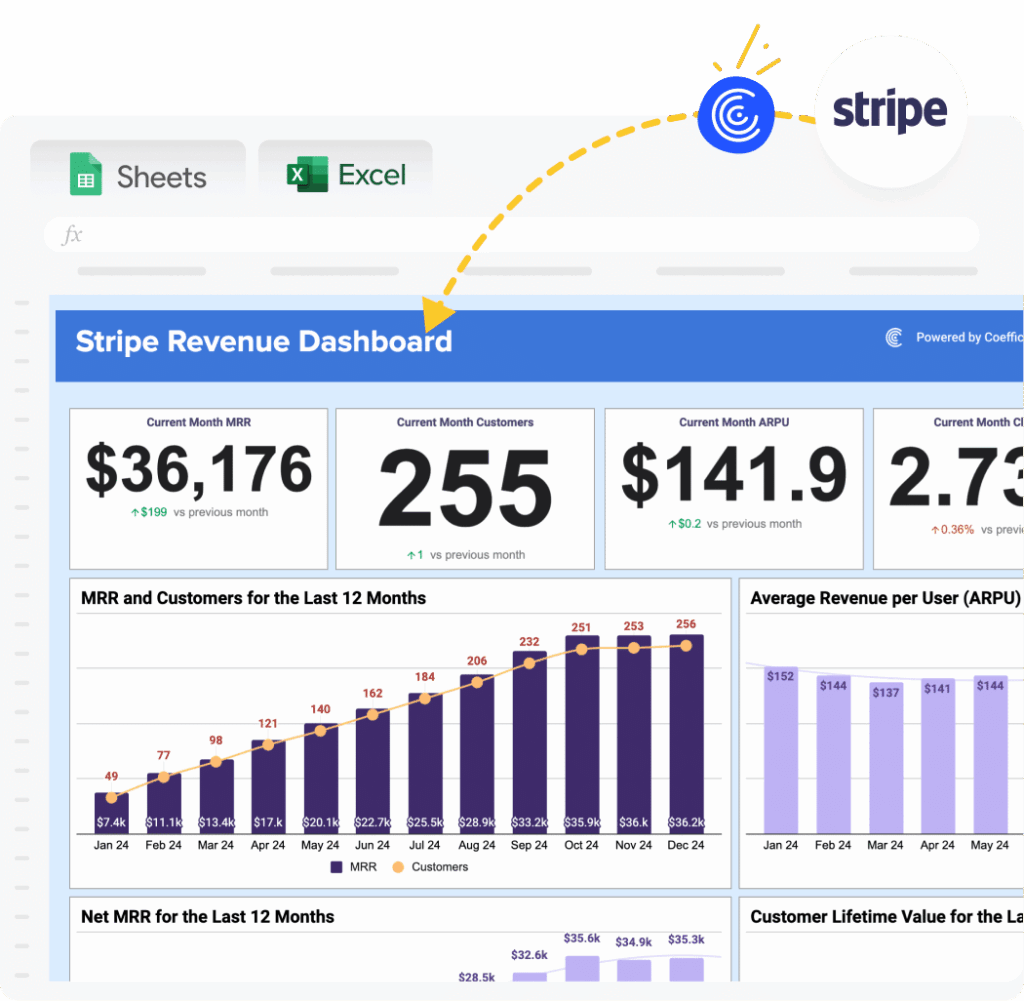
The final step is the one that eliminates the board meeting number problem. Coefficient’s Live Web Dashboard feature turns any connected spreadsheet into a shareable web dashboard that updates on whatever schedule the underlying imports are set to. The CFO, the CRO, the VP of Sales and the FP&A team all see the same number from the same source. No more version debates. No more ‘which spreadsheet is current.’ One URL, always live.
For teams starting with a template, Coefficient’s dashboard library includes pre-built financial and revenue dashboards that connect directly to your existing data sources.
Where AI Fits and Where It Breaks Without Unified Data
Finance teams are being asked to get more from AI: better forecasts, faster anomaly detection, natural language querying of financial data. All of it depends on one thing: the data the AI is fed.
AI tools that run on siloed data do not produce better insights. They produce more confident versions of the wrong answer. A forecasting model trained on last week’s Salesforce export and last month’s NetSuite close will produce projections that look precise but are built on a foundation of inconsistency. The model cannot tell you what it does not know. It will not flag that the two datasets it consumed used different cutoff dates.
The prerequisite for useful AI in finance is a governed, live, unified data layer. That layer does not have to live in a data warehouse to be useful. It can live in a connected spreadsheet that refreshes on a schedule and feeds a shared dashboard.
| For organizations investing in Snowflake’s Context Layer, specifically defining Semantic Views with standardized metrics and dimensions, the governance problem goes deeper. Business users who cannot write SQL will bypass those governed definitions entirely, exporting raw data and building their own version of the truth in Excel. Coefficient surfaces Snowflake Semantic Views directly inside Google Sheets and Excel through a visual Metrics and Dimensions picker. Business users select the metrics they need, Coefficient generates the correct query automatically, and the governed definitions stay intact end to end. |
This is the last-mile problem that most AI tools are not solving. Session-based AI connections to your data warehouse are useful for one-off exploration. They are not a substitute for a persistent, scheduled, governed data pipeline that every stakeholder can access from the same live source.
What Teams Who Have Done This Are Saying
The pattern is consistent across companies that have moved from manual exports to live connected spreadsheets: the first thing they recover is time, and the second thing they recover is trust in the numbers.
“Coefficient’s scheduled refreshes are the standout feature for me. Once a connection is set up, the data reliably stays current without manual intervention. I trust it to alert me if something needs attention. If a refresh fails or a connection needs attention, I know immediately — I don’t spend time worrying about whether the integration is silently broken, which is a big deal for operational reporting.”
— Jacob R., G2 (5 stars) — Revenue operations, HubSpot and Google Sheets
“The live data sync between Google Sheets and QuickBooks and Stripe saves me hours every week. Instead of exporting and manually reconciling reports, everything updates automatically and stays structured inside our models. As someone who builds detailed cash flow forecasts, variance dashboards, and reconciliation trackers, Coefficient has made the process significantly more efficient and reliable.”
— DanGhim, QuickBooks App Store — Finance and accounting workflows
“We’ve been using Coefficient to sync Salesforce, Google Sheets, and Slack, and it has proven to be incredibly efficient. The automation capabilities have significantly improved our reporting accuracy, saving us time and effort.”
— Earl Olson, Leverage Companies — Salesforce AppExchange
The Bottom Line
Eliminating financial data silos in the AI era is not about buying a new analytics platform or replacing the spreadsheets your finance team runs on. It is about connecting those spreadsheets to every system they depend on, keeping the data live, and making the output available to every stakeholder from one shared source.
The five steps: replace exports with live connectors, set automated refresh schedules, unify all sources into one spreadsheet, enable two-way sync, and publish a shared live dashboard. are achievable without a data engineering team, without an ETL pipeline, and without asking anyone to learn a new tool.
Coefficient is not a standalone BI platform and requires Google Sheets or Excel as the working environment. For finance and RevOps teams who already live in spreadsheets, that is exactly the point.
Start connecting your financial data today: coefficient.io/get-started


