Calculating statistical measures is a crucial part of data analysis, and the STDEV.S function in Excel is a powerful tool for determining the sample standard deviation of a dataset.
Whether you’re a data analyst, a researcher, or simply someone who needs to analyze numerical information, understanding how to use the STDEV.S function can provide valuable insights and help you make more informed decisions.
In this comprehensive guide, we’ll explore the basics of the STDEV.S function, how to use it in Excel, and the key differences between it and its counterpart, STDEV.P.
STDEV.S Function 101: The Basics
The STDEV.S function in Excel is used to calculate the sample standard deviation of a dataset. Standard deviation is a statistical measure that quantifies the amount of variation or dispersion of a set of values from the mean. In other words, it tells us how much the individual data points in a sample tend to deviate from the sample’s mean.
The formula for the STDEV.S function is:
=STDEV.S(number1, [number2], …)
Where number1, number2, and so on, are the values you want to calculate the sample standard deviation for.
The key difference between the STDEV.S and STDEV.P functions is that STDEV.S calculates the sample standard deviation, while STDEV.P calculates the population standard deviation. We’ll explore the differences between these two functions in more detail later in this guide.
How to Use the STDEV.S Function in Excel
Using the STDEV.S function in Excel is a straightforward process. Here’s a step-by-step guide with screenshots to help you get started:
- Select the cell where you want the STDEV.S result to appear.
- Type the formula =STDEV.S( and then select the range of cells containing the values you want to calculate the sample standard deviation for.

- Close the formula with a closing parenthesis ).
- Press Enter, and the STDEV.S result will be displayed in the selected cell.
Here’s an example:

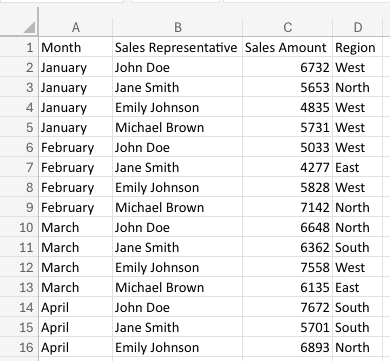
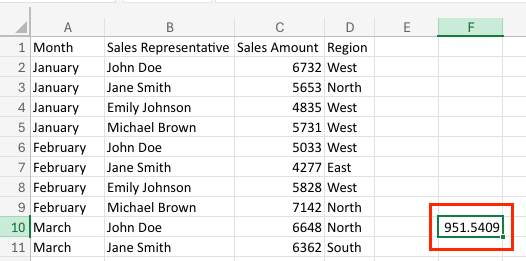
In this example, we’re calculating the sample standard deviation for the values in the range C2:C10. The STDEV.S function returns the result of 951.5409, which represents the sample standard deviation of the dataset.

Video Tutorial
STDEV.S vs. STDEV.P: Key Differences
While the STDEV.S and STDEV.P functions may seem similar, there are important differences between them. Understanding these differences is crucial for choosing the right function for your specific data analysis needs.
The main distinction between STDEV.S and STDEV.P is the type of standard deviation they calculate:
- STDEV.S calculates the sample standard deviation, which is used when you have a sample of data and want to estimate the standard deviation of the population.
- STDEV.P calculates the population standard deviation, which is used when you have access to the entire population of data.
The formula for STDEV.S is:
=SQRT(SUM((x – mean(x))^2) / (n-1))
Where x is the individual data points, mean(x) is the average of the data points, and n is the number of data points.
The formula for STDEV.P is:
=SQRT(SUM((x – mean(x))^2) / n)
The key difference is the divisor: STDEV.S uses n-1, while STDEV.P uses n. This means that STDEV.S will always return a slightly larger value than STDEV.P, as it takes into account the uncertainty of estimating the population standard deviation from a sample.
Here’s an example to illustrate the difference:
Suppose we have a dataset of 10 values: 5, 7, 8, 6, 9, 8, 7, 6, 8, 7.
- The STDEV.S of this dataset is 1.14.
- The STDEV.P of this dataset is 1.12.
As you can see, the STDEV.S value is slightly higher than the STDEV.P value, reflecting the fact that we’re working with a sample rather than the entire population.
In general, you should use STDEV.S when you have a sample of data and want to estimate the standard deviation of the population. Use STDEV.P when you have access to the entire population of data.
Practical Applications of the STDEV.S Function
The STDEV.S function in Excel is a powerful tool that has a wide range of practical applications across various industries and scenarios. Let’s explore some real-world examples of how this function can be utilized:
Analyzing Sales Performance
One of the most common use cases for STDEV.S is in the analysis of sales data. By calculating the standard deviation of sales figures, you can gain valuable insights into the consistency and variability of your sales performance. This information can help you identify outliers, detect patterns, and make more informed decisions about your sales strategies.
Evaluating Investment Portfolios
In the financial sector, the STDEV.S function is essential for assessing the risk associated with investment portfolios. By calculating the standard deviation of returns, you can determine the volatility of your investments and make more informed decisions about asset allocation and risk management.
Monitoring Quality Control
In manufacturing and production environments, the STDEV.S function can be used to monitor quality control. By tracking the standard deviation of key metrics, such as product dimensions or defect rates, you can identify process variations and take corrective actions to maintain consistent quality.
Analyzing Survey Data
When conducting market research or customer surveys, the STDEV.S function can help you understand the distribution and variability of responses. This information can be valuable for identifying trends, segmenting your target audience, and making data-driven decisions.
Forecasting and Budgeting
In the realm of financial planning and budgeting, the STDEV.S function can be used to analyze historical data and make more accurate forecasts. By understanding the standard deviation of expenses, revenue, or other financial metrics, you can better anticipate and plan for potential fluctuations.
Calculating STDEV.S Manually
While the STDEV.S function in Excel provides a convenient way to calculate the standard deviation of a dataset, it’s important to understand the underlying mathematical formula and the manual calculation process. This knowledge can be particularly useful when working with datasets that are too large to fit in a spreadsheet or when you need to perform the calculation in a programming environment.
The formula for calculating the standard deviation using the STDEV.S function is:
STDEV.S = √(Σ(x – μ)^2 / (n-1))
Where:
- x represents each data point in the dataset
- μ is the mean or average of the dataset
- n is the total number of data points
To calculate the STDEV.S manually, follow these steps:
- Calculate the mean of the dataset.
- For each data point, subtract the mean and square the result.
- Sum up all the squared differences.
- Divide the sum by the number of data points minus 1.
- Take the square root of the result to get the standard deviation.
Let’s illustrate this with an example. Suppose we have the following dataset: [10, 15, 12, 18, 14].
- Calculate the mean: (10 + 15 + 12 + 18 + 14) / 5 = 13.8
- Subtract the mean and square the results:
- (10 – 13.8)^2 = 9.64
- (15 – 13.8)^2 = 1.44
- (12 – 13.8)^2 = 4.84
- (18 – 13.8)^2 = 16.84
- (14 – 13.8)^2 = 0.04
- Sum the squared differences: 9.64 + 1.44 + 4.84 + 16.84 + 0.04 = 32.8
- Divide by the number of data points minus 1: 32.8 / (5 – 1) = 8.2
- Take the square root: √8.2 = 2.86
Therefore, the manual calculation of the STDEV.S for this dataset is 2.86.

Stop exporting data manually. Sync data from your business systems into Google Sheets or Excel with Coefficient and set it on a refresh schedule.
Get Started
Using STDEV.S in Google Sheets and VBA
While the STDEV.S function is primarily associated with Microsoft Excel, it’s also available in other spreadsheet applications, such as Google Sheets. The usage and syntax are very similar, making it easy to transition between the two.
In Google Sheets, you can use the STDEV.S() function to calculate the standard deviation of a dataset. The syntax is the same as in Excel:
=STDEV.S(range_of_values)
For example, to calculate the standard deviation of the values in cells A1 to A10, you would use the following formula:
=STDEV.S(A1:A10)
In addition to using the function directly in the spreadsheet, you can also automate the STDEV.S calculation using VBA (Visual Basic for Applications) in Excel. Here’s a simple example of a VBA subroutine that calculates the standard deviation of a range of values:
Sub CalculateSTDEV()
Dim data_range As Range
Dim result As Double
‘ Specify the range of values to calculate the STDEV.S
Set data_range = Range(“A1:A10”)
‘ Calculate the standard deviation
result = Application.WorksheetFunction.StDevP(data_range)
‘ Display the result
MsgBox “The standard deviation is: ” & result
End Sub
This subroutine first defines the range of values to be used in the calculation, then calls the StDevP() function (the population standard deviation function) to compute the standard deviation. Finally, it displays the result in a message box.
By understanding how to use the STDEV.S function in both Google Sheets and VBA, you can expand your data analysis capabilities and apply the standard deviation calculation in a wider range of scenarios.
Common Pitfalls and Troubleshooting Tips for STDEV.S
While the STDEV.S function is relatively straightforward to use, there are a few common pitfalls and potential issues to be aware of:
- Incorrect Data Range: Ensure that you have selected the correct range of cells for the STDEV.S calculation. Accidentally including or excluding data points can significantly impact the result.
- Handling Blank or Non-Numeric Cells: The STDEV.S function will ignore blank cells or non-numeric values in the dataset. If your data contains these types of cells, make sure to either remove them or replace them with appropriate values before performing the calculation.
- Interpreting the Result: Remember that the standard deviation is a measure of the spread or variability of the data. A higher standard deviation indicates greater dispersion, while a lower standard deviation suggests the data points are more tightly clustered around the mean.
- Dealing with Outliers: Outliers, or data points that are significantly different from the rest of the dataset, can skew the standard deviation calculation. Consider identifying and addressing outliers before performing the STDEV.S analysis.
- Selecting the Appropriate Function: Depending on your specific needs, you may need to use the STDEV.P function instead of STDEV.S. The STDEV.P function calculates the population standard deviation, while STDEV.S is used for sample standard deviation.
To troubleshoot any issues with the STDEV.S function, consider the following tips:
- Verify the Data: Double-check your dataset to ensure that it contains only valid, numeric values and that there are no blank or non-numeric cells.
- Check the Function Syntax: Ensure that you are using the correct function name and that the syntax is correct, including the appropriate range of cells.
- Perform Manual Calculations: As demonstrated earlier, you can calculate the standard deviation manually to verify the results from the STDEV.S function.
- Consult Excel Help or Online Resources: If you’re still encountering issues, refer to the Excel help documentation or search for relevant online resources and tutorials for further guidance.
By being aware of these common pitfalls and following the troubleshooting tips, you can ensure that the STDEV.S function functions effectively and obtains accurate results for your data analysis needs.
Use STDEV.S to Uncover Data Patterns
STDEV.S helps you measure data spread, useful for sales analysis, investment evaluation, or quality control. However, manually updating data for these calculations can be tedious.
Coefficient pulls live data from Salesforce, QuickBooks, and other systems directly into Excel. Update your spreadsheets automatically today!


