Statistical analysis in Excel doesn’t have to be complex. Whether you’re analyzing sales data, conducting market research, or evaluating student performance, Excel’s built-in statistical functions help you uncover insights quickly and accurately. This comprehensive guide walks you through essential statistical calculations in Excel, from basic measures to advanced probability distributions.
Calculate Basic Statistical Measures in Excel
Central Tendency Measures
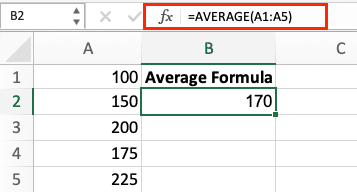
- AVERAGE Function Calculate the arithmetic mean of a dataset:
=AVERAGE(range)
Example:
|
Sales Data |
AVERAGE Formula |
Result |
|---|---|---|
|
100, 150, 200, 175, 225 |
=AVERAGE(A1:A5) |
170 |
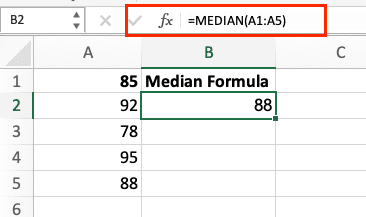
- MEDIAN Function Find the middle value in your dataset:
=MEDIAN(range)
Example:
|
Test Scores |
MEDIAN Formula |
Result |
|---|---|---|
|
85, 92, 78, 95, 88 |
=MEDIAN(A1:A5) |
88 |
- MODE Function Identify the most frequently occurring value:
=MODE.SNGL(range)
Example:
|
Product Ratings |
MODE Formula |
Result |
|---|---|---|
|
4, 5, 4, 3, 4, 5 |
=MODE.SNGL(A1:A6) |
4 |

Data Spread Calculations
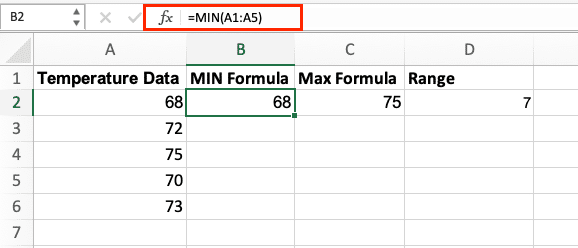
- MIN and MAX Functions
=MIN(range)
=MAX(range)
Example:
|
Temperature Data |
MIN Formula |
MAX Formula |
Range |
|---|---|---|---|
|
68, 72, 75, 70, 73 |
=MIN(A1:A5) = 68 |
=MAX(A1:A5) = 75 |
7 |
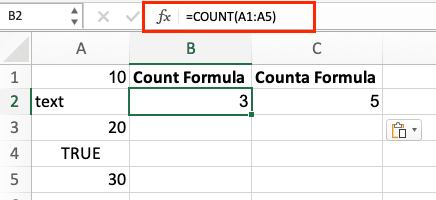
- COUNT and COUNTA Functions
=COUNT(range) // Counts numbers only
=COUNTA(range) // Counts non-empty cells
Example:
|
Mixed Data |
COUNT Formula |
COUNTA Formula |
|---|---|---|
|
10, “text”, 20, TRUE, 30 |
=COUNT(A1:A5) = 3 |
=COUNTA(A1:A5) = 5 |
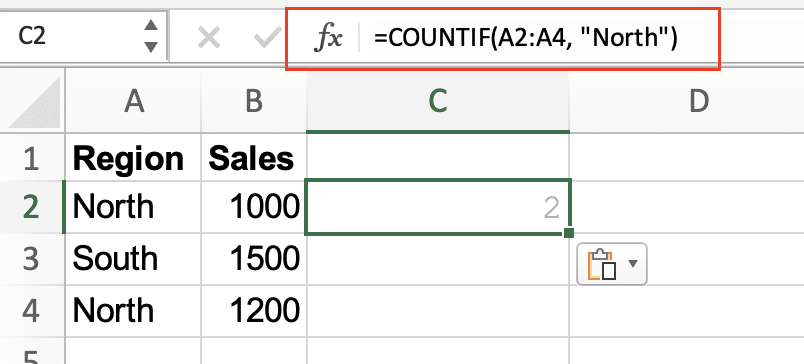
- SUMIF and COUNTIF Functions
=SUMIF(range, criteria, [sum_range])
=COUNTIF(range, criteria)
Example:
|
Region |
Sales |
|---|---|
|
North |
1000 |
|
South |
1500 |
|
North 
Try the Free Spreadsheet Extension Over 500,000 Pros Are Raving About
Stop exporting data manually. Sync data from your business systems into Google Sheets or Excel with Coefficient and set it on a refresh schedule. Get Started |
1200 |
=SUMIF(A2:A4, “North”, B2:B4) // Result: 2200
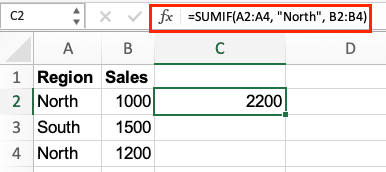
=COUNTIF(A2:A4, “North”) // Result: 2
Analyze Data Distribution and Variance
Standard Deviation and Variance
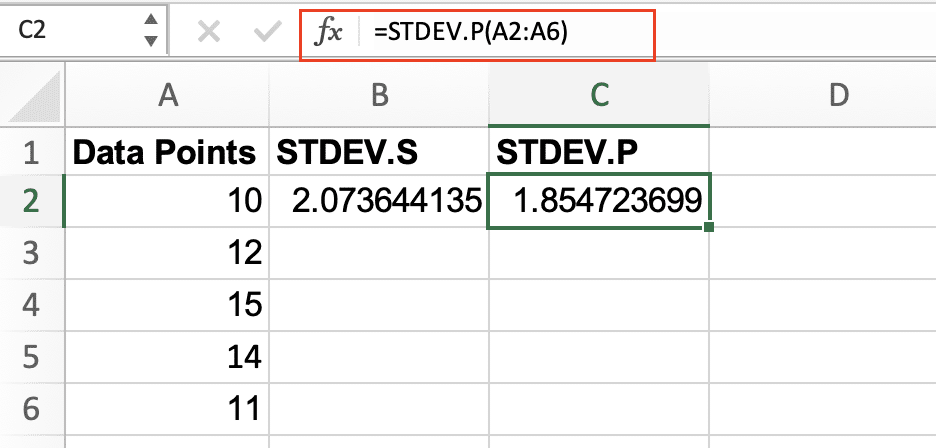
- STDEV.S and STDEV.P Functions
=STDEV.S(range) // Sample standard deviation
=STDEV.P(range) // Population standard deviation
Example:
|
Data Points |
STDEV.S |
STDEV.P |
|---|---|---|
|
10, 12, 15, 14, 11 |
=STDEV.S(A2:A6) = 2.07 |
=STDEV.P(A2:A6) = 1.85 |
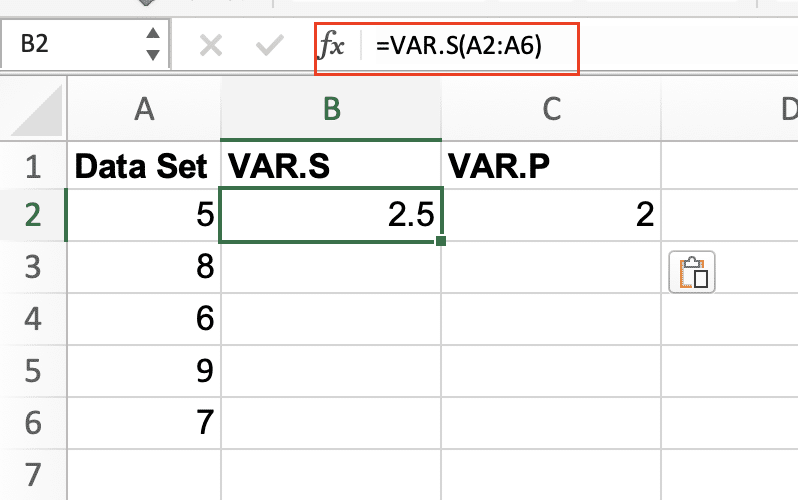
- VAR.S and VAR.P Functions
=VAR.S(range) // Sample variance
=VAR.P(range) // Population variance
Example:
|
Data Set |
VAR.S |
VAR.P |
|---|---|---|
|
5, 8, 6, 9, 7 |
=VAR.S(A2:A6) = 2.5 |
=VAR.P(A2:A6) = 2 |
Quartiles and Percentiles
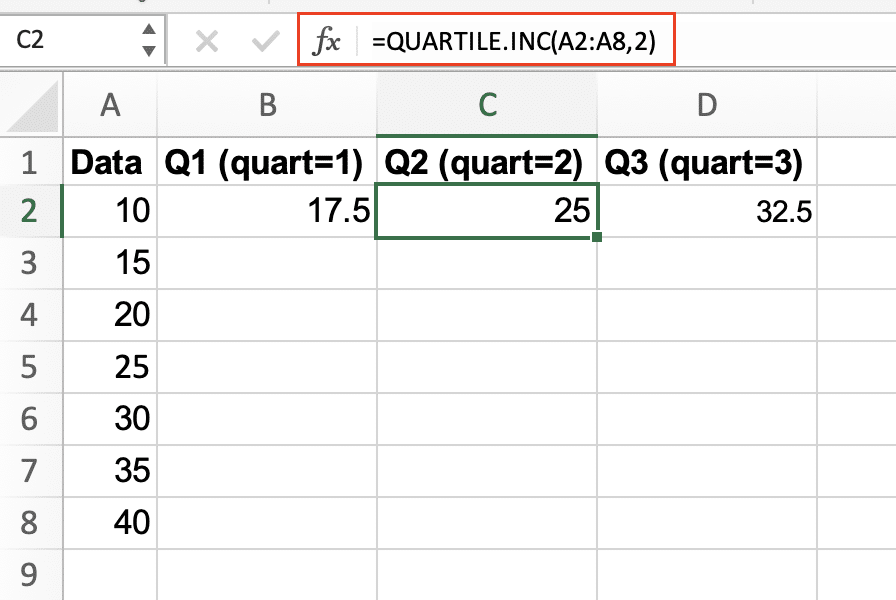
- QUARTILE.INC Function
=QUARTILE.INC(range, quart)
Example:
|
Data |
Q1 (quart=1) |
Q2 (quart=2) |
Q3 (quart=3) |
|---|---|---|---|
|
10, 15, 20, 25, 30, 35, 40 |
=QUARTILE.INC(A2:A8,1) = 17.5 |
=QUARTILE.INC(A2:A8,2) = 25 |
=QUARTILE.INC(A2:A8,3) = 32.5 |
Next Steps
Excel’s statistical functions transform complex data analysis into simple calculations. From basic averages to advanced probability distributions, these functions help you understand your data better and make informed decisions.
Ready to connect your spreadsheets with live data from your business systems? Start using Coefficient.


