Excel’s percentile functions help you analyze data distribution and identify key thresholds in your datasets. Whether you’re evaluating student scores, analyzing sales performance, or measuring customer satisfaction, understanding how to calculate percentiles is essential for meaningful statistical analysis. This comprehensive guide will walk you through everything you need to know about using percentile functions in Excel, from basic calculations to advanced techniques.
How to Calculate Basic Percentiles in Excel
Percentiles divide your dataset into 100 equal parts, helping you understand where specific values fall within your distribution. Excel offers two main percentile functions: PERCENTILE.INC and PERCENTILE.EXC.
Let’s start with a basic example using PERCENTILE.INC:
- Open your Excel spreadsheet
- Enter your dataset in a column (A2:A11)
- Use the following syntax:
Copy
=PERCENTILE.INC(array, k)
Where:
- array: Your data range
- k: The percentile you want to calculate (between 0 and 1)
Example Dataset:
|
Sales Values |
|---|
|
1000 |
|
1200 |
|
1500 |
|
1800 |
|
2000 |
|
2200 |
|
2500 |
|
2800 |
|
3000 |
|
3500 |
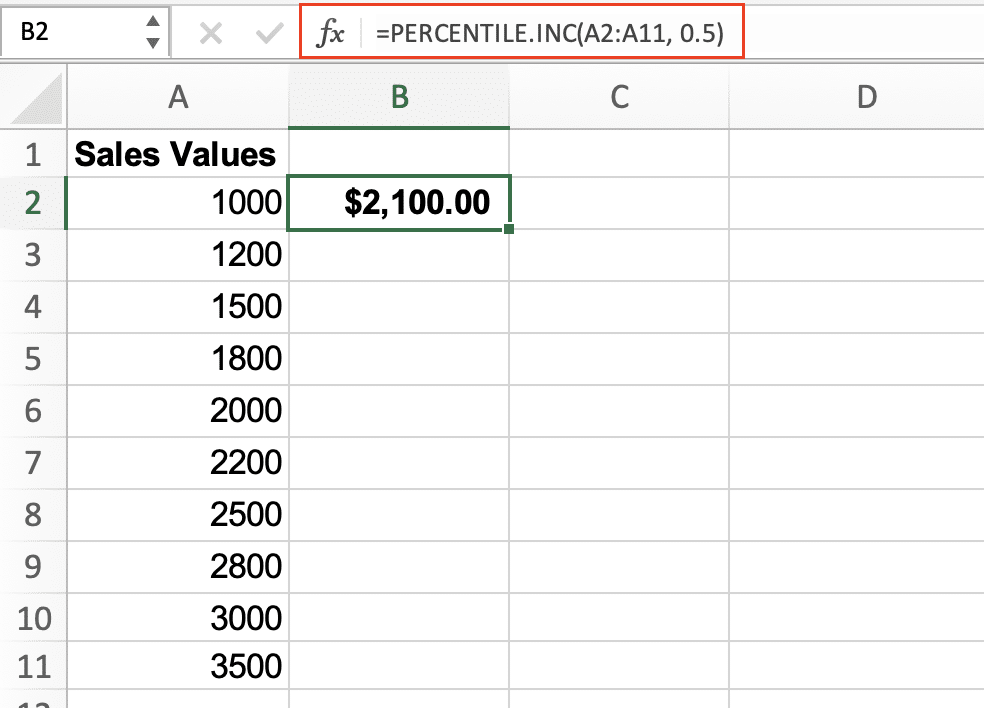
To calculate the 50th percentile (median):
Copy
=PERCENTILE.INC(A2:A11, 0.5)
Result: 2100
Calculate the 75th Percentile in Excel
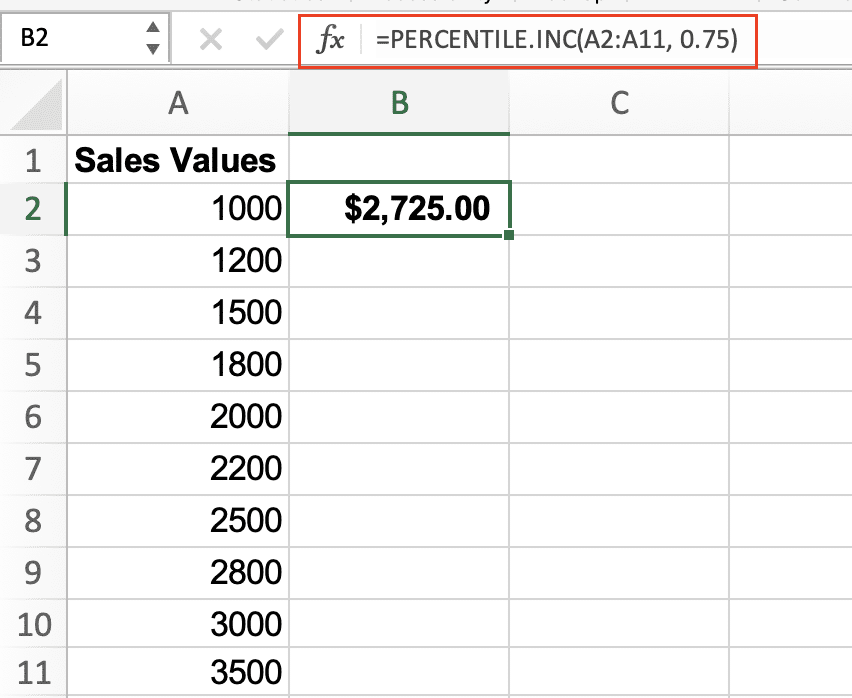
The 75th percentile is particularly useful for identifying top performers or high-value data points. Here’s how to calculate it:
- Select a cell for your result
- Enter the formula:
Copy
=PERCENTILE.INC(A2:A11, 0.75)
Result: 2725
This means 75% of values in your dataset fall below 2725.
Finding the 95th Percentile for Performance Metrics
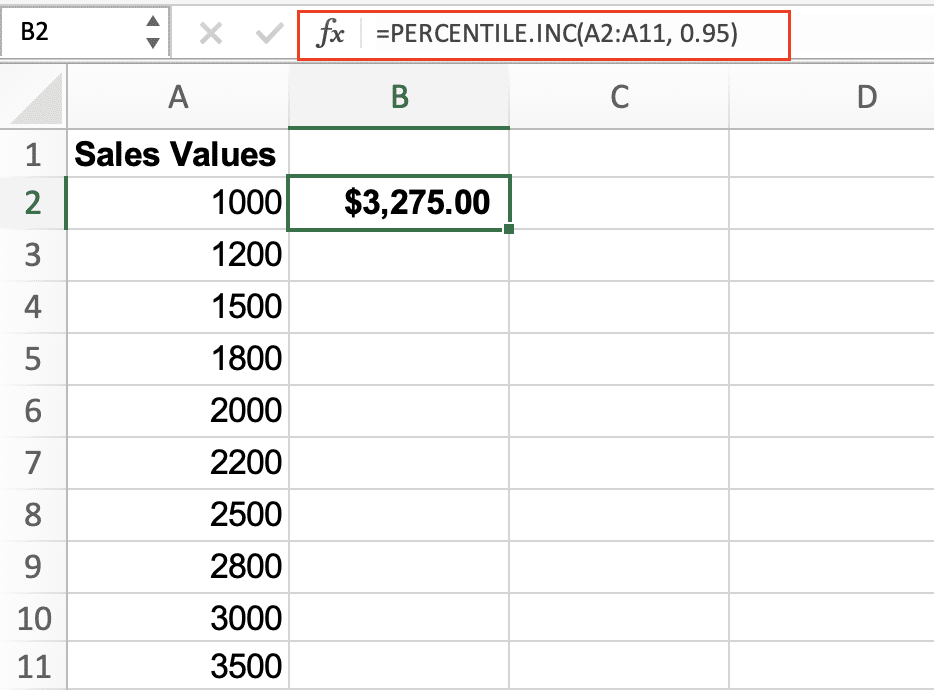
For performance analysis, the 95th percentile helps identify exceptional cases:
- Use the formula:
Copy
=PERCENTILE.INC(A2:A11, 0.95)
Result: 3275
Pro Tip: When analyzing large datasets, consider using Excel Tables to make your percentile calculations dynamic and automatically update with new data.
Using PERCENTILE.INC vs PERCENTILE.EXC Functions
Understanding the difference between PERCENTILE.INC and PERCENTILE.EXC is crucial for accurate analysis:
PERCENTILE.INC:
- Includes the lowest and highest values
- k value range: 0 to 1
- Most commonly used for general analysis
PERCENTILE.EXC:
- Excludes the lowest and highest values
- k value range: 1/n to 1 – (1/n)
- Preferred for statistical sampling
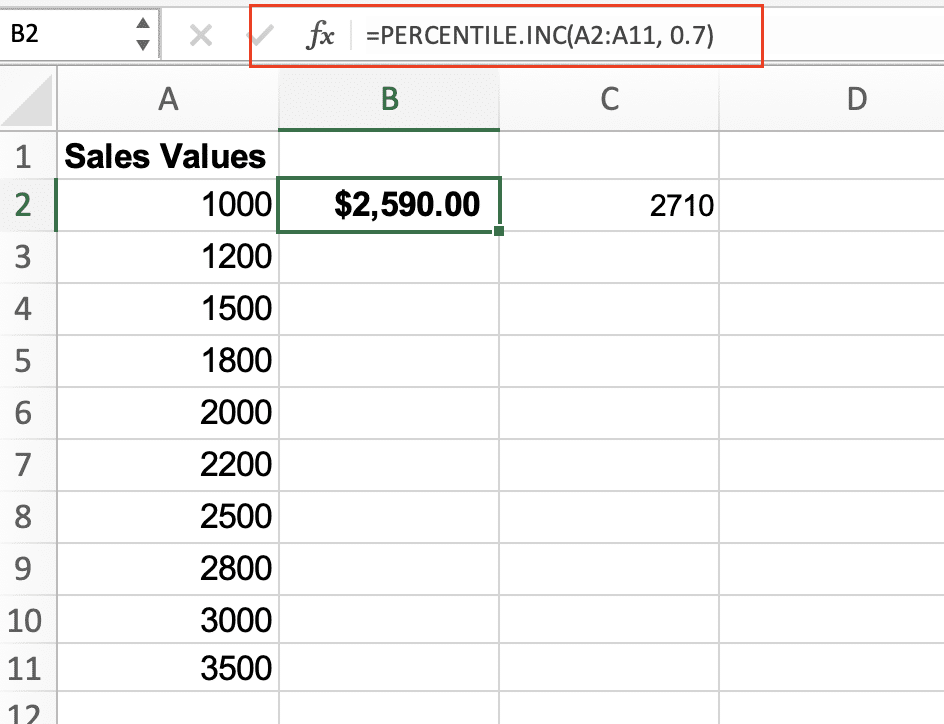
Comparison Example:
|
Function |
Formula 
Try the Free Spreadsheet Extension Over 500,000 Pros Are Raving About
Stop exporting data manually. Sync data from your business systems into Google Sheets or Excel with Coefficient and set it on a refresh schedule. Get Started |
Result |
|---|---|---|
|
PERCENTILE.INC |
=PERCENTILE.INC(A2:A11, 0.7) |
2590 |
|
PERCENTILE.EXC |
=PERCENTILE.EXC(A2:A11, 0.7) |
2710 |
Creating Percentile-Based Rankings
To create rankings based on percentiles:
- Set up your data in a table
- Use this array formula:
Copy
=RANK(cell_reference, range, [order])/COUNT(range)
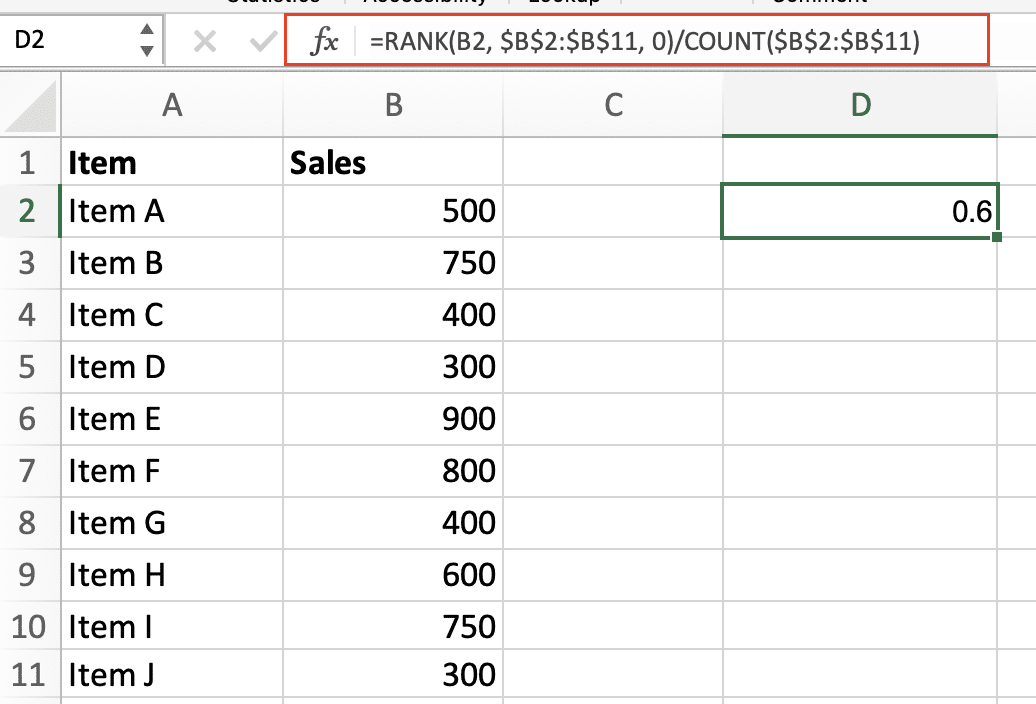
Example for ranking sales performance:
Copy
=RANK(B2, $B$2:$B$11, 0)/COUNT($B$2:$B$11)
Calculating Percentiles for Multiple Data Groups
When working with categorized data, you can use nested formulas:
- Organize data by category
- Use this structure:
Copy
=IF(category_cell=”Group1″, PERCENTILE.INC(IF(category_range=”Group1″,value_range,””), k), “”)

Percentile Calculations in Excel Tables
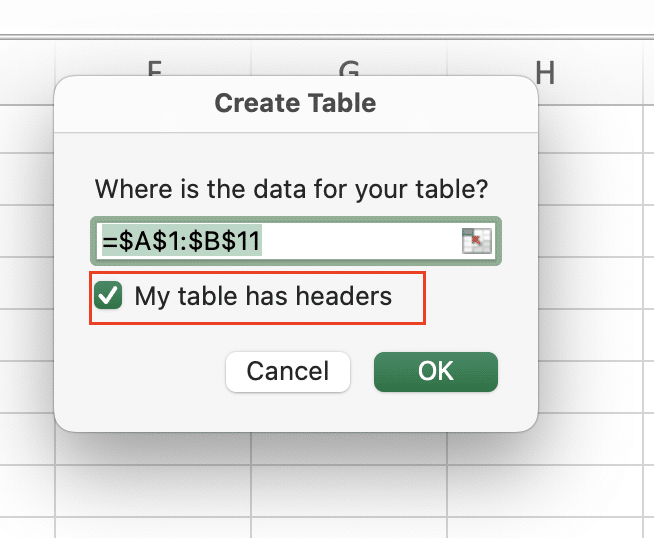
Converting your data to an Excel Table enhances percentile analysis:
- Select your data range
- Press Ctrl + T
- Check “My table has headers“
- Add a calculated column for percentiles:
Copy
=PERCENTILE.INC([@[Value_Column]], 0.75)
Pro Tip: Use structured references in Tables to make formulas more readable and maintainable.
Next Steps
Now that you understand how to implement percentile functions in Excel, you can apply these techniques to analyze performance metrics, identify outliers, and make data-driven decisions. For more advanced data analysis and real-time reporting capabilities, consider using Coefficient to connect your spreadsheets directly to your business systems.

