Are you struggling to calculate margin of error in Excel? You’re not alone. Many users find this statistical concept challenging, but it’s crucial for interpreting data accurately. This guide will walk you through the process step-by-step, from understanding the basics to mastering advanced techniques.
Essential Excel Functions for Margin of Error Calculations
Before diving into the calculation process, let’s review the key Excel functions you’ll need:
CONFIDENCE.NORM and CONFIDENCE.T Functions
These functions calculate the confidence interval for a population mean:
- CONFIDENCE.NORM: Use for large sample sizes (n ≥ 30) or when the population standard deviation is known.
- CONFIDENCE.T: Use for small sample sizes (n < 30) or when the population standard deviation is unknown.
Syntax:
CONFIDENCE.NORM(alpha, standard_dev, size)
CONFIDENCE.T(alpha, standard_dev, size)
Where:
- alpha = 1 – confidence level
- standard_dev = sample standard deviation
- size = sample size
Example:
=CONFIDENCE.NORM(0.05, 10, 100)
This calculates the confidence interval for a 95% confidence level (1 – 0.05), with a standard deviation of 10 and a sample size of 100

.
STDEV.S and STDEV.P Functions
These functions calculate the standard deviation:
- STDEV.S: Use for sample standard deviation
- STDEV.P: Use for population standard deviation (when you have data for the entire population)
Syntax:
STDEV.S(number1, [number2], …)
STDEV.P(number1, [number2], …)
Example:
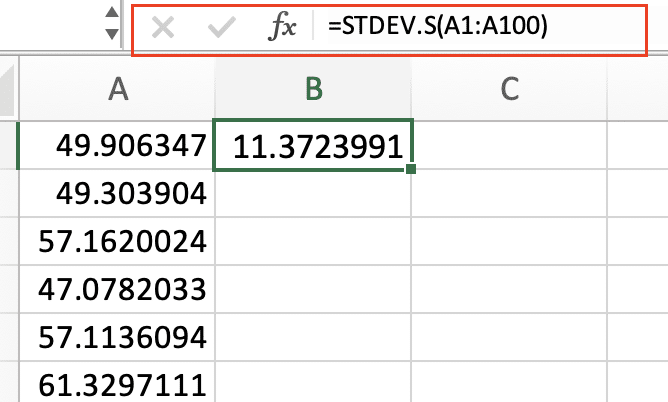
=STDEV.S(A1:A100)
This calculates the sample standard deviation for values in cells A1 through A100.
Other Useful Excel Functions
- NORM.INV: Finds Z-scores for normal distributions
- SQRT: Calculates square roots (used in standard error calculations)
- COUNT: Determines sample size
Step-by-Step Guide to Calculating Margin of Error in Excel
Now, let’s walk through the process of calculating margin of error in Excel:
Step 1: Prepare Your Data
- Open a new Excel spreadsheet.
- Enter your data in column A, starting from cell A1.
- Label your data in cell A1 (e.g., “Values”).
Step 2: Calculate Standard Error
Standard error is a crucial component of margin of error calculations. To calculate it:
- In cell B1, enter “Standard Error“.
- In cell B2, enter the following formula:
=STDEV.S(A2:A100)/SQRT(COUNT(A2:A100))
(Adjust the range A2:A100 to match your data)
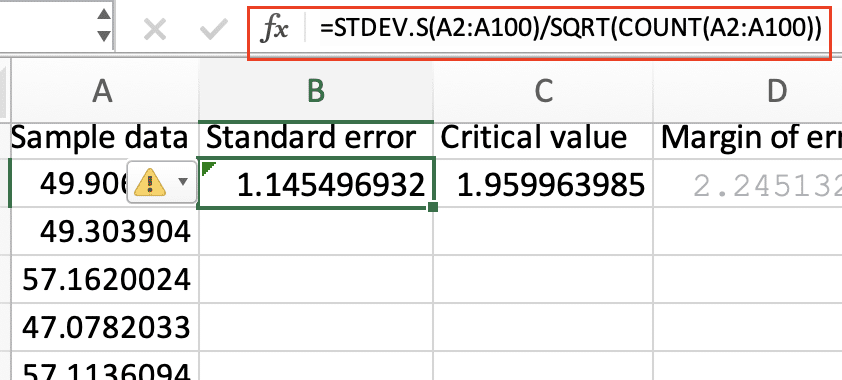
This formula calculates the sample standard deviation and divides it by the square root of the sample size.
Step 3: Determine the Critical Value
The critical value depends on your desired confidence level. For a 95% confidence level:
- In cell C1, enter “Critical Value“.
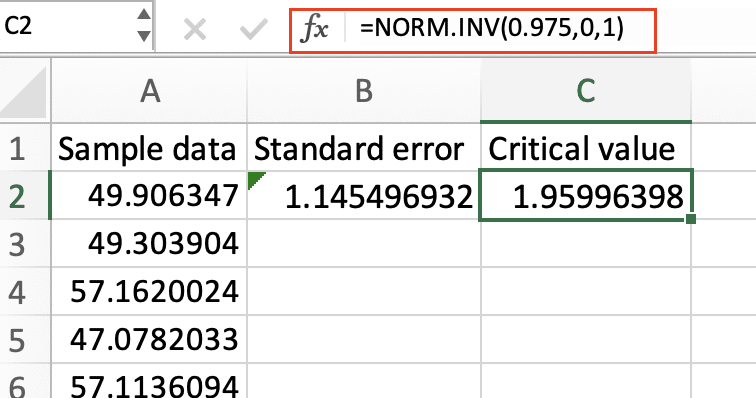
- In cell C2, enter the following formula:
=NORM.INV(0.975,0,1)
This returns the Z-score for a 95% confidence level (1.96).
For other confidence levels, adjust the probability in the NORM.INV function:

Stop exporting data manually. Sync data from your business systems into Google Sheets or Excel with Coefficient and set it on a refresh schedule.
Get Started
- 90% confidence: Use 0.95
- 99% confidence: Use 0.995
Step 4: Calculate Margin of Error
Now, combine the standard error and critical value to get the margin of error:
- In cell D1, enter “Margin of Error“.
- In cell D2, enter the following formula:
=B2*C2
This multiplies the standard error by the critical value.

Step 5: Interpret the Results
The value in cell D2 is your margin of error. Interpret it as follows:
“We can be 95% confident that the true population mean falls within [sample mean] ± [margin of error].”
To calculate the sample mean:
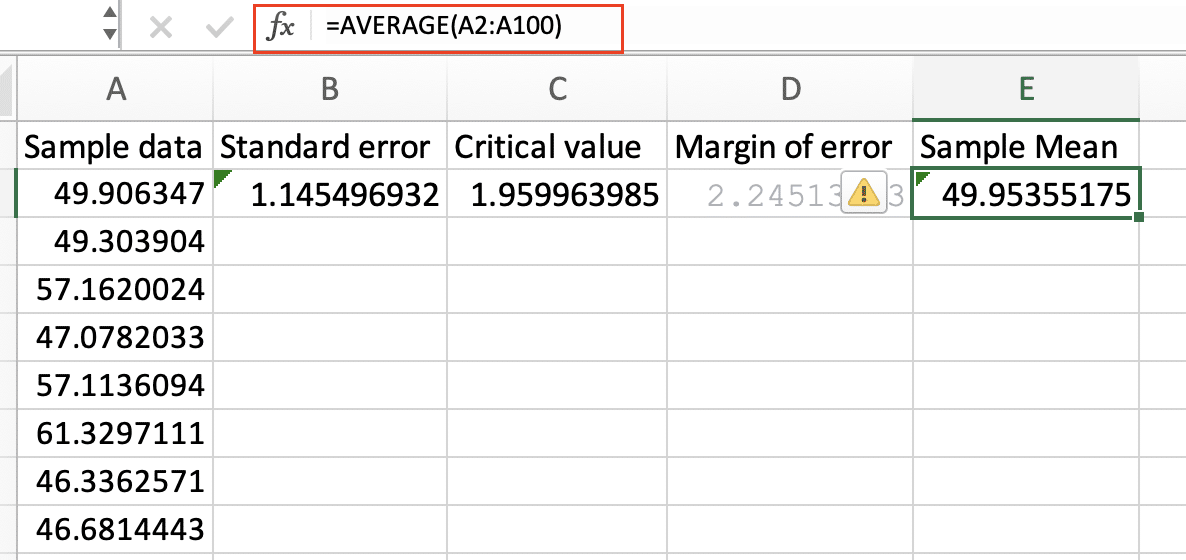
- In cell E1, enter “Sample Mean“.
- In cell E2, enter:
=AVERAGE(A2:A100)
(Adjust the range to match your data)
Advanced Techniques for Margin of Error Analysis
Using Excel’s Data Analysis ToolPak
Excel’s Data Analysis ToolPak offers more advanced statistical tools:
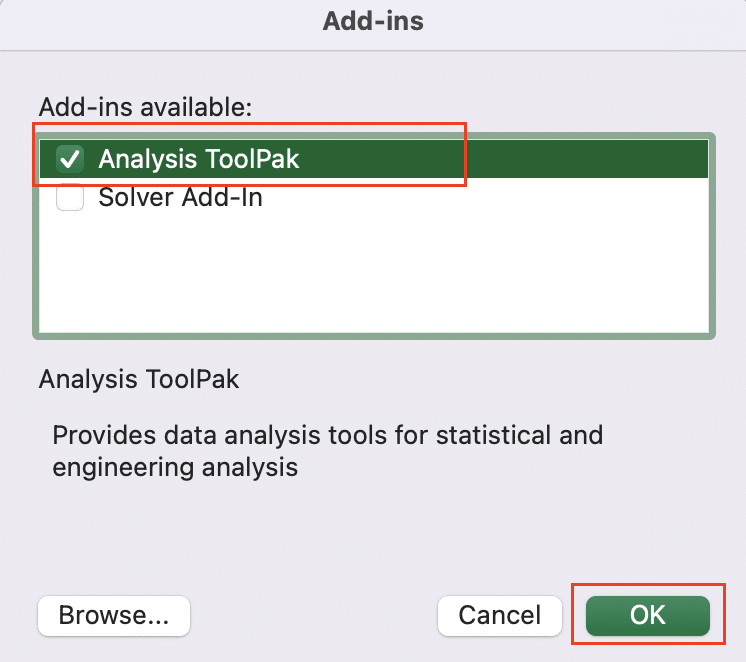
- Enable the Data Analysis ToolPak:
- Go to Tools > Excel Add-Ins

- Select “Analysis ToolPak” and click “OK“
- Use the Descriptive Statistics tool:
- Go to Data > Data Analysis

- Select “Descriptive Statistics” and click “OK“

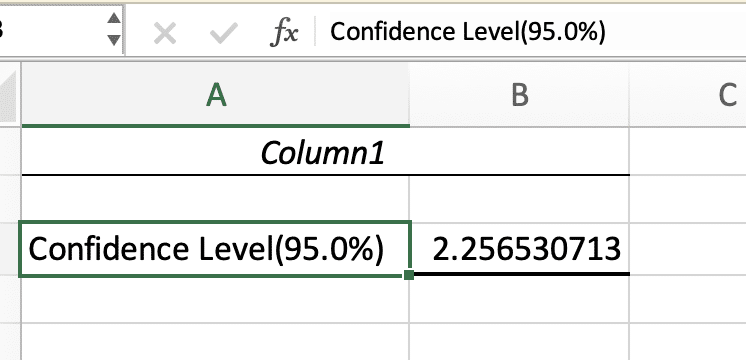
- Input your data range and check “Confidence Level for Mean“
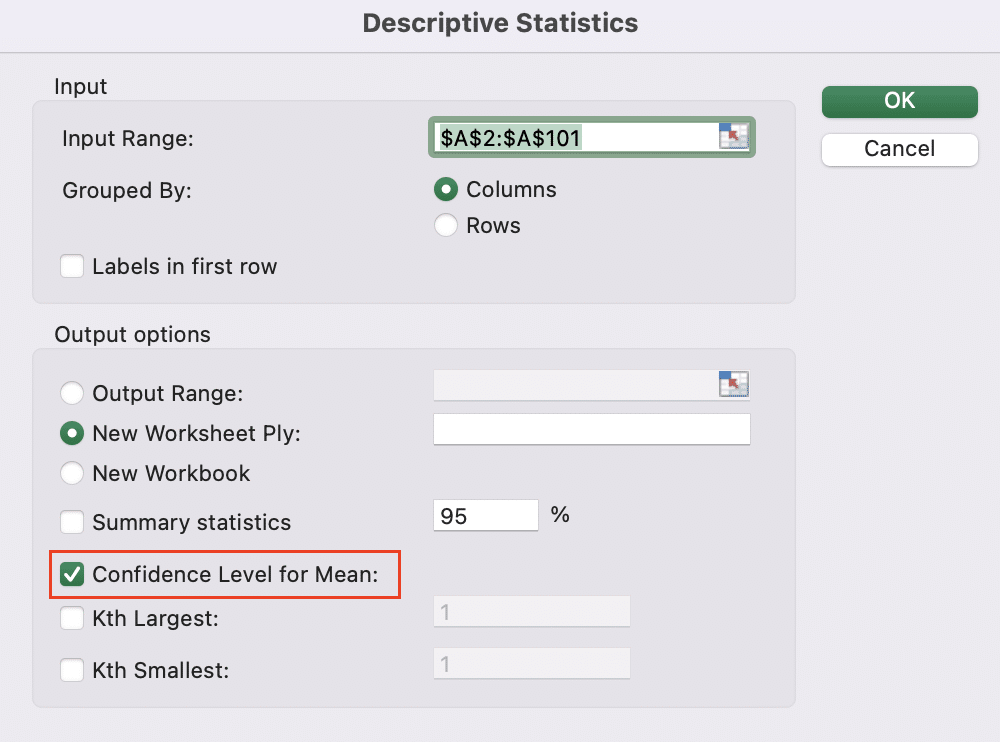
- Click “OK” to generate a comprehensive statistical report
Creating Dynamic Margin of Error Calculators
Build an interactive calculator:
- Create input cells for:
- Sample size
- Standard deviation
- Confidence level
- Use data validation to create a drop-down menu for confidence levels:
- Select the confidence level cell
- Go to Data > Data Validation

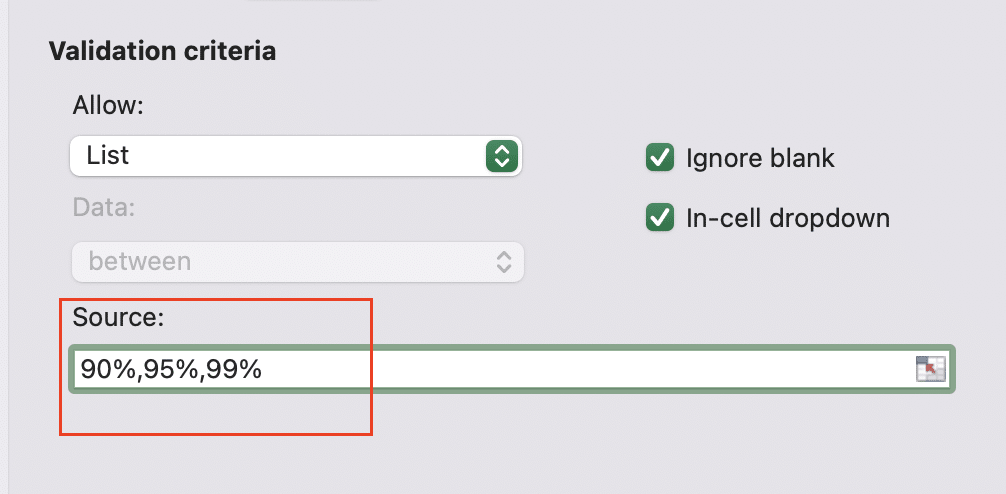
- Set “Allow” to “List“
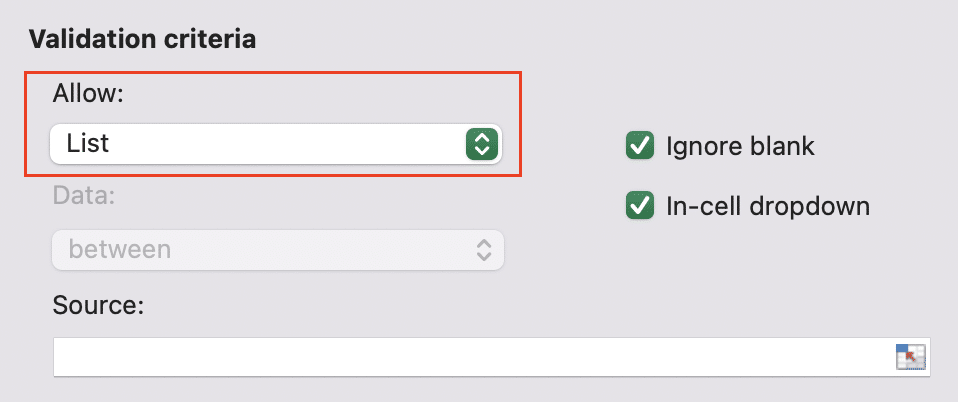
- In “Source,” enter: 90%,95%,99%
- Use nested IF statements to determine the appropriate critical value based on the selected confidence level.
- Link your margin of error calculation to these input cells for a dynamic result.
Visualizing Margin of Error in Excel Charts
To add error bars to your charts:
- Create a column chart with your data.
- Select the data series in the chart.
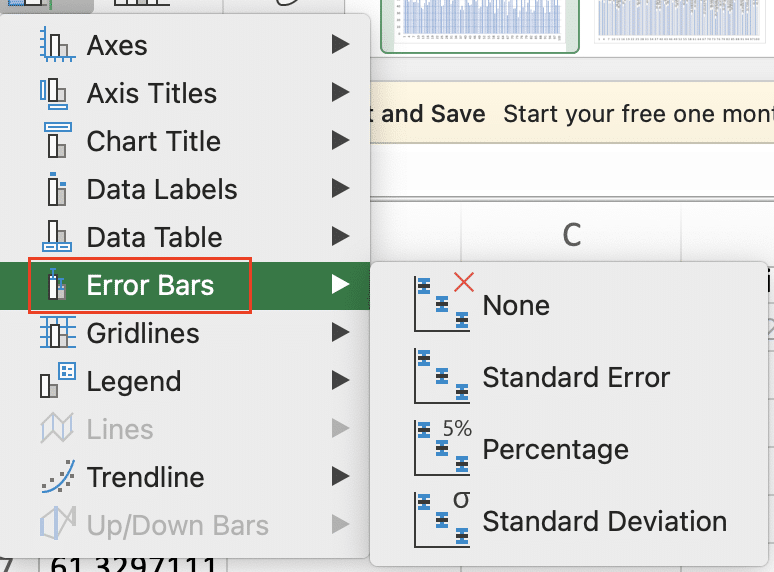
- Click the “+” button next to the chart to add chart elements.

- Choose “Error Bars.” Select your choice of the error bar type
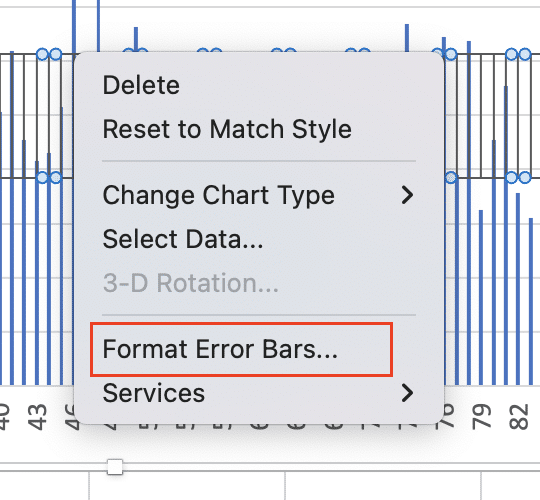
- Right-click on the Error bar and select ‘Formar Error Bars’
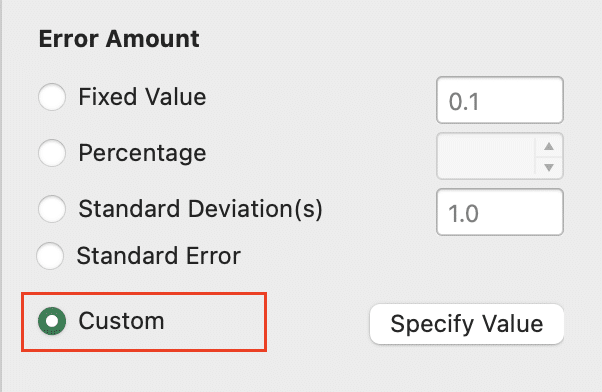
- Set “Error Amount” to “Custom” and specify your margin of error values.
Understanding Margin of Error in Excel
What is Margin of Error?
Margin of error represents the range of values above and below a sample statistic within which the true population parameter is likely to fall. It’s a critical component in statistical analysis, particularly when working with sample data to make inferences about a larger population.
In business and research, margin of error helps:
- Assess the reliability of survey results
- Determine the precision of experimental outcomes
- Evaluate the accuracy of polling data
The margin of error is closely tied to confidence intervals. A 95% confidence interval, for example, means we can be 95% certain that the true population parameter falls within the range defined by the sample statistic plus or minus the margin of error.
Key Components of Margin of Error
To calculate margin of error accurately, you need to understand its key components:
- Sample size: The number of observations in your dataset.
- Confidence level: The probability that the true population parameter falls within the confidence interval.
- Standard deviation: A measure of variability in your data.
- Population size: The total number of individuals in the group you’re studying (if known).
Each of these factors influences the margin of error. Generally:
- Larger sample sizes lead to smaller margins of error
- Higher confidence levels result in larger margins of error
- Greater variability (standard deviation) increases the margin of error
Conclusion
Mastering margin of error calculations in Excel is crucial for accurate data analysis and informed decision-making. By understanding the concepts, utilizing the right functions, and following best practices, you can confidently interpret your data and make reliable inferences about populations based on sample statistics.
Ready to take your Excel data analysis to the next level? Get started with Coefficient (https://coefficient.io/get-started) to enhance your Excel capabilities and improve the accuracy of your margin of error calculations with real-time data integration.


